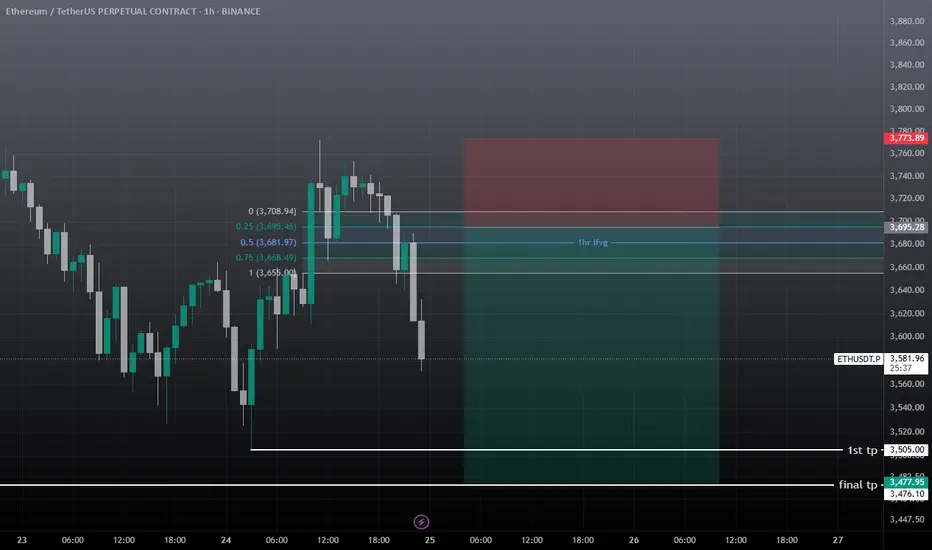
eth usdt short setupEth showing some correction towards 3.4-3.2k , I'm not bearish but alts needs some correction before another mini leg-up, must use sl, take some entry at 3681 and other on 3695. If tp hits first then ignore it.
Etherium
SOLANA $250 INCOMING? or $150 again?We can see a wedge is forming, price is at a major point, break above with a failed break below the resistance - we see high potential for $250.
Failed breakthroughs and a rejection? We see $150 once more.
Thoughts?

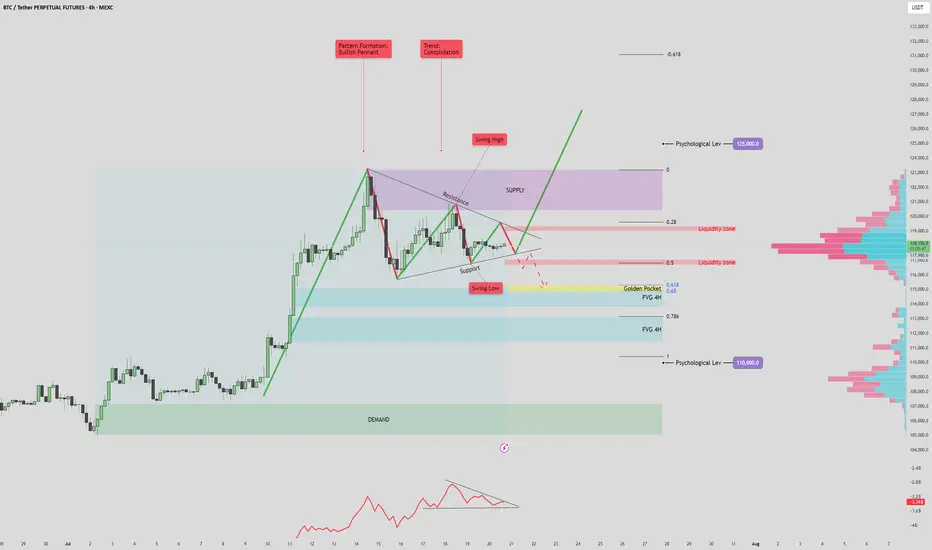
BTC/USDT 125k? or 110k fall again?BTC/USDT 4H Analysis – July 20, 2025
The current market structure shows a bullish pennant forming after a strong impulsive move upward, with price consolidating between key support and resistance levels. This pattern, combined with volume signals and key price zones, suggests a potential for a high-volatility breakout.
🔷 Volume Profile & OBV Insights
The On-Balance Volume (OBV) indicator is forming a symmetrical triangle, indicating a volume squeeze. This suggests a potential sudden spike in volume that could confirm the next major move.
Anchored Volume Profile (VPVR) on the right shows a notable low-volume area between 112K–115K. If price breaks below this zone, it could lead to a rapid selloff toward deeper fair value areas due to reduced liquidity support.
📈 Bullish Scenario
If price breaks above the pennant resistance and 119.5K liquidity zone, it may signal bullish continuation.
A successful retest of the breakout level as support would confirm strength, opening the door to:
Short-term target: 123K (supply zone and previous swing high)
Mid-term target: 125K (key psychological level and potential ATH)
Watch for confirmation via OBV breakout and strong bullish volume. Failure to sustain above the 118K–119K area could signal a bull trap.
📉 Bearish Scenario
A breakdown below pennant support and the 115K level would likely trigger a move into the low-volume range.
First key downside target: 114.7K–115.7K, which aligns with the Golden Pocket (Fib 0.618 zone) and a 4H Fair Value Gap (FVG).
This zone may act as a support or a liquidity grab reversal area.
If this zone fails to hold, deeper downside targets become likely:
FVG 2 (~112K)
Psychological support at 110K, which aligns with strong historical demand and a major VPVR node.
This bearish move may either confirm further downside momentum or present a fakeout opportunity if price sharply reverses from one of these deeper levels.
✅ Summary
BTC is coiled within a bullish pennant, with both bullish continuation and bearish breakdown scenarios in play. Volume confirmation and breakout direction will be key. Traders should monitor how price reacts around the 115K–118K zone for directional clarity. A move beyond this range, especially with volume support, will likely define the next trend leg.
Ethereum's Road to $7500 – Strategic Entries & Profit Optimizati🔵 Entry Zone: My first position is placed at $2225.5, aligning with a strong support level, while a secondary entry at $1857.5 serves as an additional safeguard against unexpected market swings—lowering my average purchase price and protecting capital.
💰 Profit-Taking Strategy: For low-risk traders, securing a 40% profit from the first entry is a prudent move to lock in gains early. However, my long-term target remains ambitious.
🚀 Main Target: Based on valuation models and fundamental news, Ethereum’s upside potential points toward $7500. However, I personally plan to secure 90% of my holdings at $6000, ensuring strong profit realization while leaving room for further upside.
This setup balances risk management, smart positioning, and strategic profit optimization. Let’s see how ETH’s trajectory unfolds!
Entry1: 2225.5
Entry 2: 1857.5
If your second entry is successful, you are required to withdraw 50 to 70 percent of your capital to maintain your capital. I will definitely update this setup.

ETH/USDT Price Action Analysis — Bullish Continuation Expected 📊 ETH/USDT Price Action Analysis — Bullish Continuation Expected 🚀
🔍 Chart Overview (as of June 9, 2025):
This chart of ETH/USDT highlights a well-defined support and resistance structure, projecting a potential bullish move toward a main resistance target at $2,788.00.
🧱 Key Zones:
🔵 Support Zone: $2,440 – $2,480
Price rebounded strongly from this area, showing buyer interest and liquidity absorption.
🟠 Resistance Zone: $2,660 – $2,690
Previously rejected zone where supply overtook demand. Price must break and hold above this for further upside.
🔺 Main Resistance Target: $2,788.00
If resistance is cleared, this is the next major supply area, acting as a potential take-profit level.
📈 Price Action Insight:
Price is currently hovering near $2,538.37, approaching resistance.
The chart suggests a potential breakout scenario after a short consolidation.
A bullish breakout above $2,690 could trigger a sharp rally toward the $2,788 target.
The chart projects a pullback-retest pattern (break, retest, and continuation) before the final leg up.
⚠️ Risk Management:
Invalidation Level: $2,381.49
A break below this level would invalidate the bullish setup and could lead to further downside.
✅ Summary:
Bias: Bullish 📈
Entry Area: Break and retest above resistance zone ($2,660–2,690) 🔓
Target: $2,788 🎯
Invalidation: Below $2,381.49 🚫
📌 Note: Always use proper risk management and confirm breakouts with volume or momentum indicators (e.g., RSI, MACD).

Is Ethereum Back In Business? A Confluence of Bullish Patterns Is Ethereum Back In Business? A Confluence of Bullish Patterns, Brutal Liquidations, and Fundamental Strength
The cryptocurrency market is a theater of perpetual drama, a relentless cycle of fear and greed, innovation and volatility. In this unforgiving arena, Ethereum, the world’s second-largest digital asset, has once again captured the spotlight. After a period of underperformance that left investors questioning its momentum, a confluence of technical signals, market-shaking liquidations, and strengthening fundamentals has ignited a fierce debate: Is Ethereum truly back in business? The answer is not a simple yes or no but a complex narrative woven from bullish chart patterns, the chaotic fallout of political spats, and the quiet, inexorable growth of its underlying network.
At the heart of the bullish thesis lies a classic technical analysis signal: the Morningstar candlestick pattern. For traders and analysts who scour charts for clues about future price movements, the appearance of a Morningstar on Ethereum's monthly chart is a development of profound significance. Simultaneously, the market has been violently shaken by an $800 million liquidation event, a brutal culling of leveraged positions in both Bitcoin and Ether, reportedly triggered by a public feud between political and tech titans Donald Trump and Elon Musk. This event serves as a stark reminder of the market's fragility and its susceptibility to external shocks.
Yet, beneath this surface-level chaos, a different story is unfolding. On-chain metrics point to a network that is not just surviving but thriving. Institutional interest is surging, evidenced by substantial inflows into newly approved spot Ethereum Exchange Traded Funds (ETFs). Whales, the market's largest players, are sending mixed but largely accumulative signals. And technological upgrades continue to enhance the network's scalability and utility. This article will delve into these competing narratives—the hopeful story told by the Morningstar pattern, the cautionary tale of massive liquidations, and the quietly confident hum of Ethereum's fundamental growth—to paint a comprehensive picture of where the pioneering smart contract platform stands today.
The Morningstar's Dawn: A Technical Harbinger of a Bullish Reversal
In the lexicon of technical analysis, candlestick patterns provide a visual language for market sentiment. The Morningstar is one of the most revered bullish reversal patterns, a three-candle formation that often signals the end of a downtrend and the beginning of a new upward climb. Its appearance on a high-timeframe chart, such as the monthly chart for Ethereum, carries significant weight, suggesting a major shift in market psychology from bearish despair to bullish optimism.
To understand its power, one must first understand its structure. The pattern consists of three distinct candles appearing after a prolonged price decline. The first is a long bearish candle (typically colored red or black), which confirms the continuation of the downtrend and reflects the sellers' firm control. The second candle is the "star" of the pattern—a small-bodied candle that can be either bullish or bearish. This candle often gaps down from the previous one, indicating a moment of acute indecision in the market. The selling pressure that characterized the first candle has waned, but buyers have not yet seized full control. It represents a point of equilibrium, a pause where the prevailing trend loses its momentum. The third and final candle is a long bullish candle (typically green or white) that closes well into the body of the first bearish candle. This final candle is the confirmation; it signifies that buyers have decisively taken over, overwhelming the sellers and initiating a reversal.
The psychology behind the Morningstar pattern is a story of a power shift. The long bearish candle shows sellers are confident. The small middle candle reveals that confidence is cracking; a battle for control is underway. The final strong bullish candle declares the buyers as the victors, signaling that the path of least resistance is now upwards.
Recently, several crypto analysts have highlighted the formation of this very pattern on Ethereum’s monthly chart. After a period of consolidation and price decline, the emergence of a Morningstar suggests that the bottom of the recent downtrend may be in. Analysts see this as a macro reversal signal, a technical foundation for a potential rally. Some have set initial price targets around $3,300, viewing the current resistance levels as temporary hurdles that will likely be broken in the face of this powerful bullish formation. When combined with other indicators, such as trading volume, which ideally should increase during the formation of the third candle, the Morningstar provides a compelling technical argument that Ethereum is gearing up for a significant move higher. While no technical pattern is infallible, its appearance on a macro scale has undeniably injected a strong dose of optimism into the market, suggesting that Ethereum’s period of slumber may be coming to an end.
The $800 Million Purge: A Tale of Liquidations and Political Tremors
Just as technical analysts were celebrating the bullish omens on the charts, the market delivered a brutal reminder of its inherent volatility. A massive liquidation event, totaling over $800 million and by some estimates approaching $1 billion, swept through the cryptocurrency markets, disproportionately affecting leveraged traders in Bitcoin and Ethereum. In a span of just 24 hours, hundreds of thousands of traders saw their positions forcibly closed, a cascade of selling that sent prices tumbling.
Liquidations are the boogeyman of leveraged trading. When a trader uses borrowed funds (leverage) to amplify their position, they must maintain a certain amount of collateral. If the market moves against their position and their collateral falls below a required threshold, the exchange automatically closes the position to prevent further losses. This forced selling creates a domino effect. As prices fall, more long positions hit their liquidation points, triggering more selling, which in turn drives prices down further, liquidating even more positions. This is a liquidation cascade, and it can lead to rapid and violent price drops.
Recent data showed that long positions accounted for the overwhelming majority of these liquidations, indicating that the market was caught off guard by the sudden downturn. Exchanges like Bybit and Binance were at the epicenter of this financial storm, with Bybit alone reportedly accounting for nearly $354 million in liquidations. The largest single liquidation order was a multi-million dollar position, underscoring the high stakes involved.
What triggered this sudden market panic? Many analysts pointed to an unlikely source: a public and increasingly acrimonious feud between former U.S. President Donald Trump and Tesla CEO Elon Musk. The dispute, reportedly stemming from disagreements over a major tax and spending bill, spilled out onto social media, creating a storm of uncertainty that rattled investors. In today's interconnected world, high-profile clashes between powerful figures can have an immediate and tangible impact on financial markets, particularly on assets perceived as "risk-on," such as cryptocurrencies.
The public fallout was seen as a destabilizing event, injecting political uncertainty into an already fragile market. The fear was that the conflict could have broader economic implications or affect the regulatory landscape for technology and digital assets. This sentiment sparked a broad-based sell-off, not just in crypto but across traditional equities as well. For a market driven heavily by narrative and sentiment, the Trump-Musk tussle provided a powerful bearish catalyst, spooking investors and triggering the cascade of liquidations that sent Bitcoin and Ethereum prices sharply lower. The event serves as a crucial counterpoint to the bullish technical picture, highlighting how susceptible the crypto market remains to macroeconomic and political shocks, regardless of its own internal fundamentals.
The Bullish Undercurrent: On-Chain Metrics and Institutional Adoption
While the liquidation event painted a picture of chaos and fear, a deeper dive into Ethereum's on-chain data and ecosystem developments reveals a much more optimistic and resilient narrative. These fundamental metrics, which track the health and growth of the network itself, often provide a clearer long-term signal than the noise of short-term price fluctuations.
A Thriving and Growing Network
One of the most reliable indicators of a blockchain's long-term value is its network activity. On this front, Ethereum is showing undeniable strength. The number of unique active addresses interacting with the blockchain has been on a steady rise. Recent data shows a significant surge, with weekly active addresses surpassing 17 million, a testament to growing engagement and adoption. This isn't just speculative trading; it reflects genuine usage across Ethereum's vast ecosystem, including decentralized finance (DeFi), non-fungible tokens (NFTs), and Layer 2 scaling solutions.
Furthermore, the growth in new users joining the network is a powerful leading indicator of future demand. The rate of new address creation has been on an upward trajectory, signaling that Ethereum's value proposition continues to attract a broader audience. This organic growth is the lifeblood of any network, creating a flywheel effect: more users attract more developers, who build more valuable applications, which in turn attract even more users.
The Rise of Layer 2 and Technological Upgrades
A key driver of this network growth has been the maturation of Layer 2 scaling solutions like Arbitrum, Optimism, and Base. These networks handle transactions off the main Ethereum chain, allowing for faster speeds and dramatically lower fees while still inheriting Ethereum's security. The explosion of activity on these Layer 2s has been a game-changer, alleviating congestion on the main network and making Ethereum accessible to a wider range of users and applications.
Simultaneously, core protocol upgrades continue to enhance Ethereum's capabilities. The recent Pectra upgrade, for example, has improved scalability and further refined the network's deflationary mechanics. Since the implementation of EIP-1559, a portion of every transaction fee is "burned," or permanently removed from circulation. This, combined with the vast amount of ETH locked in staking contracts, creates a dynamic where the supply of available ETH is constantly shrinking. This principle of decreasing supply coupled with increasing demand is a fundamental recipe for long-term price appreciation.
The Arrival of Institutional Capital
Perhaps the most significant bullish development for Ethereum in recent times has been the approval and successful launch of spot Ethereum ETFs in the United States. This provides a regulated and accessible on-ramp for institutional investors to gain exposure to ETH, unlocking a potential wave of new capital. The early data is promising. In May 2025 alone, spot Ethereum ETFs recorded net inflows of over half a billion dollars, a sharp increase from the previous month.
This institutional validation is a powerful signal. It signifies that some of the world's largest financial players view Ethereum not just as a speculative asset, but as a foundational technology with long-term strategic value. This flow of "sticky" institutional money is expected to provide a strong support floor for the price and reduce volatility over the long run.
The Whale Watch: Accumulation and Confidence
The behavior of "whales"—large holders of Ethereum—provides another crucial, albeit sometimes conflicting, layer of insight. On one hand, there have been reports of significant accumulation by these large players. Data shows massive transfers of ETH from exchanges to private wallets, a classic sign of long-term holding, as it reduces the immediately available supply for selling. One notable transaction involved Galaxy Digital moving hundreds of millions of dollars worth of ETH into a private wallet, suggesting strong institutional confidence. Over the past month, data from on-chain analytics firms has shown that whale wallets have increased their holdings, while retail holdings have slightly decreased, a pattern often seen before a bullish market run.
However, the picture is not entirely one-sided. There have also been instances of long-term whales selling off portions of their holdings, contributing to short-term price drops. This reflects the diverse strategies among large holders. Some may be taking profits, while others are positioning for a long-term hold. Despite the mixed short-term signals, the broader trend appears to be one of accumulation and a net outflow of ETH from exchanges, which is a fundamentally bullish indicator. With exchange balances hitting seven-year lows, the potential for a supply squeeze is becoming increasingly real.
Conclusion: Navigating the Storm Towards a Bullish Horizon
So, is Ethereum back in business? The evidence suggests a resounding, if complex, "yes." The current market environment is a fascinating juxtaposition of short-term turmoil and long-term strength. The public spat between Trump and Musk, and the subsequent $800 million liquidation event, underscore the market's vulnerability to sudden shocks and the perils of leveraged trading. These events serve as a healthy dose of caution, reminding investors that the path forward will undoubtedly be volatile.
However, when we look past the immediate noise, the underlying picture is one of robust and accelerating health. The Morningstar pattern on the monthly chart provides a powerful technical signal that a macro trend reversal is underway, suggesting that the recent period of bearish sentiment has exhausted itself. This technical optimism is strongly supported by fundamentals. Ethereum's network is growing at a remarkable pace, fueled by the success of Layer 2 solutions and continuous protocol improvements that enhance its scalability and economic model.
The most compelling evidence, however, comes from the demand side. The launch of spot Ethereum ETFs has opened the floodgates for institutional capital, a structural shift that will likely define Ethereum's market for years to come. This, combined with the steady accumulation by whales and a shrinking available supply due to burning and staking, creates a powerful bullish cocktail.
Ethereum is navigating a perfect storm of conflicting signals. The violent waves of short-term liquidations and political drama can be disorienting. But beneath the surface, the deep currents of network growth, technological innovation, and institutional adoption are flowing strongly in one direction. For investors who can look beyond the immediate horizon, the story told by Ethereum's fundamentals, supported by classic bullish chart patterns, is not just one of being "back in business"—it's a story of a platform solidifying its position as a cornerstone of the decentralized future.

ETH at a Critical Decision Level – $2260Ethereum is currently showing strong price action around the key decision level of $2260. This zone will likely determine the next major move:
A breakout above could trigger a bullish continuation.
A rejection here may send ETH down, possibly all the way toward $1000 in the long term.
📌 Stay tuned — we'll update you as the move unfolds. Keep in touch!

ETHUSD Trade Recap – +20R Hit ETHUSD Trade Recap – +20R Hit
As shared in my analysis yesterday, ETH played out perfectly.
🎯 Target was hit with precision
🔒 Executed with a tight stop-loss
📈 Final result: +20R gain
This trade was driven by structure, order flow confirmation, and disciplined execution. No guesswork — just clean setup + reaction + follow-through.
Thank you to everyone who followed the analysis. On to the next setup 👊
#ETHUSD #Crypto #TradeRecap #SmartMoney #OrderFlow #PriceAction #DisciplinePays #20R #TradingViewCommunity

Etherium..... Resisting at 50 % Fib RT.Though in an upward mood, the 50 % Fib RT seems a tuff nut to crack.
Expecting it to hold the 38.2 % Fib RT level of 2424, where the 200 DEMA too holds.
Lets see. Woukd love to add more at 2424 levels, with a strict SL if it daily closes below 2400.
Lots to learn from the markets.....

Is ETH - Next 3,000?ETHUSDT – Market Insight & Price Structure
Ethereum has been shaping a falling wedge pattern over the past 2 to 3 months—a structure that typically suggests a bullish reversal. Recently, price action confirmed a breakout above the key resistance zone between $2034 and $2040, along with a clean break of the upper trendline of the wedge. These movements point to a strong bullish signal, suggesting potential continuation to the upside.
Currently, Ethereum is approaching a significant resistance level around $2860. If price reaches this zone, we’ll be watching closely for confirmed reversal signals to consider a potential short/sell setup.
On the other hand, the primary bullish trend trade remains valid near the $2160–$2150 support range. A long position will only be considered upon confirmation, such as a bullish engulfing candlestick pattern, market structure shift (MSS), or other trusted technical signals.
Disclaimer: This is not financial advice. Always do your own research (DYOR).

#ETH is hitting a major resistance next target $4000! Here's Why#ETH is back inside the legendary 1,883-day trendline, a massive bullish signal for altcoins.
Meanwhile, BTC Dominance is getting rejected from the top, adding fuel to the altcoin momentum.
But there's one key confirmation still needed before we talk about new ATHs for ETH, BTC, and the broader altcoin market:
The 200-Week EMA.
Currently sitting around $2,237, this level needs to be claimed with a strong weekly close. ETH is trading above it right now, but the next 2 days and 4 hours are crucial.
A confirmed breakout here would signal a major shift in ETH's 200-week momentum a structural change that could trigger the next big leg up.
I believe it’s only a matter of time before ETH closes above this level. Once that happens, the next target for CRYPTOCAP:ETH would be $2980, $3488 and $4000!
What do you think?
Drop your thoughts in the comments and hit the like button if you found this valuable.
#PEACE ✌️

AI Prediction ETH/USD for 24 hour! Intraday trading!May 5, 2025 6:36 pm. ETH/USD. ETH/USD Trading Plan
Long Scenario
- Entry: $1,815 (confirmed by Supertrend long + RSI rising above 40).
- Stop-Loss (SL): $1,790 (below $1,800 support).
- Take-Profit (TP): $1,840 (below $1,850 resistance).
- Trailing Stop: 13 points (2x ATR).
Short Scenario
- Entry: $1,795 (confirmed by breakdown below $1,800 + MACD bearish crossover).
- Stop-Loss (SL): $1,820 (above $1,810–$1,820 resistance).
- Take-Profit (TP): $1,750 (above $1,780 support).
- Trailing Stop: 13 points (2x ATR).

SOLANA has obliterated ETHERIUM in this bull market.We now know that approximately 70% of all daily blockchain fees are collected on Solana chain. This reminds us of Etherium in the previous cycle. Solana's being faster and cheaper, ETH L2's cannibalizing their mother chain in activity and fees, and complexity of execution in Etherium chain might be seen as the main reasons here (please comment if any more).
When we look at the price action, we see that CRYPTOCAP:SOL has outvalued CRYPTOCAP:ETH 1200% since the start of 2023. The interesting fact is that this uptrend has been intact since then. While ETH maxis, like a religious revelation, claim that ETH will rise from its ashes and beat BTC eventually, the fundamentals and technicals do not support this idea. I predict that unless dramatical fundamental changes happen, this trend will continue throughout the final stages of this bull market. So I continue to be long SOLETH

Expeculation based on liquidity grab conceptEtherium falling from a Equal high, creating selling points and leaving behind liquidity, goin foward to grab previous external downflow liquidity and stoploss hunt so Etherium gain strenth and momemntum to reverse and start a upword liquidity grab.
this is not an financial advise just a expeculation based on market previus moves.

ETH/USDT Weekly Chart – Bullish Bounce!📊 ETH/USDT Weekly Chart – Bullish Bounce!
Ethereum just printed a strong bounce from the macro ascending trendline, holding structure since 2020. This confirms continued bullish strength on the higher timeframe. 🔥
🔹 Key Highlights:
Price is pushing up slowly to hit the major weekly resistance around $2800.
Next bullish target: $2,800 resistance zone, also aligns with the EMA cluster.
📈 A breakout above $2,800 could open the doors for $4,000+ in the coming months.
🧠 Watching for volume + some fundamental catalyst.
Do hit the like button if you like my updates.
#Peace

ETHUSDT: Possible short setupETHUSDT: Possible short setup. Wait for a good rejection in the selected area for a short position.

$ETH showing relative strengthETH is flexing its muscle 💪💪💪
Money’s rotating out of SOL and straight into ETH after the latest rug pull—this time, Libra by Argentina’s president. Meanwhile, ADA and XRP are holding strong.
Big money’s been stacking ETH heavy these past few weeks. I called it early—I’ve been accumulating ETH along with ETHA & ETHU (ETFs), and it’s paying off.
Bitcoin Dominance looks shaky, like it’s ready to roll over. If it does, that’s a major green light for real utility altcoins to shine. But BTC needs to hold 96,200, and ideally push past 97,200, to keep the overall market momentum alive.
Stay sharp. The moves are happening. 👀

ETH/USD Analysis – Bearish Breakdown AcceleratesETH/USD Analysis – Bearish Breakdown Accelerates 🔻
ETH/USD has confirmed its breakdown below $3,100, reinforcing the strong bearish momentum. The price is now testing the lower trendline of the descending channel, a key decision point for either a bounce or a further breakdown.
📉 Key Observations (Bearish Control Strengthens):
1. Clear Breakdown Below $3,100
• This confirms the downtrend continuation with increased downside risk.
• Previous support ($3,100) is now acting as resistance.
2. Bearish Volume Spike
• Increased volume during the decline signals strong seller conviction.
• If volume remains high, ETH/USD could continue falling.
3. Test of Lower Channel Trendline (~$3,000 - $3,020)
• The price is now approaching the descending channel’s lower boundary.
• This is a make-or-break zone—either a short-term bounce or a stronger breakdown.
4. 20-Period EMA as Resistance (~$3,120 - $3,130)
• ETH/USD remains below the 20 EMA, which acts as dynamic resistance.
• Any bounce is likely to be capped at the EMA or previous support ($3,100).
5. Series of Strong Bearish Candles
• A clear bearish impulse move with little sign of buyer strength.
• Suggests the downtrend is accelerating with minimal retracement.
🔻 Bearish Scenario (More Likely)
• If ETH/USD breaks below the lower trendline ($3,000 - $3,020), expect further downside.
• Next major targets:
• $2,980 - $2,950 (psychological support)
• $2,900 - $2,880 (potential extension lower)
🟡 Bullish Scenario (Less Likely – Short-term Bounce)
• A temporary bounce from the lower trendline could happen.
• Key upside resistance levels:
• $3,100 - $3,120 (previous support, now resistance)
• $3,130 - $3,150 (20 EMA – strong rejection zone)
🔹 For a true trend reversal, ETH/USD must break and hold above $3,180, which is unlikely at this point.
🎯 Trading Strategy & Considerations
📌 Short Position Setup (High Probability Trade)
• Entry: Wait for a retest of $3,100 - $3,120 as resistance.
• Stop-loss: Above $3,150 - $3,180 (above 20 EMA & trendline).
• Targets:
• First TP: $3,020
• Second TP: $3,000
• Third TP: $2,950
📌 Long Setup (Risky – Only if a Strong Bounce Occurs)
• Entry: If price holds the lower trendline and reclaims $3,100.
• Stop-loss: Below $2,980
• Targets:
• First TP: $3,120
• Second TP: $3,150
📌 Final Takeaway:
✅ ETH/USD is in a strong downtrend, with a key test at $3,000 - $3,020.
✅ A break below this level could trigger a deeper selloff.
✅ Short trades remain the best risk-reward setup unless price reclaims $3,100.

$ETH - Bullish Falling Wedge CRYPTOCAP:ETH is currently forming two bullish patterns a falling wedge ($4400 measured move) on the daily as well as an inverse head and shoulders bigger pattern ($6500 measured move). Keep and eye on 200 SMA support pattern (Yellow) that should be your line in the sand to stay bullish. Also, need BTC to stay over 100k for a bullish healthy market.

$HYPE HyperLiquid to the moonHYPE with that kind of chart pattern,
we will see GETTEX:HYPE reaching $50 soon?

ETH/USDT: Preparing for a Key Breakout from Descending WedgeEthereum (ETH/USDT) is consolidating within a descending wedge, a pattern that often precedes a bullish breakout. Here's an in-depth analysis of the setup:
1. Price Structure and Trend Overview:
The price has been consistently respecting the wedge boundaries, with a well-defined resistance line near $3,400-$3,450 and a critical support zone around $3,200.
Multiple "Change of Character" (CHoCH) points in recent sessions indicate significant battles between buyers and sellers, signaling potential momentum shifts.
The larger trend remains neutral-to-bullish as ETH holds key supports and continues to form higher lows on the longer timeframe.
2. Momentum Indicators:
RSI (Relative Strength Index):
Currently hovering near 50, indicating a balance between bullish and bearish forces.
No oversold or overbought conditions are evident, but bullish divergence could emerge as ETH approaches the wedge apex.
MACD (Moving Average Convergence Divergence):
The MACD line is close to crossing the signal line on the 4-hour chart, which would signal bullish momentum.
Histogram bars are narrowing, suggesting a breakout is imminent.
ADX (Average Directional Index):
ADX remains below 25, confirming the current low-volatility consolidation phase. A sharp move will follow as ETH exits the wedge pattern.
3. Volume and Market Sentiment:
Volume has been tapering off, a classic characteristic before a significant price movement.
Accumulation zones are visible around $3,200-$3,300, where buyers are stepping in.
Momentum volume is expected to surge upon a breakout, and this would confirm directional bias.
4. Trade Setup:
A. Entry Points:
Conservative Approach: Enter after a confirmed breakout above $3,450, ideally accompanied by a volume surge.
Aggressive Approach: Start scaling in near $3,300, with the wedge support acting as a cushion.
B. Stop Loss (SL):
Place a tight stop-loss below the $3,189 level to mitigate risks of false breakouts or downward continuation.
C. Take Profit (TP):
TP-1: $4,400 - A short-term target, aligning with historical resistance and high-volume zones (70-80% confidence).
TP-2: $4,800 - Medium-term target, capturing the measured move from the wedge breakout (50% probability).
TP-3: $5,800 - Long-term bullish target if momentum builds strongly.
5. Key Observations:
Breakout Timing: ETH is nearing the apex of the wedge, suggesting that a decisive move will occur soon, likely within the next 24-48 hours.
Bearish Scenario: Failure to break above $3,450 would see ETH retest lower supports at $3,200, with further downside risks to $3,000.
Bullish Scenario: A clean breakout with a strong volume spike could propel ETH toward the targets, especially as momentum aligns with technical patterns.
Actionable Plan:
Monitor Levels: $3,450 is the key resistance to break. Use this as the confirmation level for entering trades.
Volume Confirmation: Ensure breakout is supported by high volume, validating the directional bias.
Risk Management: Maintain a strict risk-to-reward ratio with SL at $3,189 and defined profit targets.
Conclusion:
Ethereum is at a pivotal point, with the descending wedge pattern signaling an imminent breakout. A bullish breakout appears more probable, but traders must exercise caution until confirmation. Patience and discipline in managing risk will be critical for capitalizing on this setup.
Advice:
Market sentiment can change anytime. Focus on proper risk management and
trade cautiously to protect your capital.

BnB is on the wayBnb usdt Daily analysis
Time frame 4hours
Target 900$
Close Target is upperside of the band
We hear a lot of news about major crypto companies collaborating, as well as corporate acquisitions and filling the coffers with valuable cryptocurrencies.
But there is no volume in the market.
We are not seeing the growth that we expect to hear after all this good news.😒
What is the reason?
The answer is one word.
👉Strategic patience. 👈
Wait, this is the beginning. The rockets are refueling for a long, long launch.🚀🚀🚀

Ethereum's 25% Drop = Massive Bullish Opportunity!🔥 Ethereum Bullish Opportunity 🚀
Why the Bullish Sentiment?
💎 Massive Correction: ETHUSD has dropped 25% in the past month, presenting an attractive entry point for long-term investors and traders.
📊 Fibonacci Levels in Play: Price is bouncing off key Fibonacci retracement levels, signaling a recovery:
Trade Plan :
🎯 Entry: 3,050
🎯Take Profit 1 ($3,300): Close to the 0.236 Fibonacci level, acting as the first resistance.
🎯Take Profit 2 ( $3,530): A target near the 0.50 Fibonacci retracement level, offering mid-range gains.
🏆Take Profit 3 ($3,740): A breakout move above the 0.618 Fibonacci level, marking a strong continuation.
🛡 Stop Loss: $2,800, placed below the Demand Zone to protect your position.
📈The ETH/BTC ratio is currently at 0.034, one of the lowest levels since April 2021.
The last time the ETH/BTC ratio hit a low of 0.032 in November last year, Ethereum’s price skyrocketed from this exact level to $4,000 in less than 3 weeks.
📈 Demand Zone Support: Price is holding above the $3,000 Demand Zone, a historically strong level for reversals and bullish momentum.
With a strong historical pattern and technical alignment, Ethereum could be poised for another explosive move! Don't miss out on this setup! 🚀
👉 Ready to take action? Let’s ride this wave together and see where it takes us! Drop your thoughts or questions in the comments below!
