#USDT no.25 overviewHello Everyone
Be aware that USDT is approaching to the key level. It can make a bullish pattern on this area and if so, it would make the right leg of the W formation! the neckline is around 3.66-3.83! After breaking the neckline we will have extremely bearish market!
This is my idea that can be true or not. personally, 75% of my balance is out for this Pessimistic situation to buy The dip!
Good luck
Etherium

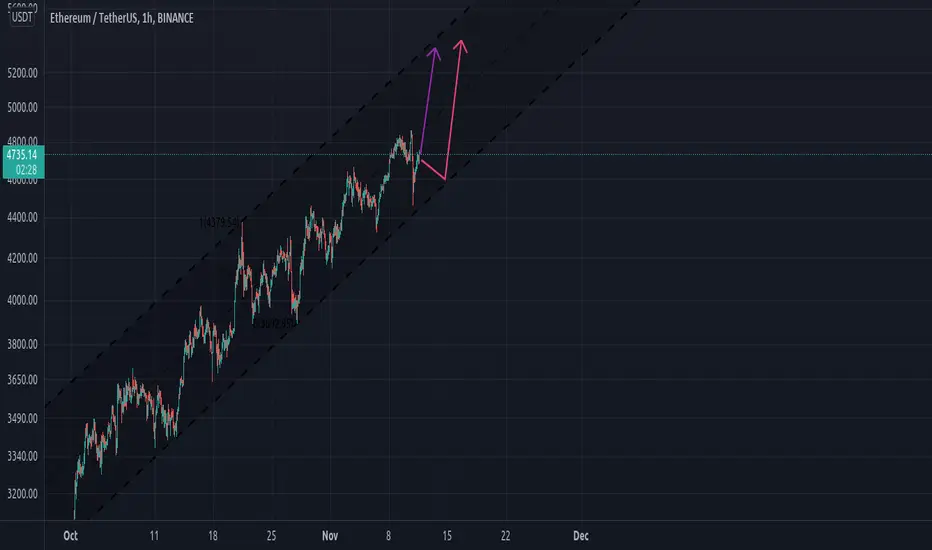
DeGRAM | ETHUSD false breakoutEther reacts to news and forms a strong fall to the price level of 4375 and begins to roll back, we can say that a false breakout has been made, if the price consolidates above the support, we can expect growth to resistance
-------------------
Share your opinion in the comments and support the idea with Like.
Thanks for your support!

Etherium - Wyckoff Disitrubtion Schematic #2 Shortterm buying power is diminishing on etherium as well as volume. I'm looking at a short term reversal with a first stop at $4.5k.
This correlates with a wyckoff distribution i noticed on the 10 or 15min timeframe.
Confirmation can be found in a bearish divergence on the RSI aswel as volume decreasing while volatility increases in later parts of the schematic (phase B and C).

Etherium 20% soon. Buy at $3700Hello all. Etherium went up 20% today, breaking the yellow resistance line and forming a broadening wedge pattern. The current eth price sits at $3650 which is the top of the resistance of the broadening wedge pattern (indicated by the purple lines).
This patten is a bearish chart pattern which makes me believe that ETH is due to a 20 % drop, the bottom of the channel. This level is approximately at $4000. However i believe that we can even see $3700, which will only make the move up even stronger.
For long entries i would start buying right at the range where the ascending support line sits around $3700-3800. I believe this level is strong enough to withstand the drop.
RSI on daily and also on the 4 hour chart is super over bough which is another reason we will have the drop. Don't buy yet, and set up your buy orders as i show in the chart.
Thanks for reading, and stay tuned. Enjoy.


etherium will blast in dec endthis analysis is based on technicals do analyse on your own before investing

ETH/USDTLooks like we are in ending diagonal , soon we might see some final correction in the bitcoin and in other crypto curriencies , let's see !

DeGRAM | ETHUSD long to resistance 4443Ether, after going down from the ascending channel, does not fall deeply, after a small rollback, a cumulative flat is formed with borders at the top at 4443.8 and at the bottom at 4147. I expect that the support price will fix above the level and the price will go up to the resistance at 4443
-------------------
Share your opinion in the comments and support the idea with Like.
Thanks for your support!

Etherium great buying opportunity at $3600Hello all. As I predicted earlier, Etherium is now heading towards the $3650-$3700 levels where I see the best entry positions for Etherium.
This levels sit exactly on the ascending support line and I have been calling this levels in my previous charts. Check them out in the link below.
Today's drop below $4100 level was a confirmation that we will see etherium revisiting the $3600-$3700 levels. Etherium went below the green rectangular box and the VPVR point of control zone, a very key support. Currently this key support changed its role and become a new area of short-term resistance.
$3600-$3700 level is also the bottom of the descending channel which is indicated in orange color. In the link below you will also see that this buy level corresponds with the fib gold level.
Don't miss this trade.
Thanks for reading, and stay tuned. Enjoy, and Happy Thanksgiving.
Find all of my previous Etherium analysis here: www.tradingview.com


#etherium head and shoulderetherium almost made a head and shoulder in one houre time frame as you know eth chart is a lagged version of btc chart so if btc falled and eth breaked neck line time to be away from market at least for a week

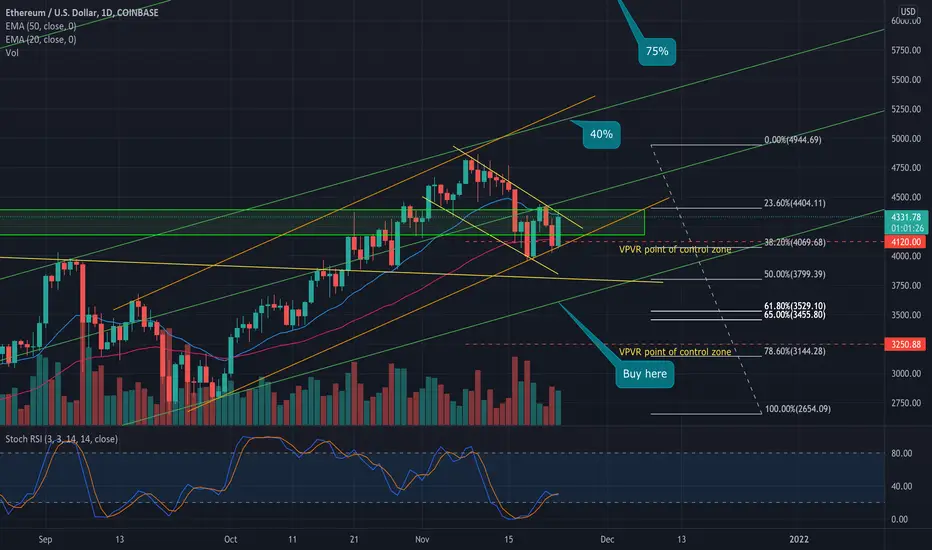
75% Etherium trade incoming, But Don't FOMO in just yet.Hello All. Looking at Etherium chart on the daily, we can see that the stochastic RSI remains in the over sold territory despite the fact that etherium is trading in the downwards channel. The $4400 plays a strong resistance but i think we will break it and go to 4600 range. However, the volume is not enough to go for ATH yet.
Here is the plan. We are still waiting to see ETH below 4000 and looking for buying opportunity around 3500 and 3600 rage. Here is why. The FIB golden pocket and the ascending line of support sit exactly at 3500-3600 levels. There is also tremendous amount of people waiting to buy eth when we go towards these levels.
Entry at 3500-3600 will get us 75% profit once we hit fib 161 level which sits around $6200 range. Another trade with the same entry and a sale at 5100 will get us a 40% profit.
Don't buy Eth yet. wait for the final correction. We will see 4600 most likely but then go back down and test 3600. We will see new ATH by the end of December.
Thanks for reading, stay tuned, and remain patient. Enjoy.
XRP: Bullish Against ADAI made this chart for those deciding between investing in ADA or XRP.
ADA has reached its full fib extension of the bear market against the XRP price.
We have a clear 5 wave count of which wave 4 bounces on wave 1.
The ABC correction has a clear smaller ABC within the B wave, that retraces to the .702 level of the A wave.
Overall, I believe this chart has topped out and have sold my ADA into XRP!

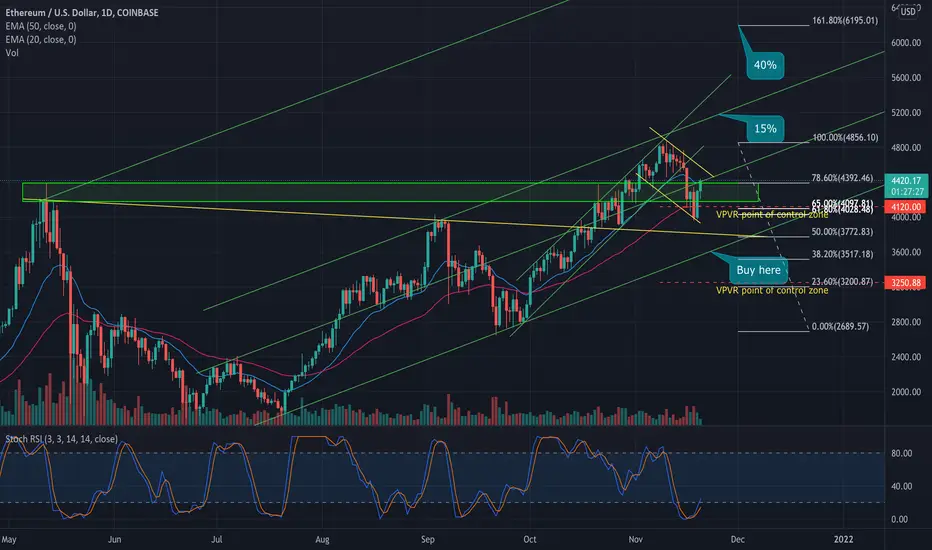
Etherium super bullish. $6200 incoming.Hello All. Etherium is showing strength as it bounced off of the fib gold level at around $4000 and at the bottom of the descending channel.
All percentages are measured from the time i am making this post
Etherium is currently braking the previous all time high zone once again. We are looking to turn this level as support on the 4 hour charts, short term, and close the daily candle about the $4400. despite the strong rebound, the stochastic RSI still remains in the over sold territory which is another strength indicator.
Short term, looking to hit $4570 level by tonight which is the top of the descending channel's line of resistance.
Long term, we are looking to go towards my 15% mark which sits at the top of the ascending channel's line of resistance.
Next target after that sits at %6200 which is the fib 161 level. This is the 40% target
Thanks for reading and stay tuned. Enjoy.
Crypto Alt Season Top IdeaAssuming that we are in Wave-5 of the larger Wave-5 of the bull cycle, it appears that an ending-diagonal Elliott-Wave is playing out.
Because Wave-3 is smaller than Wave-1, we can say that Wave-5 cannot exceed the length of Wave-3 at the 2.03T resistance, as Wave-3 may not be the smallest wave.
This aligns with the full 4.236 Fibonacci Extension target of the 2018 bear market,
I am expecting a nice rally for some coins that haven't moved yet, and then a major crash in the short to medium term.
(the 2 white lines are clones of Wave-3's length, logarithmic scale distorts the sizes)

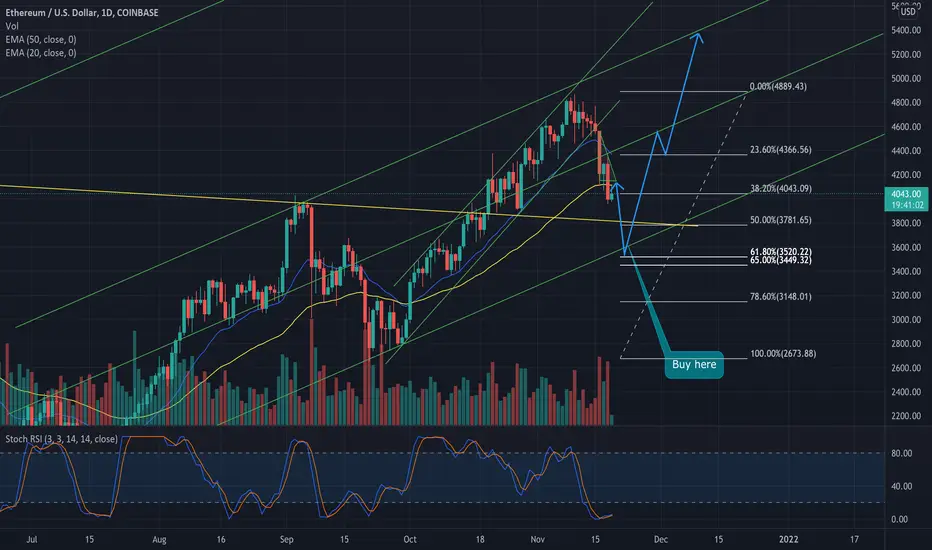
Etherium 50% trade before DecemberHello all. Etherium is taking a dip as predicted in my previous analysis. The buying levels still stay the same and look even more realistic as we are seeing this correction. Etherium looks very strong despite the drop as we remain in the RSI over sold territory, and as of today still above previous ATH.
The 50% trade plan is demonstrated on the chart above and is as follows:
Entry at fib gold levels at around $3500 at the ascending line of support after confirmation that the drop is over.
The short term target for this trade will be at $5400, the top of the ascending line of resistance.
Thanks for reading, and let me know what you want to see next in the comment below. Enjoy.
One last correction before $6000Hello all. Etherium broke bearish out of the symmetrical triangle and as we predicted in the previous post, today it hit the measured move at $4200. Nothing to panic. Instead, be ready for eth retesting the bottom of the rising channel as indicated in this post which will put as around $3600- $3300 range. The bottom of this channel also corresponds with the support level.
RSI remains in the oversold territory which again makes eth very bullish. treat this correction as your black Friday sale for etherium and load the bags. it will bounce either after retesting the daily 50 EMA or the bottom of this channel. The move up should put etherum to a new all time high, at approximately $6000 at 1.6 fib level. Thanks for reading. Enjoy.
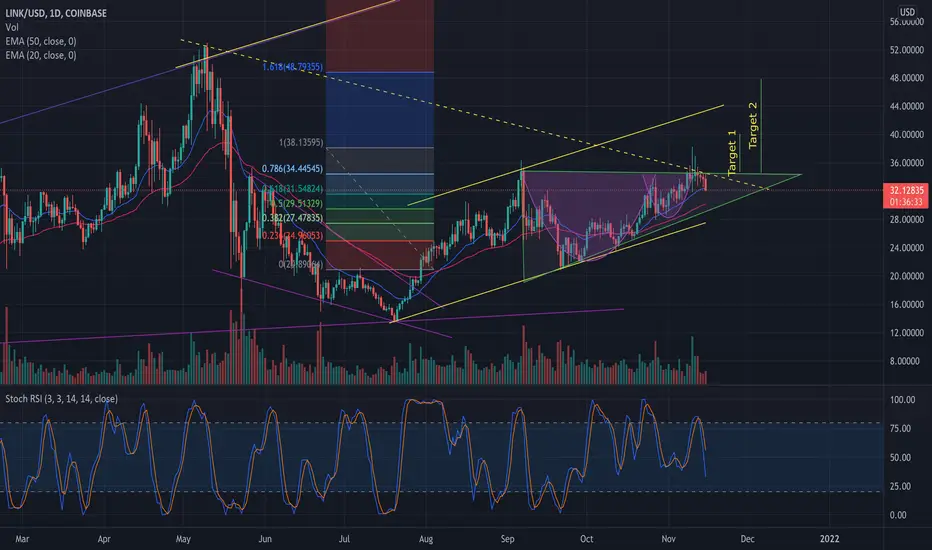
Chainlink ready for $48 according to these specific patterns.Hello all. looking at chainlink on a daily timeframe we have two patterns that are primed to play out in a very short time. first pattern is the ascending triangle which is a bullish pattern. The breakout for this pattern will put link at $48. Second, the cup and handle pattern gives us two possible breakout targets target 1 $40 and target two $48. both ascending triangle and cup and handle patters gives us a price target which also correlates with fib 1.6 level, again at $48. Overall Chainlink remains bullish as it trades in this yellow rising channel, above the 50 EMA, and gets very close to braking out one of these patterns as there is little room left for consolidation. Thanks for reading. Enjoy.
ETHUSDT - Enjoy 🚀🚀🚀 (1H Signal) Follow me, its good IDEA :)
Now ETH 1H time frame is inside of triangle and this moment are very good for a little time frame scalping. (1,5,15m)
for a long position we need hard confirmation for a trend.
Please share your opinion in the comments
This is not financial advice !!!

DeGRAM | ETHUSD pullback to 4385The price at its maximum values, locally the picture suggests the nearest correction. After a false breakout, the price does not continue to grow, it cannot update its local tops, each subsequent one is lower than the other. I'm waiting for the price rollback to support 4385
-------------------
Share your opinion in the comments and support the idea with Like.
Thanks for your support!

#etherium is so healthy dont panic sellas we saw in several houre bitcoin hade a fast dip and many altcoin hade a huge dip like dot
but we have to know that eth is too strong to have a free fall
we are in a strong channel toward the upside
we can put our sl under our channel
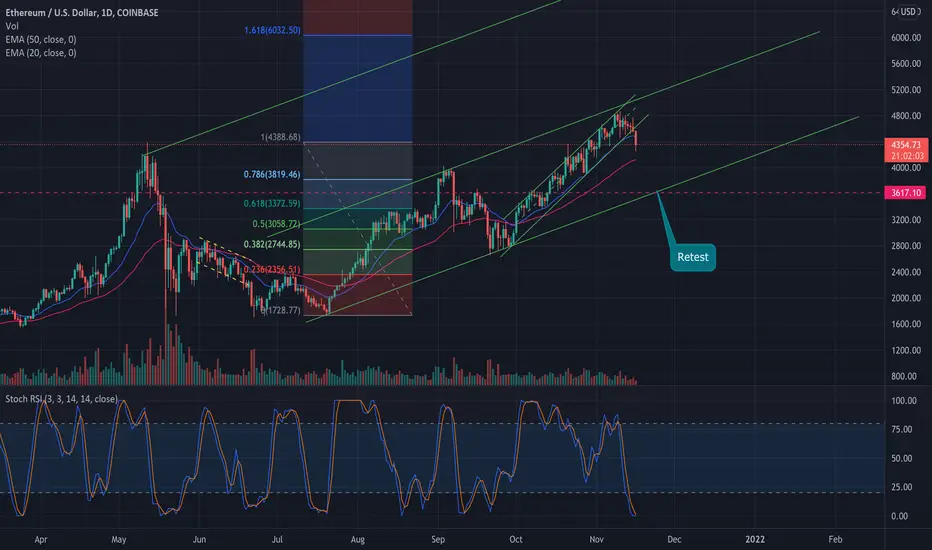
Could we possibly revisit $2800 Hello friends. Today we saw a small correction which put us back into the ascending triangle; while a week ago we broke out of this pattern and were on the go to $5750 which would also correspond with fib level 1.618. I believe this could be the final shakeout and we can go as low as $3600, and retest the up-trending channel. My realistic prediction for this week is that we can retest previous ATH at $4200, where 50 EMA can provide support, and bounce back up. The market is still very strong despite the noise, and the RSI remains below overbought line. Hope this help, and thanks for reading.

🟢 ETCUSDT over 200% is coming GET READY!! 🟢Etherium Classic is really at the dip and it makes it a really good opportunity for long-term investment.
What do you think about this analysis?
when do you think ETC will hit a new ATH? 🟢
