Precious Metals vs Top Cryptos Reaches Golden CrossThis custom chart of precious metals Gold and Silver versus cryptocurrencies Bitcoin and Etherium (each in their respective ratios) has reached a Golden Crossing (50DMA moving above 200DMA) for the first time in over 2 years.
I've been amazed at this dynamic custom chart and the patterns that come through here. I find that it's often easier to do technical analysis on charts where traders aren't already using TA to trade. Some say it's a self-fulfilling prophecy, but it seems clear to me that it TA works even better in places where other people aren't really using it (which would suggest the opposite is true). But I digress...
This golden cross is BULLISH
From the looks of it, PMs may command a higher increase in value for the next 2 to 4 years.
There is an easy way to trade between cryptos and gold/silver. I prefer the Kinesis platform. The PMs that they have on blockchain are actually allocated contracts in the name of the holder. What's more is you can take delivery if you so choose, or store it and gain yields. There's 5 different ways to make yields on your metals, but you'll have to watch the videos to learn about them. kms.kinesis.money
I'm not saying sell all your cryptos (none of this is financial advice btw). But it seems wise to have a plan like that in order. Or you can use the platform to set your buys and sells so you can sleep well at night knowing that when these markets move they will be working in your favor. Stay safe out there!
Etherium

Etherium (ethusdt) Should break trend? Etherium is now in the last support zone of the downtrend, if it manages to break out of the channel, we can expect an uptrend..
As long as it stays inside the channel, it will remain under selling pressure.
❤️👍🏻 Please support me with LIKE / COMMENT
DISCLAIMER: This post does not provide financial advice. It is for educational purposes only! You can use the information from the post to make your own trading plan for the market. But you must do your own research and use it as the priority. Trading is risky, and it is not suitable for everyone. Only you can be responsible for your trading.

#ETHUSDT 100% Accuracy so far, What's next?Welcome to this quick update, everyone.
As per my last chart, ETH dropped to our buy zone and we bought both on spot and leverage.
The average entry is around $2885.
The next resistance is around $3200.
A break and close above this level will trigger a rally towards $4000.
The pattern is playing out perfectly.
So this is my plan:- I'll be holding positions with SL around $2936 with a target of $3860 to $4000.
What's your plan?
Let me know in the comment section.
Also, If you like this chart, do hit the like button and share your views in the comment section.
Thank you
#PEACE

ETHUSD ForecastETHUSD on a bearish trend, three EMA has shown the golden cross between EMA 21, 34, and 200
Price target on the Fibonacci cluster (Ext 1.618 , Ext 2.618 , Expansion 100)
Second target is on the second cluster (Ext 2.618 , Ext 1.618 , Expansion 1.618)
BINANCE:ETHUSD
-Fibomic International-

TWO SENARIOS - UNDERSTAND THESE SCENARIOSSome $ Dollars $ Are Hiding Here
1) We have a Cup pattern which is a bullish signal.
2) But i have a really bad news : ( If Russia and Ukraine ' s Conflict remains continue we all gonna see a crash in Crypto market, Due to the conflict if market get bearish you will see a rejection at 42800$.

ETHUSDT (ETHERIUM) Technical Chart I am with you with a technical analysis that you will not find anywhere, I wanted to show you the support trendlines with Schiff Pitchfork in this analysis, as long as this channel is not broken, it is possible to make long-term or scalp trades from the support lines in the trend direction.
In order to draw a Schiff Pitchfork, we first determine the last trend and draw the Fibonacci Circle of this trend, then we place the Schiff Pitchfork on the Circle.
❤️👍🏻 Please support me with LIKE / COMMENT ❤️👍🏻
DISCLAIMER: This post does not provide financial advice. It is for educational purposes only! You can use the information from the post to make your own trading plan for the market. But you must do your own research and use it as the priority. Trading is risky, and it is not suitable for everyone. Only you can be responsible for your trading.

#ETHUSDT Pull back imminent? Buy levels given here.Welcome to this quick trade setup.
ETHUSDT looks good in the given range, $2768 to $3068.
Although we need to convert the $3400 level resistance into support.
It's better to be cautious at current levels and use the DCA strategy.
Inverse H&S Formation in play.
Breakout of the neckline will trigger a rally to the $4k level.
Let me know your thoughts in the comment section.
Do hit the like button if you like it.
Thank you
#PEACE

$ETH critical Area! BEWARE!!!!!!!!!!!$ETH has broken the monthly trendline, so it should make a HL that's the point you must caught the best LONG opportunity. For Now, it is making a CUP & Handle pattern but I usually don't like these kind of patterns because they mostly get failed so the situation I'm thinking about "if the brown line which is daily trendline if that breaks short with 3x-5x and stop loss above the top wick!
1st Scenario (only if you like patterns): CUP & Handle breakout retest - LONG
2nd Scenario (if you are using STEEL STEPS which I prefer the most): Daily trendline break - SHORT with 3x if you dont want to wait for LH. If you can wait for LH short with 5x - 10x

SHIBADOGE(SHIBDOGE):1h,TA,09.02.22As you see, the price may touch the resistance area $ 0.0002111 and following that , break the line resistance line and go down until the support zone $ 0.0001893.
Then, starting to grow up till 0.0002103.
please follow my analysis ...
⚠️ This Analysis will be updated ...
📅 09.Feb.22
⚠️(DYOR)

ETH in blue channelETH is in an uptrend and is now inside the Blue channel. If it cannot break the blue channel, it may have 2800 and 2600 targets. If it breaks the blue channel, this time its target may be 3350.
I'm using Fibonacci circle , Fibonacci levels , Fibonacci channel to create this analysis so Dont think that this is just figment
❤️👍🏻 Please support me with LIKE / COMMENT ❤️👍🏻
DISCLAIMER: This post does not provide financial advice. It is for educational purposes only! You can use the information from the post to make your own trading plan for the market. But you must do your own research and use it as the priority. Trading is risky, and it is not suitable for everyone. Only you can be responsible for your trading.

Binance Coin. BUY or Sell ?📊 BNBUSDT (Binance Coin)
💹 Time Frame: Daily (Update)
➖➖➖➖➖➖➖➖
🟡 BNB broke the $395 resistance and is trying to hold above MA50 and now testing the $430-$440 resistance area and the range of 61.8% correctional Fibonacci. If the resistance breaks. We will see a
good upward move in BNB if it breaks and holds above the $440 area. The next local resistance is the $460 area and the major resistance is the $500-$510 area. The support, for now, is $390-$395
area. This Analyzing is not a signal. It is your responsibility to buy and sell and be sure to include losses in your transactions.
➖➖➖➖➖➖➖➖
👤 AmirHossein
📅 02.08.2022
⚠️ (DYOR) BINANCE:BNBUSDT

ETH - High Probability For Being In A Bear MarketETH and BTC had a phenomenal run this cycle. From $81 to over $4800 which is more than 5800% gain. I talked more in detail of why i think btc is in a bear market so for that go look about my previous idea about ETH. I expect the rotation of the money into other alts not only from BTC but also from ETH. Because of that BTC and ETH will still go up with the rest of the market, but only doing an ABC retracement back to the .702 fib. retr. lvl. which sits around $4k.
Think of those two (BTC,ETH) as a bucket of water that has a hole in it so as water (money) is flowing in it also goes out at the same time even more so than it flows in.
I am not a financial advisor so non of this should be taken as a financial advise. Be well.
BINANCE:ETHUSDT

Etherium chart as bullish whales take control. Ethereum is trading in a confirmed uptrend with the most recent higher low printed on Thursday at the $2,572.66 mark and the most recent higher high created on Friday.Like Bitcoin, traders and investors may want to wait for the next higher low in the uptrend to take place before entering into or adding to a position.Ethereum has not yet broken up from its own descending trendline that has been pushing the crypto down since Dec. 1. Traders may want to wait to enter on a break of the trendline if it happens on higher-than-average volume.Ethereum has resistance above at $3,057.82 and $3,240.01 and support below at $2,890 and $2,609.02.

ETH SHORT IDEAHello Traders & Investors, here is my analysis for the etherium , let me know in the comment section below if you have any questions
Leave a like to support the idea and follow us for more free signals analysis
#ETHERIUM #cryptocurrencies #binary #bitcoiN #CRYPTO #investing #ETHUSD #crypto #cryptotrading

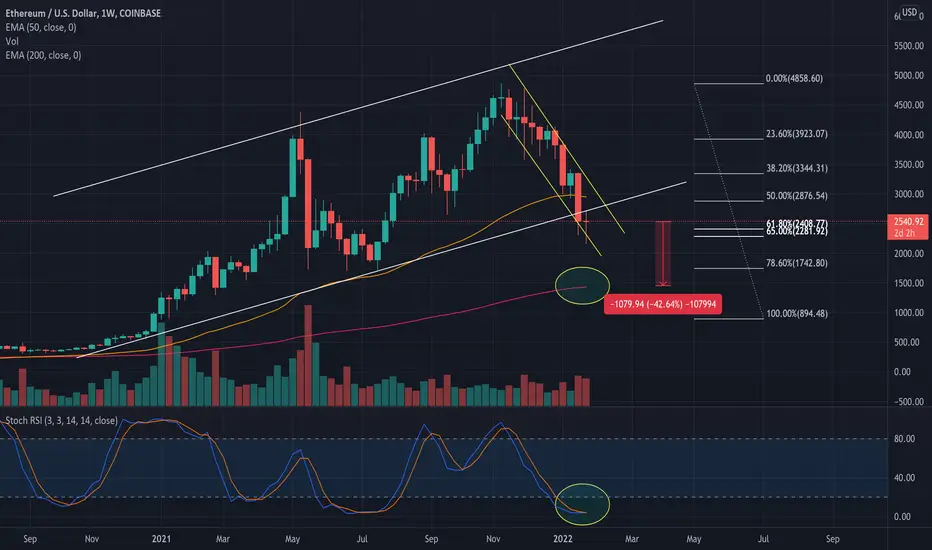
Etherium about to explode or $1700 incoming?Hello All. Looking at ETHUSD on the weekly timeframe, we see that Etherium is inside (the yellow) descending wedge/falling channel which is a bearish pattern.
Etherium is currently approaching the resistance line which sits at $2700. If etherium can break this level and get back inside the (white) ascending channel, it will be a bullish sign for etherium. It is vey possible that etherium price recovers, if we get more volume and since the weekly stocastic rsi is in the oversold territory.
However, If we fail to break this level, Etherium can go as low as $1700, which many traders anticipate. This will be a 42% drop.
The $1700 level corresponds with two key support indicators: the fib level 78.6% and the 200 week EMA.
Stay open to ups and downs, and read the charts without emotions.
Thanks for reading, and stay tuned. Enjoy.
Is Ethereum the next king?While there are differences in the chart of Ethereum and Bitcoin, In general, it can be said that it follows bitcoin.
Bitcoin dominance chart is in the support range and bitcoin loss is likely to be accompanied by more altcoin drop.
The traders were in such a hurry to sell Ethereum that they did not even wait until they reached the canal ceiling!
I will not trade on the pair.
According to my strategy level of certainty is low at this moment.

Etherium - Looking for a weekly close above $3315.Etherium - Looking for a weekly close above $3315.
We could be looking at $2400-2500 if we don't succeed.

ETHUSD UpdateThe outlook is unchanged since the last update. The trend is down yet wave B appears to be incomplete. We will not speculate at this point about possible shapes (frankly it can be anything). Once the shape is more definite we will update the outlook.

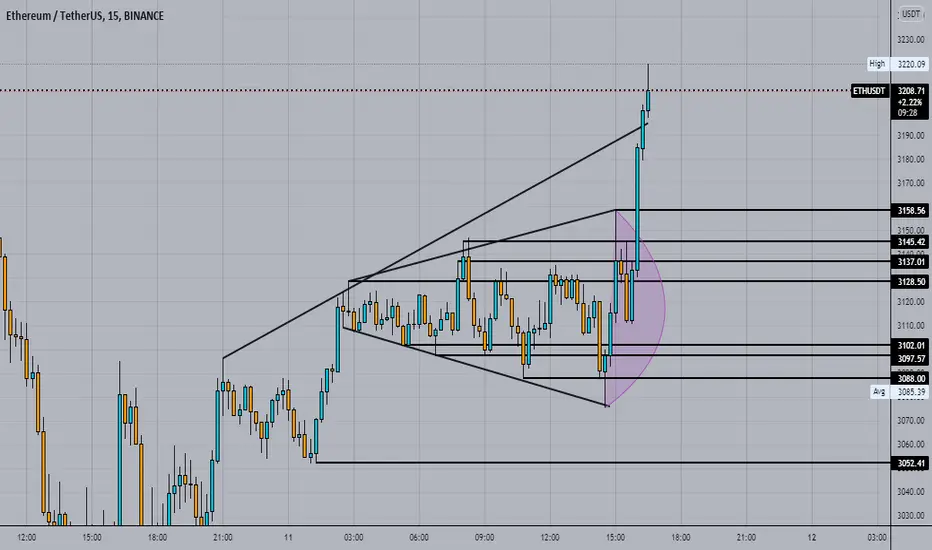
Megaphone pattern ethusdt 15m Chart bullish i Found a Megaphone pattern ETHUSDT 15m Chart
read detail about Megaphone Pattern
A megaphone pattern is a pattern that consists of a minimum of two higher highs and two lower lows. The pattern is generally formed when the market is highly volatile in nature and traders are not confident about the market direction. Normally this pattern is visible when the market is at its top or bottom. The greater the time frame is better the pattern will work.
Megaphone pattern is a pattern that consists of minimum ofo higher highs and two lower lows.
The pattern is generally formed when the market is highly volatile in nature and traders are not confident about the market direction.
Megaphone pattern is known to give multiple trading opportunities to the trader.
This pattern also can be traded when it fails but is necessary to identify the failure perfectly.
Sometimes only pattern is not enough to take best trading decisions you may need multiple indicators to identify better entry and exit points
ETHBTC AnalysisETHBTC chart shows that after a long downtrend, it was able to break its downtrend line in the second half of January 2020. It is currently moving in its long-term uptrend. ETHBTC has not been spared in the recent fall and has undergone a sharp correction, which has seen the price below 3,000 theter.
The ETHBTC is currently near its uptrend line. It is expected to move upwards by hitting this upward trend line. A return from the 0.071 price area, where both static and dynamic support is located, is likely.
Now, if this support is lost and the uptrend line is broken down, the price trend will be down. Upcoming supports include:
0.071
0,065
0,060
If moving upwards, the resistance ahead are:
0.079
0.083
0.088

Future Long On Etherium With $1000 BalanceI take Etherium for 1 week to implement weekly strategies by investing $31 on the entry price of $3100 and use 100 leverage, Qty is 1 Eth, If I get the profit of just $200 before or till week I will left the market with Smart profit.

ETHEUR Idea H1Here is my view for ETHEUR on H1. The price should go down, you can put a pending order on the Order block or find an entry on LTF within OB Zone. Trade Safe!

ETHEUR Price H4Here is my view for ETHEUR on H4. The price should go down, you can put a pending order on the Order block or find an entry on LTF within OB Zone. Trade Safe!
