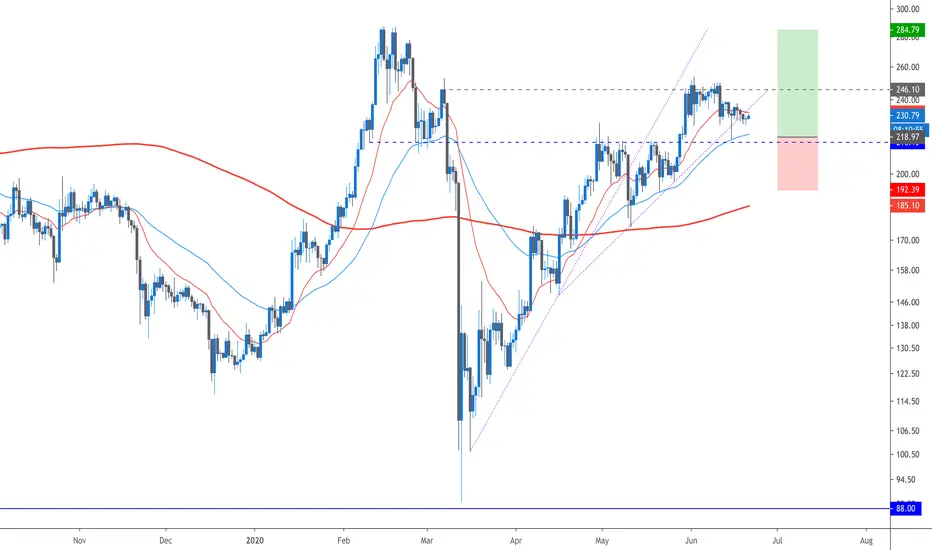
ETHUSD D1 LONG PRICE ACTION FORECAST So far, Ethereum is one of the leading cryptos that its price action is trading above the 50 EMA and 200MA, fro a definition of an uptrend bias from the book.
However, price is under some seller pressure where the correction can take the price to test back the 50EMA in confluence with the support level as a secure zone for demand where bulls are lining up, and this retest could bring the ETH to above de 280$ handle.
The order:
Type: buy-limit
S/L: 265 pips - R:R | 1:2.5 -
T/P: aiming towards the resistance from previous high
Ethforecast
8/05/2020 #ETH Ethereum forecast on the weekly chart!8/05/2020 #ETH Ethereum forecast on the weekly chart!

04/05/2020 #ETH Ethereum forecast for the coming period!04/05/2020 #ETH Ethereum forecast for the coming period!

Let's look at ETH!✴️ ETHUSDT Update #Altcoins
Let's take a quick look at the Ethereum!
ETH tested its symbolic and psychological level of 200 two days ago without managing to exceed it. Since then, ETHUSDT has been evolving between 190 and this level. The Ethereum is now trading above the 195 level which is an important weekly level and above its 4h value zone.
The technical situation is negative on the daily and 4h horizon, which does not exclude a retracement.
👉 What can be done?
We have two possibilities here guys, the first one, ETH continues its rise and breaks the 200 level, so we will be able to enter on pullback to target 210. This first possibility is risky given the state of the momentum, which is starting to be seriously overbought, so we'll use a 0.5% risk.
The second possibility is safer, we will wait until the bottom of the value zone 4 hours before opening the position.
Stay safe!

[ETH] - So far, not bad.I was about to publish my ETH idea the other day (red line) although I regretted it and decided to wait to see how the price development happened. Today three days later we can verify that the price, more or less, remains stable within the ascending channel drawn.
What to expect next? Buff, so weekend is ahead and we are also giving way to the last week of April, with a lot of relevant dates in the economic calendar, apart from the fact that not very optimistic data regarding transport or employment in global terms are also accumulating, which we will soon see its effects on the price of ETH and all crypto in general.
Perhaps another new correction for speculation and fear of what this new system brings us and the human need to continue treating fiat money with the zero importance that it has. If not another new wave of adoption will come soon, in a reasonable interval of time of 2 years, apparently there is still a way to go in the development of the system but it is already latent and at these prices we must take advantage.
This idea revolves around the ascending channel, a drawing that in this 4-hour view is not appreciated, although in a larger one it has a steeper inclination. Just an idea, thanks!

ETH (Y20.P2.E8).Macro.Inverted BARR structure approach
Hi All,
Just keeping it short as the charts tell you the methodology and story.
Note: This follows the same path as my BTC Macro chart, this is what I'm seeing play out with ether.
=====================================================================================
For the current short time frame level target (details)
=====================================================================================
My previous micro level chart
Please give me a tick or a like for my efforts, etc.
Regards,
S.Sari

08/04/2020 #ETH Ethereum forecast for the coming period!08/04/2020 #ETH Ethereum forecast for the coming period!


ETHUSD Hidden Bullish Divergence On 4Hrly ChartA hidden bullish divergence is forming on the 4hrly chart. If the price maintains bottom of 227-228 max and bounces then this will be in play.
Just an observation. Weekdays are still better trading days ever since the crap CME gaps have to get filled for no reason whatsoever. Possibly just to give the manipulators an excuse to dump and liquidate long margin trades or to keep price suppressed. Doing that without any valid reason for it to happen will make their price manipulation appear too obvious. Thats my view on this CME gap issue.
Good luck and only trade what you can afford to lose.

UPDATE: 01/03/2020 #ETH Ethereum forecast for the coming period!UPDATE: 01/03/2020 #ETH Ethereum forecast for the coming period!

UPDATE: 29/02/2020 #ETHDominance forecast for the coming period!UPDATE: 29/02/2020 #ETHDominance forecast for the coming period!

ETH (Y20.P2.E4).What Next?Hi All,
Continuing on with the previous ETH post but at the micro level.
Observations:
> Based on my established fib levels, in a channel, we are in an volatile area, just like back in July\August 2019.
Why, because we are near major resistance areas of 300 to 310 plus confluence with the 0.382 fib level. Hence push-back is expected.
> 300 is a physiological number and will be a strong resistance so expect the 1st attempt to fail
> Note how the macro trend line from May, 2018 to the 255 price range acted as a support level in this recent pullback.
> Note how I established the trend line resistance of 300 to 310.
> Regarding BTC, it also has similar circumstances under the major resistance of 10.5k however 300 for ETH is a major obstacle.
> RSI still in bullish formation
> As for my macro structure, refer to my previous post and my method of using fib levels in a assumed channel, just like fib. pitchfork tool
My thoughts:
While BTC consolidates at these areas, as per my chart below, ETH might just reach for the 300 range without major movement from BTC and hence why it will fail.
If it was in tangent with BTC breakout movement from this area for the 10500 resistance, ETH would also break the 300 resistance.
Hence I expect a drop to the 4 HRLY 21 EMA or the next major support level. Refer to the chart below.
*** Note: My point E on the chart is to be ignored. I am not saying it will pullback that low ***
This is just to demonstrate fluidity in the price movement.
Let me know if this chart makes sense by giving me like as a response please.
Regards,
S.Sari
(for my reference, Macro.charts)
BTC consolidation area mirrored
ETH pullback area after hitting 300
ETH Macro chart
Previous ETH post

ETH (Y20.P2.E3).Macro.FormationHi All,
While looking into where I should sell ETH by just looking at key support and resistance, mixed with Fibonacci levels, I saw some fluidity in the current price movement and more so in its rhythm.
Hence I added the sine wave and to my surprise, it has confluence with the peaks and troughs, as per chart. Hence why I am now thinking my initial target 1 is only half way or so.
Right now we are at a major resistance level and I would expect we will take a month or 2 to get past this level. This equates well with BTC and its 10500 resistance range.
If we are to assume that BTC target for this run is about 10800 to 11500, then its reasonable to assume ETH will have an larger % increase and that target 2 is reasonable as well.
Note:
> The pullback is based on target 2 and 0.618 retracement.
> The sine rhythm is also occurring with BTC at a micro level. I will hence now see if there is any at the macro level
Let me know if this chart makes sense and give me a like as a response please.
Regards,
S.Sari
(for my reference, Master.Macro)
WEEKLY chart, with 10, 20, 50, 100 EMA role in the price action
4 HRLY chart indicates key fib levels are respected.
12 HR chart

UPDATE:09/02/2020 "A big upward movement is coming for Ethereum"UPDATE:09/02/2020 "A big upward movement is coming soon for Ethereum"
The upward movement for Ethereum dominance will also be larger than I expected earlier .

ETH (Y20.P1.E17).Macro.Next TargetHi All,
In recent past, I made a post on ETH\BTC which has a potential of a massive breakout.
Hence I have my eyes on ETH.BTC as well as ETH.USD.
** (Similar to BTC, I believe that ETH is completing its 2nd stage of a 4 stage cycle. Refer to my previous posts about my hypothesis)
For now I have the following:
> ETH on the daily is in an uptrend
> ETH on the lower time frames is in a downtrend.
> The 20 and 50 EMA on the lower time frames are my focus. More likely a bounce of the 50 EMA on the daily.
> On the daily, I have macd pointing down in convergence with price movement
> On the 4 HRLY, I have the macd reversing upwards, however we are still in a downward trend on the lower time frames. We nee to see a higher high before we can make the next call.
> However as stated, on the daily, we are still in an uptrend and hence I have ETH half way of an AB=CD move where point C is likely hit at the daily 20 EMA otherwise it would be the 50 EMA on the Daily.
Both acceptable as part of the CRADLE zone.
** Note: BTC completed a AB=CD when it hit the 9100 price.
Very much like BTC, I believe we are in an accumulation period for ETH. With BTC this price ranges from potentially starting at 7800. But for now, I have 8000 to 8200 price range.
Similarly, ETH at this point is 155 to 170, as accumulation
BTC has the potential to pull back to 8000 to 8100 range which is still acceptable as part of an uptrend on the daily.
Please don't forget to give me a tick\like, as I would appreciate it.
Regards,
S.Sari /CryptoProspa
(for my reference > Master.copy chart)
ETH more of a macro view, with the top trend line being the resistance for this stage of the ETH cycle.
BTC close up view
What do I have at the MACRO level?
Refer to my next post coming.

ETH (Y20.P1.E1.v2).MACRO.Trend.ForecastHi All,
This post is a continuation from my previous post (hypothesis).
Thoughts and ideas:
> At this point, we don't have enough data to project way forward like BTC because we lack of a long history regarding ETH.
> Working with what we have, we can speculate (it is the business to speculate) will a number of assumption based on BTC life cycle.
> Green box represents current situation but the target is the upper trend line (230 to 250)
> Note how I made use of the FIB. Gann fan and Ascending triangle rules.
Assumption notes:
> ALTs have hit their target for this cycle (refer to my post on Crypto TotalMarket Cap excluding BTC, link ideas area);
> BTC has 4 cycles which I have explained in a previous post video. I believe we are in the early phase of stage 2 of 4 parabolic rises, where stage 3 is the major parabolic bubble event and stage 4 is the huge bear market;
Similarly I believe ETH will follow something similar, that is we just finishing the bear market phase of the ALTs including ETH. We are only getting uptrend but not a trend change.
Look at the fib. and you will see we bearly hit the 0.286 level.
(I will provide the link here for the video of the BTC life cycle at the bottom of this post)
> Upper macro trend line is established
> This phase is the bottom, just like BTC in 2018
Daily chart
I have 2 targets, a) 230 to 250 and the other is 270
Previous ETH post related to this:
Link to video regarding BTC life cycle
Note: You might have to increase your speaker volume as it seems I had some technical issues with the sound.
Please don't forget to give me a tick\like, as I would appreciate it.
Regards,
S.Sari /CryptoProspa

ETH dead cat bounceEthereum dumped by almost 10% and bounced. IF you take a look at week timeframe, you will see that ETH never ended its downtrend. Just keep on falling and falling and falling. The only bullish moment it has, is that now price is near historical all time low with falling volume, which could be a sign for potential reversal, but certainly not a confirmation of it. And without confirmation better stay away from that coin.
If price will fall below 171 once again, ETH is dead. IF bounce above 173, there is a chance it will bounce to 179. Just monitoring it.

ETH Short down to $85-90! ETHUSD has finally shown a continued move potential in market structure to the downside. We were waiting for the double bottom to break through and price to pullback into the broken low. Price has a pullback and begun to rotate at the new resistance which can bring the price down to the ultimate support at $85-90. The downside break was on good volume, the volume to the upside swing was rather weak. The ultimate target to the downside is $87.00.
Disclaimer: This trade idea is for educational purposes exclusively, this does not constitute investment or trading advice. TRADEPRO Academy is not responsible for any market activity.

191106 ETHUSD analysis. "Shape looks right to rise, but..."Hello, my friends. It's Cryptoranger K.
I've been quite scared of posting an Ethereum analysis recently. The current indicators and trends suggest that ETH should rise here. However, looking at the 2 day line on the 1-week chart, it seemed that it had just fallen. Obviously, the price flow moves along the 50-day line and shapes the cup, but I can't figure out how to handle the 20-day line. First of all, I expect three things.
1) ETH rises from here to $ 272 ~ 286.
2) First, the price of ETH rises from here to $ 208. Then the price drops to $ 173 ~ 184 and then rises.
3) ETH prices first rise from here to $ 208. And then going up after the price drops to $ 135.
The reason I expect this is because of the flow of MACD. In the past, MACD's Golden Cross always preceded the full-fledged rise. Still, given that the 1-week MACD Golden Cross has not come out, I am not convinced that ETH will rise here.
Another question is, "It's too easy for ETH to rise this way." The markets I've experienced so far haven't made it easy for participants to make money. So I'm more suspicious of this plausible flow.
Am I thinking too deeply? Yes. It may be. But I'm not sure about the flow, so I'll have to watch a bit more if I can't make a profit this time.
If the price of cryptocurrency goes to the moon from this place, I will no longer pay attention to the coin market.
As I watch the flow over the next few weeks, I will consider buying a MACD to create a Golden Cross and a 5 & 10day line to form a regular array and a cross to a 20day line.
This is too difficult for me to analyze.
I thought I should be quiet because this thought would hinder the trading of everyone who reads this article. But I think it's better to post in terms of perspective sharing.
I would appreciate it if you could accept my writing as one of the various points of view.
We hope you all continue trading successfully.
Thank you.

ETH and BTC are perfectly direct correlatedAnalysis of Ethereum should always take into account current Bitcoin price action. If we look at the 1 day timeframe scale charts of ETH and BTC we would see that there are similar fractal repeats. Taking a closer look at the short-term timeframe scale reveals a direct and perfect correlation of the assets. We can see 7 similar price action formations which took place exactly at the same time. Deeper analysis shows that ETH replicates BTC movements with up to 5 minutes lag. This is a very long period to take action.
Taking into account the recent BTC analysis we see price action of this asset reached its top and currently should go down making a channel breakout rejection and another fractal repeat. Thus ETH will replicate this movement and it will be favorable to open short position. Target in such scenario will be a bottom of the channel around $168
Although there is still a chance that the breakout will be confirmed, it will happen once a 4 hour candle closes green above $8 118 level. In this case there are 2 long position targets for ETH
1: $178
2: $183
Carefully track the progress of the price action to take a decision. It is a good moment to earn profit with ETH


191021 ETHUSD analysis. Fall in the medium term.Hello, my friends. It's Cryptoranger K.
Today was a day when I didn't see anything special on the chart. I looked in for a while, gave up and just rested. And I look at the chart again at night. I thought about why. And I concluded that it was because I had a lot of expectation that 'I want the bottom to come out quickly'.
Looking at the ETH 4 hour chart today, I found that the current price flow is drawing a falling wedge. And the four-hour candle seems to be rising. And again I saw the daily chart.

191015 ETHUSD analysis. it's good to watch the stochastic flow.Hello. It's Cryptoranger K.
The ETH flow so far is moving within the framework of the falling flag and the falling wedge. Personally, I think this is where the ETH price rises. It's exactly weighting up and down about 8:2. But if you look at the chart, it is unlikely that the price will rise right at this point. The reason is because of BTC.
