ETH (5 year of accumulation!)ETH / USDT
📌 Background: i shared an analysis about ETH/BTC chart and i predicted the ultimate bottom, from which ETH/BTC pumped 52% and ETH/USDT pumped 97% in few days !
you can check previous analysis: click here
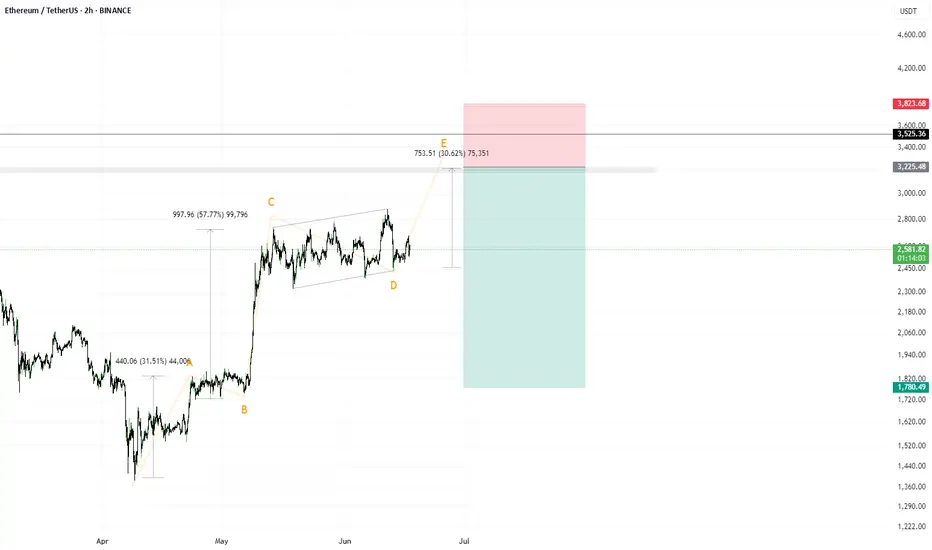
📌 Today we have different chart against stable coin … Ethereum is being accumulated since 5 years in mega accumulation range with 2 major stop-loss hunt (long and short)
📌 What IF ?
What if ETH made a breakout throughout this accumulation ? i think we can see scenario like that in the green candles in my chart
DO YOU AGREE ?
Ethidea

Ethereum's Road to $7500 – Strategic Entries & Profit Optimizati🔵 Entry Zone: My first position is placed at $2225.5, aligning with a strong support level, while a secondary entry at $1857.5 serves as an additional safeguard against unexpected market swings—lowering my average purchase price and protecting capital.
💰 Profit-Taking Strategy: For low-risk traders, securing a 40% profit from the first entry is a prudent move to lock in gains early. However, my long-term target remains ambitious.
🚀 Main Target: Based on valuation models and fundamental news, Ethereum’s upside potential points toward $7500. However, I personally plan to secure 90% of my holdings at $6000, ensuring strong profit realization while leaving room for further upside.
This setup balances risk management, smart positioning, and strategic profit optimization. Let’s see how ETH’s trajectory unfolds!
Entry1: 2225.5
Entry 2: 1857.5
If your second entry is successful, you are required to withdraw 50 to 70 percent of your capital to maintain your capital. I will definitely update this setup.

Short idea on $ETHJudging by the structure, if the vector is correctly identified, then on the ETH instrument, a rise to 3400–3600 remains relevant until the first serious correction (this idea would be invalidated in that case).
As for the potential trade — a breakout of the local highs amid global chaos and during the formation of wave 4 of a 5-wave structure. Typically, during the formation of wave 4, there is more media involvement, more noise, and panic.
I’m observing and planning to enter this trade.
Do not follow my vision blindly, as it could be detrimental to you.
ETH Price Action Explained – What the Charts Are Really Saying?🔍 Taking a look at Ethereum ETH right now across multiple timeframes…
On the lower timeframes ⏱️, we’re seeing a bullish break 💥 that might spark some enthusiasm 🚀, but when you zoom out and get that macro perspective 🌐, my outlook shifts from to one of caution ⚠️.
📊 ETH is currently trading into a key resistance level 🧱, and if we step back and view the bigger picture, we can clearly see that it’s been range-bound 🔁 for quite some time.
On the lower timeframes, there might be an opportunity to squeeze a bit out of the range 🎯 by trading between the highs and lows—but keep in mind, this approach is not for the feint hearted ⚡.
📹 This video is purely analysis 🧠, not a trade idea. I’m sharing my thoughts and market view 📈, and I hope you find it helpful and insightful 💡.
🚫 Not financial advice.

Ethereum is Bearish: Watch this Resistance LevelFenzoFx—Ethereum is trading sideways, stabilizing above the 50-period SMA but has yet to form higher-highs. While the price remains above $1,755, the primary trend is considered bearish. A drop below this resistance could push the price toward $1,370 support.
On the other hand, if bulls manage to close above $1,755, a bullish wave could emerge, setting $1,950 as the next target.
>>> No Deposit Bonus
>>> %100 Deposit Bonus
>>> Forex Analysis Contest
All at F enzo F x Decentralized Forex Broker


Ethereum’s Accumulation Phase Ends – What’s Next?Ethereum has successfully broken above the accumulation zone, indicating a potential bullish continuation. The price is now approaching a critical descending trendline resistance (blue line), where a breakout could trigger further upside momentum.
Key Observations:
Breakout from Accumulation: The price has cleared a consolidation phase, suggesting renewed buying interest.
Next Resistance (Green Box): The immediate hurdle is the descending trendline resistance within the green box. A breakout and successful retest of this level could push the price toward the next major resistance.

ETH Retesting Breakdown – More Pain Ahead?ETH/USDT has been trading within a broad range of approximately $2,000, consolidating after a long uptrend.
However, the price has broken down below the ascending trendline and is now retesting this breakdown, just above a key support zone.
This retest is crucial in determining whether ETH will confirm further downside or reclaim the trendline.

Scenario on ETHUSD 12.2.2025With Eth, I have a scenario such that if I should take a long position, then the first at the first sfp on the chart, which is placed in the price session around 2445, if the market breaks through this level, then the next level at which one could consider going long is somewhere around 1980, if I should consider a short, then the first acceptable price level for entry is 3500, if the market breaks through, then somewhere around 3900-4000

Strength continues to gain momentum before the start of a big mo📈 Strength continues to gain momentum before the start of a big move!
We are witnessing extremely interesting dynamics in the cryptocurrency market, which indicates the formation of a potentially strong trend. 🔍 The previous resistance level was broken through ⚡️ and overlapped, which indicates the dominance of buyers 🟩 over sellers 🟥 in the current phase of the market.
Key analysis of the buyer's zone
The chart clearly shows the formation of a new buyer's zone 🟦 in the range of 3296.18-3341.61. This zone is an important place of energy accumulation 💡, where buyers keep control, preparing for further developments.
The interaction of the price with this zone harmoniously confirms the concept of energy flow ♾️. Each time you return to the zone, the energy amplitude increases, which ensures a stable upward movement 📈.
🌌 Harmonious energy flow and its projection
From the point of view of the concept of harmonious energy flow 🌊, the current situation indicates the completion of the “rollback” phase to support and the transition to an expansion impulse.
✨ Key points:
The zone 3296.18-3341.61 functions as an “energy base” 🛡️, from which a new major movement will potentially begin.
The price projection indicates a possible exit to the 3500-3600 zone, which is confirmed by the current volume analysis 📊.
The market is in the harmonization phase ⚖️, where sellers are gradually losing strength, and buyers continue to accumulate energy 🌟.
🔮 Why is it important?
✅ The breakout of resistance is a signal of the end of the local “energy skew” 💥 that held back the market earlier.
Buyer's zone is a key level that demonstrates the desire of market participants to defend their positions 🛡️.
✅ Price projection - a harmonious flow of energy indicates a possible further increase to the levels already built into the market structure 🌀.
🔍 What's next?
The market is ready to move to the next level of movement . Returning to the buyer's zone can be a great time to open positions to continue the trend 🟢. However, it is important to keep in mind the risks 📉 and work according to your trading system.
📌 The current dynamics confirms the strength of buyers and readiness for a new impulse 💥. Keep an eye on developments, as the market always rewards those who understand its energy and harmony. ♾️
Link to the chart for a detailed analysis: TradingView 📊
✨ Subscribe to the channel so as not to miss further important updates and insights!

Harmonious energy flow on ETH/USDT: preparing for a new impulse🔮 Harmonious energy flow on ETH/USDT: preparing for a new impulse 🔮
Today, we are witnessing an important moment on the chart! The price of ETH/USDT has passed the 96% mark of the previous downward movement, which means the exhaustion of the sellers' potential. The harmonious concept of energy flow suggests that a new radial-axial dynamics (RAD) is forming at this stage. This is the point of equilibrium where energy flows from one side to the other, creating the potential for a new trend.
📍 Key levels:
Local support: 3223 is an important benchmark for holding the price.
Local resistance: 3355 is a key zone where the market will determine its further strength.
📊 What do you need to move up? A harmonious flow of energy requires confirmation in the form:
A manifestation of strength in the accumulation phase. This can be seen in the increase in buyer volumes near support.
Confident consolidation of the price above 3355. Only a breakout of this level and its transformation into support will open the way to new heights.
✨ The essence of a harmonious transition: The current forming ROD is the basis for the upward momentum to continue. The current phase of the market indicates the accumulation of energy, which is the basis for further upward movement. The market is now at a critical point where the balance of power is gradually tilting towards buyers.
👀 What to expect next? A signal for active action will be:
Confirmation of the support zone 3223.
Active breakout of 3355 with strong volumes.
Recommendation: Follow the developments in this zone. The next stage, after confirmation of the harmonic impulse, can lead to new heights, especially if buyers take the initiative in the accumulation phase.
🌊 The harmony of energy always guides us! A little more patience and the market will show us where to go next. 🚀

ETH 2 triggers for Major alt seasonETH / USDT
Ether is the king of Altcoins … usually when ETH starts to move,majority of Altcoins follow it
Looking at chart we can see 2 triggers for a possible major alt-season :
Trigger1: Breakout and stability above 4k
(This resistance is very tough we can see it rejected the price many times before )
Trigger2: Drop to support below and start to breakout
By the way the lower support must hold at any conditions
Best of wishes

ETHUSD: Breakout to 6K or Drop to 2K? Key Levels to Watch!ETHUSD
Alright Mindbloome Fam, here’s the deal with Ethereum—keeping it super simple:
If we break 4100, I think we’re heading to 5K–6K. That’s where things could really get exciting.
But if we dip to 3K, we might see a pullback all the way to 2100. And if it goes lower? We’ll figure it out when we get there.
No need to overcomplicate it—just watch these levels and be ready. If you want to talk more about this or need some tips, check out my profile or DM me. Happy to help!
So, what’s your gut saying—do we pump or dump from here? Let me know!
Kris/ Mindbloome Exchange
Trade What You See

Ethereum (ETH/USD) Entering a Bullish Phase: Key LevelsEthereum is currently showing signs of strength as it enters a positive, bullish phase. Following a period of consolidation and recovery, ETH is gradually climbing towards a significant resistance level at $4,394, a price last seen in May 2021. This level remains a key psychological and technical barrier for ETH, and breaking it could determine the next major price movement.
Market Context: Bitcoin’s Role
The broader market outlook is also highly favorable, with Bitcoin (BTC) expected to maintain levels above $100,000 throughout December. This stability in BTC could provide the necessary momentum for Ethereum to approach its $4,394 resistance.
Potential Scenarios for ETH/USD:
1. Scenario 1: Pullback Before the Breakout
In the most likely scenario, ETH may approach $4,394 but face resistance, leading to a pullback towards the $3,300 range. This retracement would allow for consolidation before another attempt to break the key level. This scenario aligns with typical market behavior, where assets retest major resistance multiple times before a breakout.
2. Scenario 2: Breakout and New All-Time Highs
Should ETH successfully break through the $4,394 barrier, the bullish momentum could accelerate. This breakout would open the door for a sustained rally, potentially pushing ETH towards new all-time highs in the $6,000 to $6,500 range between May and July 2026. Such a move would signal a significant shift in market dynamics, fueled by broader crypto adoption and improved market sentiment.
---
Technical Indicators and Key Levels:
- Support Levels:$3,300, $3,800
- Resistance Levels:$4,394, $4,800
- Target Range Post-Breakout:$6,000 – $6,500
In summary, while ETH is currently showing bullish signs, the $4,394 resistance level will be a decisive battleground. Whether ETH pulls back or breaks through, its long-term prospects look promising, especially if BTC remains strong. A successful breakout could set the stage for Ethereum’s next major rally, potentially reaching new highs by mid-2026.

AI Pattern Recognition Bot: Triangles, Cup and HandleH ello,
This is what my AI pattern recognition bot came up with:
AI recognized the following chart patterns: Triangle (White and Blue), Cup and Handle (Green)
Computing Resistances: Local Top - $3700 (Red), Triangle Tops - $3900-$4000
Potential Trade: Long until the psychological resistance at $6000
Target Price (Cyan): $6000
Stop Loss: Triangle Breakdown - $2000
AI recognized two different triangles on the chart: the white symmetrical triangle and the blue triangle. These triangles define the white and blue support and resistance levels. Furthermore, there is the red resistance level from local tops. If Ethereum can break resistances, it might visit the psychological target and resistance at $6000. If Ethereum falls to $2000, the triangles might break down, which would have a bearish indication. Historically, similar triangles usually break upwards with a 63.5% chance. Cup and Handle pattern often breaks up with a 70.5% chance. In general, I expect Ethereum to break the chart patterns upward and initiate momentum into the cyan target price.
Regards,
Ely

ETH (Crypto ETHEREUM) SELL TF H4 TP = 2286.86On the H4 chart the trend started on Sept. 27. (linear regression channel).
There is a high probability of profit taking. Possible take profit level is 2286.86
This level, which I have outlined above, is certainly not a “finish” level. But it is the level that has the “highest percentage of hits on target.”
Using a trailing stop is also a good idea!
Please leave your feedback, your opinion. I am very interested in it. Thank you!
Good luck!
Regards, WeBelievelnTrading

"Ethereum Price Set to Skyrocket – Expert Predictions Here’s my expert take on Ethereum’s price outlook: By the end of 2024, ETH could hit $5,064.63. In 2025, expect it to range between $5,044.68 and $6,078.17, with an average of $5,973.21. Looking ahead to 2030, ETH could skyrocket, ranging from $15,825.07 to $17,361.45, averaging $16,502.73.
Ethereum’s powerful blockchain is built for scalability, security, and decentralization, making it a key player in blockchain and DeFi innovation. What are your thoughts? Will ETH hit these numbers? Drop your comments below!

Waiting for level confirmation Followed by correction Waiting for level confirmation Followed by correction
At the moment, the ETH/USD trading situation is characterized by volatility, which is often seen in the cryptocurrency market. Ether (ETH) is at levels that can be both support and resistance, depending on current news and analytics. Investors are keeping a close eye on regulatory changes as well as the development of decentralized finance (DeFi) and NFTs, which could influence demand for Ether. Technical analysis shows some support and resistance levels where consolidation may occur. Market sentiment varies and traders are likely to continue to look for short and long term profit opportunities. It is important to keep in mind that changes in the global economy may also have an impact on the cryptocurrency market.

ETH target $2240 (sjort-term)4h time frame
-
Entry: $2800
TP: $2240
SL: $2950
RR: 3.7
-
(1) Still on the path of Elliott 2nd wave
(2) Need more momentum accumulation before 3nd wave starts
(3) Potential Head and Shoulders on 4h
(4) There is a buying opportunity at $2200~$2100
(4) Be careful and make sure to stop loss, the crazy pump is coming

ETH (Crypto ETHEREUM-USD) BUY TF H4 TP = 3347On the H4 chart the trend started on Aug. 08 (linear regression channel).
There is a high probability of profit taking. Possible take profit level is 3347
Using a trailing stop is also a good idea!
Please leave your feedback, your opinion. I am very interested in it. Thank you!
Good luck!
Regards, WeBelievelnTrading

ETH can rocket from this level Well, strap in, because we're about to blast off into the stratosphere of cryptocurrency analysis! 🚀
According to the latest data, Ethereum (ETH) is currently trading around $2,672.89, with a projected increase of 5% in the next 30 days. That's a pretty solid boost, but is it enough to send ETH into orbit?
Well, let's take a look at the long-term predictions. By 2025, some experts are forecasting a potential high of $6,563, while others are even more bullish, predicting a whopping $10,200 by 2030. That's a lot of zeros, my friend!
But before we start counting our digital chickens, let's not forget that the crypto market is about as predictable as a cat on a caffeine high. There are a lot of factors at play here, including the upcoming Bitcoin halving, the approval of Ethereum ETFs, and the overall state of the global economy.
So, can ETH rocket from this level? The short answer is: maybe. The long answer is: it depends on a bunch of different variables, and even the experts can't agree on a definitive answer.
In the meantime, why not sit back, relax, and enjoy the ride? After all, isn't the journey to the moon (or at least the top of the crypto charts) half the fun?

#Ethereum updated; completed 22% of the 32% decline.CRYPTOCAP:ETH 1W updated;
Only 22% of our 32% decline target has been achieved. ✅
Another 15% drop is needed for the beginning of the bullish harmonic structure. ⏳
The $2900 level is the balance level. This will be possible as long as there are closures below it.
#eth #ethereum

ETH target 38004h time frame
-
TP: $3880
SL: $3000
RR: 8.78
-
(1) Potential double bottom is creating
(2) Left leg of double bottom mentioned above performed good support at 0.382 Fib projection
(3) This is an opportunity to add position for traders who followed previous trading plan
(4) $3880 is good to close "partial", not all, there is a higher target
-
Previous analysis
