Harmonious energy flow: buyer dominance and zone magic 🔥 Harmonious energy flow: buyer dominance and zone magic 🔥
Friends, we have witnessed an amazing play of energies in the ETH/USDT market! 🎯 The chart clearly shows how the price tested the buyer's zone twice in the range of 3180-3225. This key level has become a real “place of power” 🌀, where the energy of buyers not only held the position, but also led to a strong impulse movement upwards 🚀.
🌟 What happened?
A repeat test of the buyer's zone took place during the release of important macroeconomic indicators 📰. But the most interesting thing is that the market, like a true seer, had already priced this release long before it was published. This confidence of market participants only strengthened the protection of the zone, where volumes increased and energy gained the capacity to break through 💪.
🔑 Why is it important?
The buyer's zone works as an “anchor”, holding prices in times of uncertainty.
Interaction with this zone clearly showed the willingness of buyers to dominate sellers.
The macroeconomic data only reinforced the existing market scenario, and the harmonious flow of energy was realized in the form of a steady upward movement.
This is another vivid example of how the concept of harmonious energy flow allows you to see the hidden dynamics of the market and feel its rhythm. 🌊 Energy continues to pulse, and we are discovering its secrets together. 🔮
Stay with us and follow the developments! ✨
Ethlong

ETH/USDT - Chart Analysis. Descending Triangle Formation: ETH is consolidating within the descending triangle pattern. The downward-sloping trendline represents resistance, while the flat support at the base provides a crucial level to watch.
Current Price: Trading at $3,368.63, ETH is near the lower boundary of the triangle.
$3,400 – $3,450: Immediate resistance area. A breakout above the descending trendline would indicate bullish momentum.
$3,800 – $4,000: A breakout confirmation target range.
$3,200 – $3,250: Crucial support area. A breakdown below this level could invalidate bullish scenarios and lead to further declines.
21 EMA (black): $3,387 – Providing short-term resistance.
50 EMA (red): $3,562 – Acting as dynamic resistance, a breakout above this would signal renewed bullish momentum.
ETH moving above $3,450 (descending trendline) could lead to a rally towards $4,000 – $4,400 with significant volume.
The green arrow shows this potential uptrend.
Let me know if you’d like further assistance or adjustments!
DYOR. NFA

ETH/USDT 4H Analysis: Bullish Momentum Targets $3,700 ResistanceETH/USDT 4H Chart Analysis
Breakout confirmed: ETH has broken above the key resistance at $3,200, supported by strong bullish momentum and volume confirmation.
Current price: $3,441.
Key levels:
Support: $3,200-$3,250 (established as a strong base).
Resistance: $3,700-$3,800 (next major zone to watch).
Recent reclaim: $3,200 (significant resistance flipped to support).
Market structure: ETH's structure has flipped bullish, with higher lows forming, indicating sustained upward momentum.
Trade setup:
Entry: Current level ($3,441) or on a pullback near $3,250.
Target: $3,700 (major resistance zone).
Stop loss: Below $3,200 to minimize downside risk.
Risk-to-reward: Favorable setup with significant upside potential if $3,700 target is achieved.
Confidence level: 8/10, suggesting a strong probability of continued bullish movement.
Considerations:
Momentum check: Ensure volume remains high to support the upward move.
Risk management: Keep the stop loss tight to limit losses but avoid premature stop-outs.
Resistance zone watch: Monitor price action around $3,700-$3,800 for potential profit-taking or rejection.
This setup aligns with a bullish outlook, but caution is advised near resistance zones. Always manage risk effectively.

An analysis of the end of the accumulation: Key market milestoneThe market is in the final stage of accumulation, which opens up opportunities for the formation of a new trend. The concept of harmonious energy flow allows us to systematically evaluate each stage of this process.
Stages of work with accumulation
1️⃣ Defining the accumulation zone
The boundaries of the rendezvous are set:
The lower limit is 2,920, the upper limit is 3,353.
POC (Point of Control): 3,273.75 - the zone of accumulation of volumes.
Signs of accumulation were detected: a false breakout of the lower boundary (2,920), the price returning to the range.
2️⃣ Liquidity accumulation within the range
False breakouts of the boundaries indicate the activity of large players.
Liquidity accumulates at points of imbalance between buyers and sellers.
🔑 The key: The end of the stage is confirmed by the price returning to the POC zone.
3️⃣ Breakout and transition to a new phase
A breakout of the 3.353 level will signal the transition to a new wave of the trend.
An important criterion is high volumes at the breakout and confirmation of buyer strength.
A test of the 0.3-0.5 Fibonacci retracement levels will allow us to assess the prospects for further momentum.
The role of the Radial-Axis Dynamics
What it is:
Radial-Axis Dynamics allow you to analyze the depth and potential of energy ripples in the market. They are based on the harmony of the interaction of opposing energies in the imbalance zone.
How to work:
Center of harmony: We determine the point of equilibrium - the POC level or the Fibonacci time level (0-2).
Extreme points: At 96% energy depletion, one side of the market gains an advantage. It is important to track this moment:
Zones of deep correction (0.3, 0.5).
Acceleration or deceleration of the momentum through the -0.96 level test (timeframes 5-6).
Trend projection: After the pulsation is completed, the price moves to a new wave of the impulse or harmonizes in a new accumulation zone.
🔄 Key analysis point: The level of -0.96 on the Fibonacci circle, which reflects the extreme limit of the energy pulsation.
Current status (01/13/2025)
Key levels:
POC (3,273.75): The point of harmony to which the price returns to confirm equilibrium.
Critical resistance level is 3,353: Its breakdown with high volumes will open up potential for growth.
Next steps:
Breakout analysis: Watch the reaction to the 3,353 level.
Assessment of volumes: High volumes will confirm the strength of the momentum.
Working with Radial-Axial Dynamics: Monitor energy ripples and test harmonization levels (0.3-0.5 Fibonacci).
Conclusion.
The market is at the critical point of completing the accumulation. The further direction will be determined by the breakout of key levels and the strength of the impulse. The concept of harmonious energy flow and Radial-Axis Dynamics remain important tools for forecasting and working with the market.
🔑 Focus: Breakout of the 3,353 level, volume estimation and work with the harmony of energy on Fibonacci time levels.

Harmonious energy flow on ETH/USDT: preparing for a new impulse🔮 Harmonious energy flow on ETH/USDT: preparing for a new impulse 🔮
Today, we are witnessing an important moment on the chart! The price of ETH/USDT has passed the 96% mark of the previous downward movement, which means the exhaustion of the sellers' potential. The harmonious concept of energy flow suggests that a new radial-axial dynamics (RAD) is forming at this stage. This is the point of equilibrium where energy flows from one side to the other, creating the potential for a new trend.
📍 Key levels:
Local support: 3223 is an important benchmark for holding the price.
Local resistance: 3355 is a key zone where the market will determine its further strength.
📊 What do you need to move up? A harmonious flow of energy requires confirmation in the form:
A manifestation of strength in the accumulation phase. This can be seen in the increase in buyer volumes near support.
Confident consolidation of the price above 3355. Only a breakout of this level and its transformation into support will open the way to new heights.
✨ The essence of a harmonious transition: The current forming ROD is the basis for the upward momentum to continue. The current phase of the market indicates the accumulation of energy, which is the basis for further upward movement. The market is now at a critical point where the balance of power is gradually tilting towards buyers.
👀 What to expect next? A signal for active action will be:
Confirmation of the support zone 3223.
Active breakout of 3355 with strong volumes.
Recommendation: Follow the developments in this zone. The next stage, after confirmation of the harmonic impulse, can lead to new heights, especially if buyers take the initiative in the accumulation phase.
🌊 The harmony of energy always guides us! A little more patience and the market will show us where to go next. 🚀

The market's energy is fueling a new wave of growth!Yesterday was a significant moment for the crypto market. 🌐 We received clear confirmation of the emergence of a new wave of growth. The upward flow of energy confirmed the intention of buyers, and the result of the day consolidated the volumes and showed the readiness to move to new heights. 📈
🎯 Key levels of support and resumption of growth:
- 3525 is the level where a local suspension of movement is possible to accumulate energy.
- 3443 is a zone that can become a key support and a starting point for the resumption of upward movement.
🔍 Chart analysis:
On the daily timeframe, we can see how the price is organically forming a base for continued growth. Yesterday brought progress with a clear buyer's volume, which supports the upward trend. The energy flow is now focused on forming new support points for further upward movement. 🔥
⚡️ What to expect next?
A new wave of growth is already gaining strength, and the buyer is showing stability in intentions. Keep an eye on the situation and the price reaction at key levels. Be prepared for further opportunities that the market opens up! 🌟

ETH/USDT Chart Update:ETH/USDT Chart Update:
Ethereum is trading within a descending triangle on smaller timeframes, a structure often associated with bearish continuation. However, it could also signal accumulation if support holds.
Immediate support lies between $3,100 – $3,050, where buyers are attempting to prevent further declines.
Near-term resistance aligns at $3,200, followed by the upper boundary of the descending triangle near $3,300.
A breakout above $3,300 could trigger a rally towards $3,400 – $3,500, which would invalidate the bearish structure.
A break below the $3,050 level could see ETH retesting the psychological level of $3,000 or deeper support zones.
Volume and momentum indicators should be monitored closely to confirm any breakout or breakdown. Low-volume breakouts may lack sustainability.
Wait for a decisive move beyond the triangle pattern before entering. Bullish bias above $3,300; bearish continuation below $3,050.
This update shows the short-term dynamics and important levels for ETH/USDT in the upcoming sessions.
Let me know if you’d like further assistance or adjustments!
DYOR. NFA

ETH Eyes $2,800 Support: Big Move Incoming?ETHUSDT Technical analysis update
ETHUSDT has been trading within the same range of $2,000–$4,000 for the past 400 days. Currently, the price is forming an inverse head and shoulders pattern. In the coming days, the price could create the right shoulder of this pattern. A possible drop to the strong support zone at $2,700–$2,800 could complete the right shoulder formation. Once the price touches this support level, we can expect a strong bounce from that area.
Good Buy level: $2700- $2800
Regards
Hexa

ETH LONGThe chart shows an accumulation phase near the support level around $3,202.76.
The price action has been ranging, indicating a consolidation period as buyers and sellers are balancing out after taking sellside liquidity.
The area of accumulation is marked in orange, suggesting that this is a critical level where demand could overpower supply, potentially setting up for a breakout.
Key Levels:
Support Level: $3,202.76 (Accumulative Zone)
Target: 6666$
Market Sentiment: Frustration
Disclaimer: Always do your own research and adjust positions based on your risk tolerance.

ETH/USDT Ready to Explode? Inverted H&S Reveals Key Buying LevelDeep dive into the ETH/USDT market analysis across monthly, weekly, daily, and H4 timeframes, identifying a potential buying opportunity.
I’m closely watching key levels, particularly around the $2900 area, as an inverted head and shoulders pattern emerges on higher timeframes.
Tune in to the video for a detailed breakdown and insights on this setup! If you find this helpful and insightful, make sure to follow, boost the post, and share it with any other traders who could benefit from this analysis. - @BlueOceanFx

Ethereum about to break to the upsideEthereum looks has made a falling wedge its standing on the support with a bullish divergence on daily time frame.
is this the bottom? looks like

Ethereum is always fun on januaryAs title says, historically ethereum has always been a fun trade in January.
Also i think current ethereum bull cycle ends around october 2025, that could either mean we top around oct-november or we top around June and make a lower high around year end.
Enjoy.

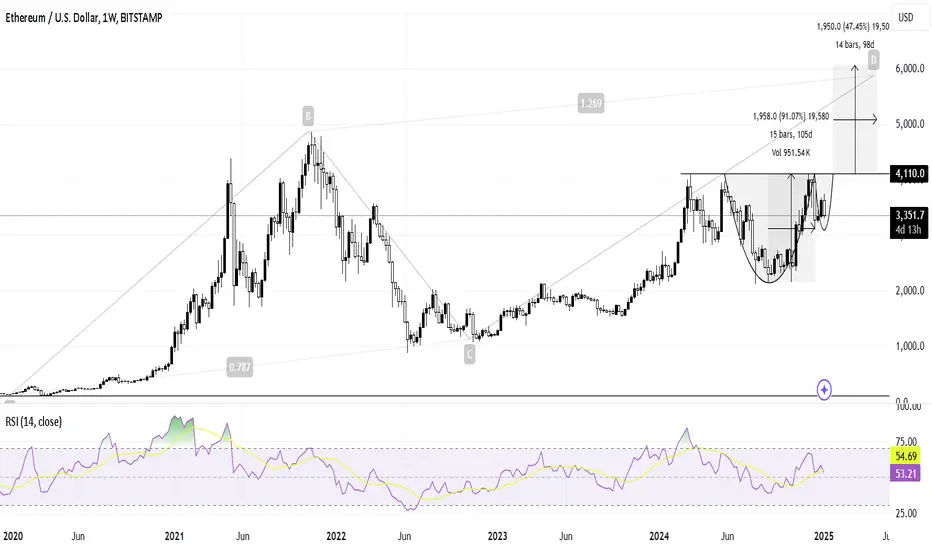
ETH Bullish Setup: Path to $6,000ETH is gearing up for a bull run!
Monthly Chart : An ABCD pattern indicates a price projection around $6,000.
Daily & Weekly Charts : A bullish continuation pattern (Cup and Handle) supports the same target of $6,000.
Strategy :
Buy the dip and hold.
Alternatively, wait for a breakout above $4,110 for confirmation.
ETH | FRACTAL ATH $6000 | Bitcoin Overlay I'm still anticipating the new Ethereum All Time High .
I just don't believe that BTC will make such a climb and ETH stays behind - it hasn't happened before, I don't believe it will happen this time.
What has happened before, is an interesting topic - ETH usually makes its ATH AFTER the BTC rally, about when the cycle comes to an end. We see this playout during the past two peaks. Ethereum stays fairly low beneath it's own previous ATH , and shoots out above BTC just when the cycle ends.
Using a fractal form the previous cycle, this puts an interesting target on ETH.
_______________________
COINBASE:BTCUSD COINBASE:ETHUSD

ETH Bottom is in. LongOverview:
This trade is based on a potential bullish reversal from a significant support level. The chart shows a strong rejection at the recent low around the 2,100 USDT level, which aligns with historical support, suggesting a possible reversal to the upside.
Entry:
Price: The entry for this trade is around 2,721.65 USDT, where the price is currently consolidating after testing support.
Target:
- Target Price: 4,091.91 USDT
- The target is set at a previous key resistance level, where price action has shown strong rejection in the past.
Stop Loss:
- Stop Loss: The stop loss is placed below the recent low at approximately 2,108.16 USDT, ensuring a risk-managed approach if the price breaks below the support level.
Trade Rationale:
- Bullish Bias: The highlighted zone shows a potential area of accumulation where buyers are stepping in, anticipating a move back toward the 4,000 USDT level.
- Risk-Reward: The trade offers a favorable risk-to-reward ratio, targeting a significant move up with a clearly defined stop loss.

ETHUSDT - 1D - Head and ShouldersETHUSDT - 1D - Head and Shoulders
TRADEX BOT NEWS:
May your trading strategies be fruitful!
Over the holidays we have made significant changes to the way the bot operates that allows for scalability so it can be used by everyone.
We will soon have the first version of TradeX BoT, which will function as a second layer Order Book on CEX markets, hiding our greed (TP) and fears (SL) from exchanges.
More news to come soon!
Thank you!
_______________________________________________________
ETHUSDT - 1D - Head and Shoulders
On the 1D TF, ETH is perfectly drawing the Head and Shoulders pattern that could be the catalyst for ETH to shoot its price above the current ATH. It would not be surprising if in this first Q1, ETH reached 7k.
Considering BTC's journey after the launch of the ETFs, ETH has not yet exploded, so it is worth following the evolution of this heat and entering when it gives us opportunities.
The important thing to be successful in trading is to be faithful to our strategy. To be clear about where we are, where we want to go and when it is better to be out in liquidity.
__________________________________________________
Automated Cryptocurrency Trading Bots: All these strategic alternatives can be configured with TradeX BoT, since it will allow you to position in both directions without having to block any amount per position. It will only be necessary for the conditions to be met, either down or up, for the orders to be executed in one direction or another, taking the necessary deposits from your portfolio.
TradeX BoT (in development): Tool to automate trading strategies designed in TradingView. It works with both indicators and technical drawing tools: parallel channels, trend lines, supports, resistances... It allows you to easily establish SL (%), TP (%), SL Trailing... multiple strategies in different values, simultaneous BUY-SELL orders, conditional orders.
This tool is in the process of development and the BETA will soon be ready for testing.
FOLLOW ME and I will keep you informed of the progress we make.
I share with you my technical analysis assessments on certain values that I follow as part of the strategies I design for my portfolio, but I do not recommend anyone to operate based on these indicators. Inform yourself, educate yourself and build your own strategies when investing. I only hope that my comments help you on your own path :)

Ethereum Bullish Outlook: Targeting $8,000 During Altcoin SeasonBINANCE:ETHUSDT
COINBASE:ETHUSD
📈Which side you pick?
Bulls or Bears
SL1 ---> Low-risk status: 1x-2x Leverage
SL2 ---> Mid-risk status: 3x-4x Leverage
(If there is just one SL on the chart, I suggest, low risk status)
After the alt-season scenario occurs, a very likely target for ETH/USDT is around $8,000. Currently, the price is stabilizing, and if it remains within this zone, a strong breakout could drive the price up to the $8,000 target.
In another scenario, if the price breaks below the red zone, a lower dynamic support line could provide protection for buyers around the $2,500 to $2,600 range.
👾Note: The setup is active but expect the uncertain phase as well. also movement lines drawn to predict future price reactions are relative and approximate.
➡️Entry Area:
Yellow zone
⚡️TP:
4K
5.2K
6K
6.8K (Risk-free level)(if the price reached this level, risk-free your positions.)
8K
🔴SL:
2850$
🧐The Alternate scenario:
If the price stabilizes against the direction of the position, below or above the trigger zone, the setup will be canceled.

What’s Your Bullish Price Target for ETH?
Ethereum has been trailing behind some of the alts in the top 100 and even BTC when it comes to parabolic runs. However, I’ve been analyzing the charts, and things are starting to look VERY interesting. Here’s my take:
- On the **3-day chart**, I see a strong **resistance level around $3,830**.
- Using a **Fibonacci extension**, the **1.6 level targets just over $5,000**—a number that feels astronomical but achievable in a bullish scenario. 📈
- The **daily MACD** is screaming **LONG**, indicating potential upward momentum.
### **Positive ETH Data to Back It Up**
Ethereum's fundamentals are stronger than ever:
1. **Total Value Locked (TVL):** Ethereum continues to dominate DeFi, holding **58%+ of all DeFi TVL** at ~$24B.
2. **24H Trading Volume:** Ethereum sees an average of **$6-8B traded daily**, showing its massive liquidity and adoption.
3. **Burn Mechanism:** Since the London Hard Fork (EIP-1559), over **3.9M ETH (~$6.3B)** has been burned, contributing to its deflationary narrative.
4. **Staked ETH:** With **32M ETH staked**, nearly **26% of the supply** is locked up, reducing selling pressure.
### **What's Driving the Bullish Sentiment?**
Recent activity in the **layer-2 ecosystems** is fueling optimism:
- **Optimism (OP)** and **Arbitrum (ARB):** Both L2s have seen substantial adoption, with millions of dollars in daily transactions and climbing TVL.
- **Lido Finance (LDO):** The largest liquid staking protocol continues to thrive, with **~30% of all staked ETH** on its platform.
These projects are growing **on Ethereum**, reinforcing the network’s pivotal role in the crypto ecosystem.
---
What’s your price target for ETH in a bull run? Do you see $5,000 as achievable, or do you have even higher targets in mind? Let's discuss!

ETH 2 triggers for Major alt seasonETH / USDT
Ether is the king of Altcoins … usually when ETH starts to move,majority of Altcoins follow it
Looking at chart we can see 2 triggers for a possible major alt-season :
Trigger1: Breakout and stability above 4k
(This resistance is very tough we can see it rejected the price many times before )
Trigger2: Drop to support below and start to breakout
By the way the lower support must hold at any conditions
Best of wishes

ETHUSDT Analysis: Approach With Caution I have repeatedly highlighted that the market is currently riskier than it appears . As noted in my previous analysis ( ETHUSDT: $4,102 Is the Key ), I am still holding the long position from that level with a stop entry . However, at this point, I do not find opening a new position very logical. Red box has to be first tp and move the stop to entry.
That said, due to the significant interest in finding an entry, I wanted to share this analysis for those who are actively looking.
Key Points:
Market Risk: The market is riskier than it seems, so manage your trades cautiously.
Existing Position: My long position from the linked analysis remains active with a stop entry.
New Entries: Not ideal at current levels, but for those interested, careful analysis is necessary.
Confirmation Indicators: Use CDV, liquidity heatmaps, volume profiles, volume footprints, and upward market structure breaks in lower time frames for validation.
Learn With Me: If you want to learn how to utilize CDV, liquidity heatmaps, volume profiles, and volume footprints for more accurate analysis, feel free to DM me.
If this analysis helps you, please don’t forget to boost and comment. Your support inspires me to share more insights!

ETHUSDT | Valuable LevelsMarket Outlook
Year-End Crypto Performance:
The market performance towards the end of the year might not be very encouraging, suggesting caution in trading decisions.
Key Opportunity:
Green Box: Identified as an ideal buy zone in case of a downturn, providing a strategic entry point for potential gains.
I keep my charts clean and simple because I believe clarity leads to better decisions.
My approach is built on years of experience and a solid track record. I don’t claim to know it all, but I’m confident in my ability to spot high-probability setups.
My Previous Analysis
🐶 DOGEUSDT.P: Next Move
🎨 RENDERUSDT.P: Opportunity of the Month
💎 ETHUSDT.P: Where to Retrace
🟢 BNBUSDT.P: Potential Surge
📊 BTC Dominance: Reaction Zone
🌊 WAVESUSDT.P: Demand Zone Potential
🟣 UNIUSDT.P: Long-Term Trade
🔵 XRPUSDT.P: Entry Zones
🔗 LINKUSDT.P: Follow The River
📈 BTCUSDT.P: Two Key Demand Zones
🟩 POLUSDT: Bullish Momentum
🌟 PENDLEUSDT: Where Opportunity Meets Precision
🔥 BTCUSDT.P: Liquidation of Highly Leveraged Longs
🌊 SOLUSDT.P: SOL's Dip - Your Opportunity
🐸 1000PEPEUSDT.P: Prime Bounce Zone Unlocked
🚀 ETHUSDT.P: Set to Explode - Don't Miss This Game Changer
🤖 IQUSDT: Smart Plan
⚡️ PONDUSDT: A Trade Not Taken Is Better Than a Losing One
💼 STMXUSDT: 2 Buying Areas
🐢 TURBOUSDT: Buy Zones and Buyer Presence

#ETH/USDT#ETH
The price is moving in a descending channel on the 1-hour frame and is expected to continue upwards
We have a trend to stabilize above the moving average 100 again
We have a descending trend on the RSI indicator that supports the rise by breaking it upwards
We have a support area at the lower limit of the channel at a price of 3300
Entry price 3340
First target 3387
Second target 3464
Third target 3556

#ETH/USDT Ready to launch upwards#ETH
The price is moving in an ascending channel on the 1-hour frame and sticking to it well
We have a bounce from the lower limit of the descending channel, this support is at 3600
We have a downtrend on the RSI indicator that is about to be broken, which supports the rise
We have a trend to stabilize above the moving average 100
Entry price 3600
First target 3686
Second target 3772
Third target 3885
