BTC on the Move — Will ETH Join the Rally?Hello everyone!
Bitcoin is on the rise, targeting the liquidity zone above $110,000 . This brings up a key question: Will BINANCE:ETHUSDT follow with a rally of its own?
In this idea, I’ll analyze the current ETHUSDT setup and highlight the key levels to watch for a potential breakout.
ETHUSDT on 4H timeframe
- The previous 4H candle closed above $2,553 , which is a strong bullish signal, as this level has previously acted as firm resistance with multiple rejections.
In my view, ETH is now targeting the liquidity at the top of the falling wedge around $2,738.
If this level is successfully swept, the next likely target is $2,878, where a significant amount of liquidity sits above this swing high.
- If a quick pullback occurs, there is strong demand in the $2,338–$2,311 range , which could serve as a solid support zone. However, in my opinion, this scenario is less likely to play out at the moment .
In conclusion, ETH is well-positioned for a continuation if market conditions remain favorable.
Ethlong

ETH(based on NEowave)now the E wave of that cycle triangle looks like also a triangle.(if you dont know what Im talking about check the last analysis of ETH)
if e wave of this triangle breaks the SL it turns to a diamond diametrical.

BTC clear path to 120kSell in may and go away? My contrarian view is to long BTC through summer and go away in september. Maybe sentiment conditions would change. Lets see.
Fibo at 126k
BTC has been following this path since 2021.


ETH + ALTSEASON | NEW All Time Highs Soon ??This would have been the first time that BTC made a new ATH during a bullish cycle, but ETH didn't - are we too hasty?
Very interesting to compare the two side by side and see that ETH has much more to gain than BTC:
The BTC new ATH update can be found here:
______________________
BINANCE:BTCUSDT BINANCE:ETHUSDT

XRP : LONG FOR THIS WEEK !Hello friends
Considering the good growth we had, you can see that the price has formed a double top pattern and corrected after reaching its ceiling.
Now, with the price correction, there is a good opportunity to buy in stages and with capital management and move with it to the specified goals.
*Trade safely with us*

SOLANA BUYLIMITHello friends
Considering the good growth we had, you can see that the price has made a small correction after reaching its ceiling and has entered a range.
Now, with the price correction, there is a good opportunity to buy in stages and with capital management and move towards the specified goals.
*Trade safely with us*

Last year Nov ETH $ETH VibesIf we See a $2800 Zone Breakout it will be Huge Week for Alts Ethereum
Will history repeat itself?

ETHUSDT.P~We are In Accumulation To Seek Liquidity SSL/4D Maybe (2314)
~If We are "Respected" Next target Is IPDA 40
~ Maybe To Next Week

$ETH quick longWe have in a demand zone while we are on a weekend, so I expect a push to test the trendline
Targets in chart.
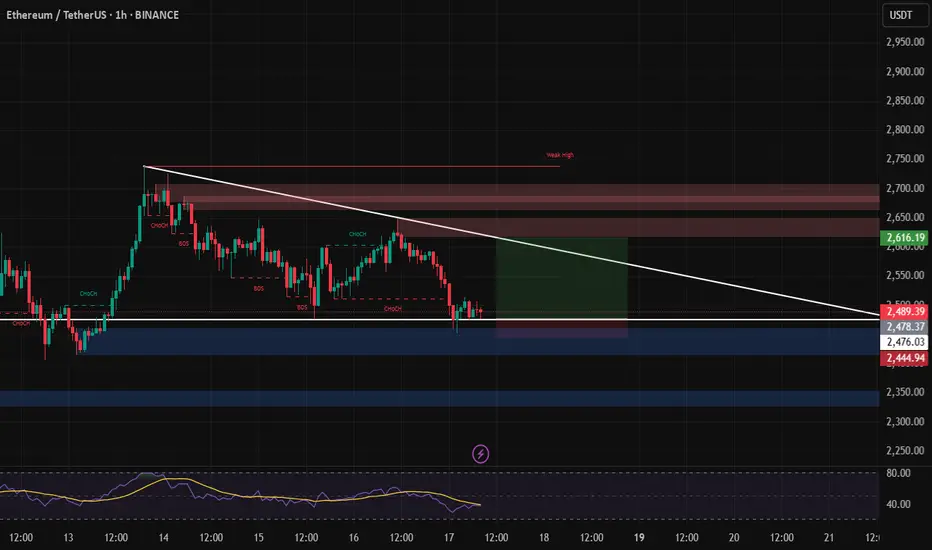
ETH/USDT – First Support in the Blue BoxETH has been slowing down after its latest push, and the first real area to watch is that blue box below price. It’s where buyers will likely step back in, and a clean reaction there could spark a bigger move—especially if ETH/BTC starts to turn higher at the same time.
What you need before pulling the trigger
• A volume surge that outstrips the prior pullback and aligns with a bullish CDV divergence
• A quick break under the blue box on your one- or five-minute chart followed by a fast reclaim, showing order flow flipped to the buy side
• Genuine buying pressure, not just a wick into the zone
“If the levels suddenly break upwards and do not give a downward break in the low time frame, I will not evaluate it. If they break upwards with volume and give a retest, I will look long.”
Jumping in without those confirmations is the easiest way to get shaken out. But if ETH dips into that box, lights up on volume and CDV, and then retests cleanly on the low timeframe, that’s your signal. With ETH/BTC potentially gearing up to rise too, a solid bounce here could turn into something you don’t want to miss.
📌I keep my charts clean and simple because I believe clarity leads to better decisions.
📌My approach is built on years of experience and a solid track record. I don’t claim to know it all but I’m confident in my ability to spot high-probability setups.
📌If you would like to learn how to use the heatmap, cumulative volume delta and volume footprint techniques that I use below to determine very accurate demand regions, you can send me a private message. I help anyone who wants it completely free of charge.
🔑I have a long list of my proven technique below:
🎯 ZENUSDT.P: Patience & Profitability | %230 Reaction from the Sniper Entry
🐶 DOGEUSDT.P: Next Move
🎨 RENDERUSDT.P: Opportunity of the Month
💎 ETHUSDT.P: Where to Retrace
🟢 BNBUSDT.P: Potential Surge
📊 BTC Dominance: Reaction Zone
🌊 WAVESUSDT.P: Demand Zone Potential
🟣 UNIUSDT.P: Long-Term Trade
🔵 XRPUSDT.P: Entry Zones
🔗 LINKUSDT.P: Follow The River
📈 BTCUSDT.P: Two Key Demand Zones
🟩 POLUSDT: Bullish Momentum
🌟 PENDLEUSDT.P: Where Opportunity Meets Precision
🔥 BTCUSDT.P: Liquidation of Highly Leveraged Longs
🌊 SOLUSDT.P: SOL's Dip - Your Opportunity
🐸 1000PEPEUSDT.P: Prime Bounce Zone Unlocked
🚀 ETHUSDT.P: Set to Explode - Don't Miss This Game Changer
🤖 IQUSDT: Smart Plan
⚡️ PONDUSDT: A Trade Not Taken Is Better Than a Losing One
💼 STMXUSDT: 2 Buying Areas
🐢 TURBOUSDT: Buy Zones and Buyer Presence
🌍 ICPUSDT.P: Massive Upside Potential | Check the Trade Update For Seeing Results
🟠 IDEXUSDT: Spot Buy Area | %26 Profit if You Trade with MSB
📌 USUALUSDT: Buyers Are Active + %70 Profit in Total
🌟 FORTHUSDT: Sniper Entry +%26 Reaction
🐳 QKCUSDT: Sniper Entry +%57 Reaction
📊 BTC.D: Retest of Key Area Highly Likely
📊 XNOUSDT %80 Reaction with a Simple Blue Box!
📊 BELUSDT Amazing %120 Reaction!
📊 Simple Red Box, Extraordinary Results
I stopped adding to the list because it's kinda tiring to add 5-10 charts in every move but you can check my profile and see that it goes on..

Ethereum Trap Play Complete – Time to Pump!Trap + deviation strategy in play!
Price faked out below structure, collected liquidity, and reclaimed trendline.
Expecting ETH to continue bullish inside the rising channel.
Target: $2738 | SL: Below $2500

next wave is approaching for EthereumStochastic RSI has reset on different tf's. Bullish div on 4H btw

ETH ANALYSE We have two key levels to watch on ETH:
- Either the price reacts upwards on the $2401 level in H4,
- Or it falls further and reacts at the $2,121 Daily level.
Either way, the fall should not last too long.

Ethereum - Short Term Buy IdeaH1 - Strong bullish move.
No opposite signs.
Currently it looks like a pullback is happening.
Expecting further continuation higher until the two Fibonacci support zones hold.
If you enjoy this idea, don’t forget to LIKE 👍, FOLLOW ✅, SHARE 🙌, and COMMENT ✍! Drop your thoughts and charts below to keep the discussion going. Your support helps keep this content free and reach more people! 🚀
--------------------------------------------------------------------------------------------------------------------
Disclosure: I am part of Trade Nation's Influencer program and receive a monthly fee for using their TradingView charts in my analysis.

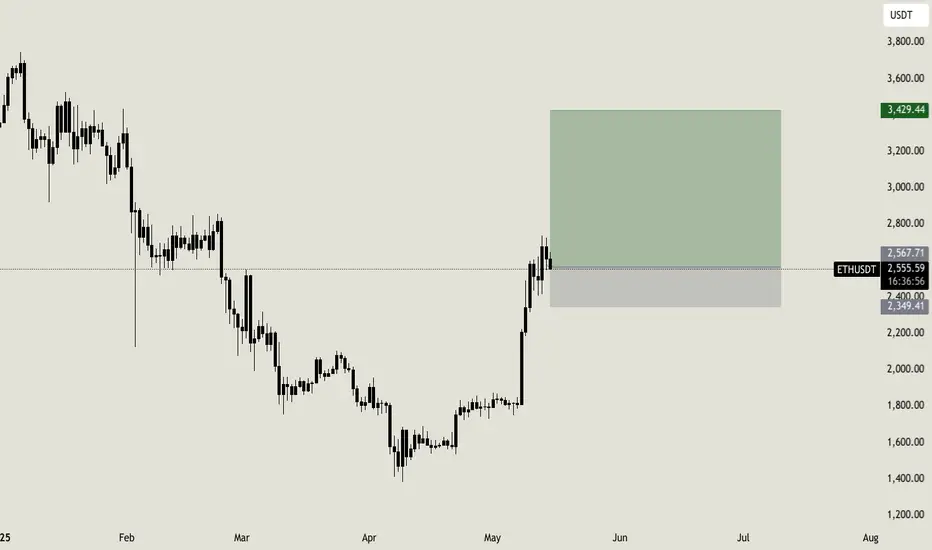
Pectra Breakout to Unleash a New All-Time High? Ethereum’s Breakout Moment – Pectra to Unleash a New All-Time High?
Post with Emojis:
💎🚀 Ethereum’s Breakout Moment – Pectra to Unleash a New All-Time High? 🚀💎
Hey Traders!
Ethereum is standing at the gates of its next legendary move! With price holding strong above $2,531 and the Pectra upgrade just around the corner, all the stars are aligning for what could become one of the biggest rallies since The Merge. Are you ready for the breakout of the year?
📊 Key Levels to Watch:
📍 Support: $2,531 – Bulls holding the line perfectly.
🚀 Breakout Levels: $2,805 – $2,848 – The historic ‘Clashing Rocks’ resistance zone.
🎯 Immediate Targets: $3,200 – $3,500 🚀
🏆 Ultra Bullish Target: $4,000+ All-Time High Breakout Incoming!
📚 Why This Is NOT Just Another Pump:
🔧 Pectra Upgrade is a Game Changer:
💡 Smarter Wallets: No more annoying popups—seamless transactions!
⚡ Frictionless UX: Say goodbye to endless “approve + confirm” loops.
📉 Cheaper Transactions: Blobs scaling kicks in—lower fees, even in the craziest market conditions!
🌱 Staking Revolutionized: Bigger validator caps, faster deposits, smart contract withdrawals.
🔓 Unlocking $490B in Trapped Value: Capital flows freely—fueling the next bull run!
Ethereum is no longer just an asset—it’s transforming into the most efficient and user-friendly financial platform ever built.
💬 Question for You:
Are you already on board this rocket, or are you still watching from the sidelines? Which level will break first—$2,805 or $3,200?
Remember: When history and technology collide, markets explode. This is that moment.
One Love,
The FXPROFESSOR 💙
ps Trump bringing money from all over the place dominate news: for sure some ends up in Ethereum

ETH: The moment looks goodEthereum is trying to show strength. The price is surging and it's important for ETH to not loose the 2350 level. This is an important support zone, loosing it will probably lead the price to $1900-1950
ETH Mid-Term TargetETH will make this chickpea, hazelnut, walnut pattern in the medium term.
**Not investment advice

I see ETH break the trend lineETH owner buy enough coin in their wallet with breaking the descend line.

Ethereum ETH Will Go Insane Soon!Hello, Skyrexians!
It's not a top secret that Bitcoin dominance is about to finish the uptrend and it can give the second life to BINANCE:ETHUSDT . We have already seen the bounce, but now asset is struggling to break through $2600. We can really see small correction in the upcoming week, but finally uptrend has been already confirmed.
Let's take a look at the weekly chart. I marked the Elliott waves structure for you and in my opinion now price is printing the wave 3. At the bottom there was a green dot on Bullish/Bearish Reversal Bar Indicator which is huge confirmation of the bull run. The target for wave 3 is 1.61 Fibonacci at $6500. Anyway, please take into account the second scenario, when BTC dominance will reach 67% and ETH will retest the low (wave 5 in C). Now I have 50/50 probability, but anyway if you bought alts at the 65.3% dominance your deposit will not suffer significantly.
Best regards,
Ivan Skyrexio
___________________________________________________________
Please, boost this article and subscribe our page if you like analysis!

If you're stuck, watch (full analysis)Hello friends
Given the high growth of this token, now that it has made a good correction, it makes sense to buy in stages and with capital management and move with it to the specified goals.
*Trade safely with us*

GOOD POINT Hello friends
As you can see, the price has fallen to the bottom of the next channel with the channel break and now the important point is to see if the price is supported considering reaching the bottom of the channel and the important Fibonacci support?
To solve this issue, we suggest you buy stepwise, of course with capital and risk management...
*Trade safely with us*

LITCOIN SIGNALSHello dears
You see that after a good growth, the price was in a range and then we had a decline until the support area was identified, which is also a good area and it was able to record a new ceiling, which is a good sign. Now the best and least risky thing is to buy steps.
We have identified the buying steps for you and the targets...
Note that this analysis is in daily time and may take a while, so if you are not patient, do not enter.
*Trade safely with us*
