$ETHUSDT 1H Trade Setup CRYPTOCAP:ETH – 1H Trade Setup
- Entry: CMP
- SL: $2,410
- Target: $2,506
ETH broke above the falling trendline and retested it. Clean breakout setup, bullish continuation likely above $2,445.
DYRO, NFA
Ethlongsetup

#ETH/USDT#ETH
The price is moving within a descending channel on the 1-hour frame, adhering well to it, and is on its way to breaking it strongly upwards and retesting it.
We are seeing a rebound from the lower boundary of the descending channel, which is support at 2427.
We have a downtrend on the RSI indicator that is about to break and retest, which supports the upward trend.
We are looking for stability above the 100 moving average.
Entry price: 2447
First target: 2476
Second target: 2500
Third target: 2533

Ethereum Whale Buys $422M in ETH: Bullish Signal or False Hope?
The cryptocurrency market has always been a playground for big players, often referred to as "whales," whose massive transactions can influence market sentiment and price action. Recently, one such Ethereum whale has made headlines by accumulating a staggering $422 million worth of ETH in less than a month. This aggressive buying spree has sparked curiosity and speculation among investors and analysts alike. Is this whale positioning for a massive rally, or are they simply hedging against market uncertainty? Let’s dive into the details of this significant accumulation and explore its potential implications for Ethereum’s price trajectory.
The Whale’s Buying Spree: A Breakdown
Blockchain analytics platforms like Lookonchain and Whale Alert have been tracking the movements of this Ethereum whale over the past few weeks. According to their data, the whale has been systematically purchasing large quantities of ETH across multiple transactions, totaling over 150,000 ETH at an average price of approximately $2,800 per token. This accumulation, valued at $422 million, represents one of the largest buying sprees by a single entity in recent months.
What’s particularly intriguing is the timing of these purchases. The whale began accumulating during a period of relative market uncertainty, with Ethereum hovering near key support levels after a significant correction from its earlier highs. This suggests that the whale may have viewed these price levels as a buying opportunity, potentially anticipating a rebound or long-term growth in Ethereum’s value.
Why Are Whales Accumulating Now?
There are several reasons why a whale might choose to accumulate such a massive amount of ETH at this juncture. First, Ethereum remains the backbone of decentralized finance (DeFi) and non-fungible tokens (NFTs), two sectors that continue to drive innovation and adoption in the crypto space. Despite short-term price volatility, Ethereum’s fundamentals—such as its developer activity, network usage, and upcoming upgrades—remain strong.
Second, the whale may be betting on the long-term impact of Ethereum’s transition to Proof-of-Stake (PoS) via the Merge and subsequent upgrades like sharding. These upgrades are expected to make Ethereum more scalable, energy-efficient, and cost-effective, potentially driving greater adoption and value over time.
Finally, macroeconomic factors could be at play. With inflation concerns and uncertainty in traditional markets, some institutional investors and high-net-worth individuals are turning to cryptocurrencies like Ethereum as a store of value or hedge against economic instability. This whale’s buying spree could be a signal of growing institutional interest in Ethereum as a long-term investment.
Market Implications of the Whale’s Actions
The actions of whales often have a ripple effect on the broader market. When a single entity accumulates such a large amount of a cryptocurrency, it can create a supply crunch, reducing the amount of ETH available for sale on exchanges. This, in turn, can drive up prices if demand remains constant or increases.
Moreover, whale activity often attracts the attention of retail investors, who may interpret such moves as a bullish signal. Social media platforms like Twitter and Reddit are already buzzing with discussions about this whale’s accumulation, with many speculating that a major price rally could be on the horizon. However, it’s worth noting that whale movements can also be a double-edged sword—while accumulation can signal confidence, sudden sell-offs by the same whale could trigger panic and price crashes.
For now, the Ethereum market appears to be reacting positively to this news. In the days following the whale’s most recent purchases, ETH’s price has shown signs of recovery, bouncing off key support levels. But is this just a temporary blip, or the beginning of a sustained rally? Let’s explore this further in the next section.
________________________________________
Ethereum Bounces Hard After Support Bluff: A False Alarm or Fresh Rally?
Ethereum’s price action in recent weeks has kept traders on edge. After a prolonged period of consolidation and a dip toward critical support levels, ETH staged a powerful bounce, reclaiming key technical levels and reigniting hopes of a broader rally. However, the question remains: is this bounce a genuine signal of bullish momentum, or merely a false alarm before another downturn?
The Support Bluff and Subsequent Bounce
Ethereum had been trading in a tight range for much of the past month, with $2,500 acting as a crucial support level. This level was tested multiple times, and on several occasions, it appeared that bears would succeed in pushing the price lower. However, each time ETH approached this support, buyers stepped in, preventing a breakdown.
This repeated defense of $2,500 created what some analysts call a “support bluff”—a situation where the market tests a key level multiple times, creating uncertainty about whether it will hold. Just when it seemed like the support might finally give way, Ethereum staged a hard bounce, surging over 10% in a matter of days to reclaim the $2,800 level. This move caught many traders off guard, particularly those who had positioned for a breakdown.
Technical indicators also supported the bullish case for this bounce. The Relative Strength Index (RSI) moved out of oversold territory, signaling renewed buying pressure, while the Moving Average Convergence Divergence (MACD) showed a bullish crossover on the daily chart. Additionally, on-chain data revealed a spike in transaction volume and active addresses during the bounce, suggesting that the move was backed by genuine market participation.
False Alarm or Fresh Rally?
While the bounce has undoubtedly injected optimism into the Ethereum market, it’s too early to declare a full-fledged rally. Several factors could determine whether this move has legs or if it’s just a temporary relief rally before further downside.
On the bullish side, the whale accumulation discussed earlier could provide a psychological boost to the market. If other large players follow suit and start buying ETH at these levels, it could create a self-reinforcing cycle of demand. Additionally, Ethereum’s fundamentals remain strong, with ongoing developments like the upcoming Cancun-Deneb (Dencun) upgrade, which aims to reduce Layer 2 transaction costs, potentially driving greater adoption.
However, there are also bearish risks to consider. The broader cryptocurrency market remains correlated with macroeconomic conditions, and any negative developments—such as interest rate hikes or geopolitical tensions—could weigh on risk assets like Ethereum. Moreover, if the whale who accumulated $422 million in ETH decides to take profits at higher levels, it could trigger a sharp sell-off, undermining the current momentum.
For now, traders are closely watching key resistance levels around $3,000 and $3,200. A break above these levels could confirm a fresh rally, potentially targeting Ethereum’s previous highs near $4,000. On the other hand, a failure to sustain the current bounce could see ETH retest the $2,500 support, with a breakdown below this level opening the door to further declines.
________________________________________
Ethereum Developer Proposes 6-Second Block Times to Boost Speed, Slash Fees
Ethereum’s scalability and transaction costs have long been points of contention among users and developers. While the transition to Proof-of-Stake has improved energy efficiency, issues like high gas fees and network congestion persist, particularly during periods of high demand. In a bid to address these challenges, Ethereum developer Barnabé Monnot has proposed a radical change: reducing Ethereum’s slot times (the time between blocks) from 12 seconds to just 6 seconds. This proposal aims to make the network more responsive, improve efficiency for DeFi applications, and significantly lower transaction fees. But what are the implications of this change, and is it feasible?
Understanding Slot Times and Their Impact
In Ethereum’s current Proof-of-Stake consensus mechanism, validators propose and confirm blocks in slots that occur every 12 seconds. This slot time was chosen to balance network security, decentralization, and performance. A shorter slot time means blocks are produced more frequently, which could theoretically increase transaction throughput and reduce latency for users.
Barnabé Monnot’s proposal to halve slot times to 6 seconds is based on the idea that faster block production would make Ethereum more responsive, particularly for time-sensitive applications like decentralized exchanges (DEXs) and other DeFi protocols. Additionally, by processing transactions more quickly, the network could reduce congestion during peak periods, potentially leading to lower gas fees for users.
Potential Benefits of 6-Second Slot Times
If implemented successfully, Monnot’s proposal could have several positive impacts on Ethereum:
1. Improved User Experience: Faster block times would reduce the time users have to wait for transactions to be confirmed, making Ethereum more competitive with centralized payment systems and other blockchains like Solana, which boast sub-second transaction finality.
2. Enhanced DeFi Efficiency: DeFi protocols often rely on rapid transaction processing for arbitrage opportunities, liquidations, and other automated functions. A 6-second slot time could make these processes more efficient, potentially attracting more users and capital to Ethereum’s DeFi ecosystem.
3. Lower Gas Fees: By increasing the frequency of block production, the network could process more transactions per minute, reducing competition for block space during high-demand periods. This could lead to lower gas fees, addressing one of the most persistent criticisms of Ethereum.
4. Competitive Edge: Faster block times could help Ethereum maintain its dominance in the smart contract space, especially as rival blockchains continue to innovate with speed and cost efficiency.
Challenges and Risks
While the proposal sounds promising, it’s not without challenges. Reducing slot times could place additional strain on validators, particularly those with less powerful hardware. This could lead to missed slots or delays in block production, potentially undermining network stability. Additionally, shorter slot times could increase the risk of network forks or reorgs (reorganizations of the blockchain), where competing blocks are proposed simultaneously, creating temporary uncertainty about the canonical chain.
Another concern is the impact on decentralization. If faster block times disproportionately favor validators with high-performance hardware or low-latency connections, it could lead to greater centralization of the network, as smaller validators struggle to keep up. This would go against Ethereum’s core ethos of maintaining a decentralized and accessible infrastructure.
Finally, implementing such a change would require extensive testing and coordination among Ethereum’s developer community. Any misstep could result in bugs or vulnerabilities that compromise the network’s security.
Community Response and Next Steps
Monnot’s proposal has sparked lively debate within the Ethereum community. Some developers and users are enthusiastic about the potential for faster transactions and lower fees, while others caution against the risks of rushing such a significant change. Ethereum co-founder Vitalik Buterin has expressed cautious optimism, noting that shorter slot times could be a viable long-term goal but emphasizing the need for thorough research and simulation to understand the full implications.
For now, the proposal remains in the discussion phase, with no concrete timeline for implementation. If it gains traction, it could be tested on Ethereum testnets before being rolled out to the mainnet as part of a future upgrade. Regardless of the outcome, Monnot’s idea highlights Ethereum’s ongoing commitment to innovation and addressing user pain points.
________________________________________
Is Ethereum Staging a Repeat of 2021? Here’s Why a 200% Surge Could Follow
Ethereum’s price history is full of dramatic rallies and corrections, with 2021 standing out as a particularly bullish year. During that period, ETH surged from around $700 at the start of the year to an all-time high of nearly $4,900 in November—a gain of over 600%. As Ethereum shows signs of recovery in 2023, some analysts are drawing parallels to 2021, suggesting that a 200% surge could be on the horizon. But are these comparisons justified, and what factors could drive such a rally?
Parallels Between 2021 and 2023
Several factors from 2021 appear to be resurfacing in 2023, fueling speculation of a repeat performance:
1. Market Sentiment: In early 2021, the crypto market was riding a wave of optimism driven by institutional adoption, mainstream media coverage, and retail FOMO (fear of missing out). Today, while sentiment isn’t quite at 2021 levels, there are signs of growing interest, with major financial institutions exploring blockchain technology and retail investors returning to the market.
2. Network Upgrades: The lead-up to Ethereum’s London Hard Fork in 2021, which introduced the EIP-1559 fee-burning mechanism, was a major catalyst for price appreciation. In 2023, upcoming upgrades like Dencun and potential improvements to block times (as discussed earlier) could similarly boost confidence in Ethereum’s long-term value.
3. DeFi and NFT Growth: The explosive growth of DeFi and NFTs in 2021 drove massive demand for Ethereum, as most of these projects were built on its blockchain. While the hype around NFTs has cooled, DeFi continues to evolve, and new use cases like decentralized social media and gaming could reignite interest in Ethereum.
4. Macro Conditions: In 2021, loose monetary policies and stimulus packages created a favorable environment for risk assets like cryptocurrencies. While the macro environment in 2023 is more challenging, any shift toward accommodative policies—such as interest rate cuts—could provide a tailwind for Ethereum.
Why a 200% Surge Could Happen
If Ethereum is indeed staging a repeat of 2021, a 200% surge from current levels (around $2,800) would take ETH to approximately $8,400—a new all-time high. Several catalysts could make this possible:
• Institutional Adoption: Increased participation from institutional investors, as evidenced by whale accumulation like the $422 million ETH purchase, could drive sustained demand.
• Bitcoin Halving Effect: The upcoming Bitcoin halving in 2024 historically triggers bull runs across the crypto market, with Ethereum often outperforming BTC during these cycles.
• Technical Breakout: If Ethereum breaks above key resistance levels like $3,200 and $4,000, it could trigger a wave of buying momentum from technical traders and algorithms.
• Network Improvements: Successful implementation of upgrades like Dencun or shorter block times could enhance Ethereum’s utility, attracting more users and capital to the ecosystem.
Risks to the Bullish Thesis
Despite the optimism, there are significant risks that could derail a 200% surge. Regulatory uncertainty remains a major concern, with governments worldwide scrutinizing cryptocurrencies and DeFi. Additionally, competition from other Layer 1 blockchains like Solana, Avalanche, and Polkadot could divert developer and user attention away from Ethereum if it fails to address scalability and cost issues.
Moreover, the macro environment remains unpredictable. Persistent inflation, geopolitical tensions, or a prolonged recession could dampen risk appetite, weighing on Ethereum’s price regardless of its fundamentals.
Conclusion
Ethereum is at a fascinating crossroads. The massive $422 million accumulation by a whale signals strong confidence from big players, while the recent price bounce suggests that bullish momentum may be building. At the same time, innovative proposals like Barnabé Monnot’s 6-second block times highlight Ethereum’s commitment to addressing long-standing issues like fees and speed. Whether these factors coalesce into a 2021-style rally remains to be seen, but the potential for a 200% surge is not out of the question if key catalysts align. For now, investors and traders should remain vigilant, keeping an eye on technical levels, on-chain activity, and broader market trends to navigate the exciting but volatile world of Ethereum.

Ethereum Price Reversal ? $2100 Support & Altcoin Season OutlookAfter an extended period of consolidation, Ethereum (ETH) has finally retested the critical support level of $2,100, which aligns closely with the 0.5 Fibonacci retracement level of the bullish trend that began in April. This confluence of technical factors strengthens the validity of this level as a strong demand zone.
The price action suggests that ETH may be gearing up for a bullish reversal, as it respects both horizontal support and key Fibonacci structure. Historically, the 0.5–0.618 retracement zone acts as a high-probability reversal area in trending markets, particularly when accompanied by volume stabilization and long-tailed candles on the daily chart.
Trade Plan: Spot and Futures Positions
Given the current structure, this presents a favorable opportunity to accumulate ETH on spot for the anticipated altcoin season. In addition, leveraged long positions in futures can be considered with clearly defined risk parameters.
Entry Zone: Around \$2,100
Stop Loss: \$2,000 (below key support)
Target Levels:
Primary Target: $2,500 (previous resistance / psychological level)
Secondary Target: $2,600 (major structure high)
The risk-to-reward ratio remains attractive, particularly if the broader crypto market continues its uptrend and Bitcoin maintains stability.
Market Context
Broader macro sentiment and the dominance cycle suggest capital rotation into altcoins could be near. With Ethereum leading major Layer 1s, a recovery from this level could catalyze a wider altcoin rally**, making this an important zone to watch for both intraday traders and swing investors.
⚠️ Note: Due to ongoing geopolitical tensions between Israel, Iran, and the United States, global financial markets—including crypto—may experience heightened volatility. Traders are advised to manage risk carefully and avoid overleveraging during uncertain macro conditions.

ETH: Hardly Any Volatility Not much has happened for Ethereum since yesterday. According to our primary scenario, wave B in turquoise should imminently push higher, theoretically up to resistance at $4,107. Once these corrective rises conclude, wave C should take over, driving ETH down to complete the large green wave in the Target Zone below ($935.82 – $494.15). The low of this multi-year correction should lay the foundation for subsequent wave increases, likely causing new record highs above the $10,000 mark, as the weekly chart suggests. In our alternative scenario, ETH would embark on this bullish journey earlier. Currently at 27% probability, this alternative assumes the corrective low was already established at $1,385, which would imply a direct breakout above $4,107.
📈 Over 190 precise analyses, clear entry points, and defined Target Zones - that's what we do.

ETH Gears Up for 8% Rally After Holding Key Support at $2,484Ethereum (ETH) is currently positioning itself for a potential bullish breakout on the 4-hour chart. After facing a period of mid-June consolidation and volatility, ETH has stabilized above the key support zone at $2,484–$2,551, which previously served as a strong reaction level. This range has now been retested successfully, and price action suggests growing bullish pressure.
At present, ETH is trading around $2,552, holding just above the defined support, which has acted as both a psychological and technical base. The past few candles show reduced selling momentum and a pattern of accumulation that often precedes a breakout. Buyers are stepping in at higher lows, and this shift in structure could signal the beginning of a new leg upward.
The overall setup suggests that Ethereum is now in a classic breakout-retest formation. Volume, while still moderate, has started to pick up slightly, which strengthens the case for a continuation toward the upper resistance zones. The resistance lines at $2,666 and $2,761 represent short- and mid-term upside targets, both previously tested levels where price struggled to close above. If ETH manages to break past $2,666 cleanly, a move to $2,761 becomes increasingly likely.
🔹 Trade Idea (Buy Setup)
• Entry Point: Around $2,552
• Stop Loss: $2,484 (placed just below the major support zone and recent reaction low)
• Target 1 (TP1): $2,666
• Target 2 (TP2): $2,761
• Risk-to-Reward Ratio: ~1:3.16
• Upside Potential: 8.26%
• Downside Risk: 2.62%
This trade setup provides a high-probability long opportunity, with a clearly defined support zone backing the entry. The stop loss at $2,484 gives the trade sufficient breathing room while minimizing downside risk in case of short-term volatility.
There is also a second entry opportunity defined at $2,416, should the market dip unexpectedly before continuing upward. However, this entry is more aggressive and should be approached with flexible risk management — the stop loss for this reentry point is not fixed and should be adjusted as per the trader’s individual risk appetite.
What further strengthens the bullish case is that this reentry zone aligns closely with a historical swing low that previously triggered a strong bullish reversal. If price tests this level again, it may offer a last-chance opportunity for buyers before a larger move unfolds.
The double target strategy — TP1 at $2,666 and TP2 at $2,761 — reflects realistic profit zones based on past price structure and market behavior. Both targets lie within resistance levels that saw significant reaction in recent trading sessions, making them ideal zones for partial or full profit-taking depending on price momentum.
In the broader context, despite ETH’s recent 10% drop, the asset’s ability to hold above the $2,480–$2,500 region demonstrates resilience. This range now acts as a solid foundation from which bulls could initiate a breakout, especially if macro conditions (like BTC strength or positive ETH-related news) align in coming days.
In summary, Ethereum presents a clean long setup from $2,552 with targets up to $2,761, backed by technical support, improving volume, and a bullish price structure. A secondary entry is available at $2,416 for those with higher risk tolerance. If momentum builds above $2,600, ETH could rapidly revisit prior swing highs — and this chart structure makes a compelling case for being prepared ahead of that move.

ETH-----Buy around 2530, target 2580 areaTechnical analysis of ETH contract on June 19:
Today, the large-cycle daily level closed with a small positive line yesterday, the K-line pattern was a single positive line with continuous negatives, the price was below the moving average, and the attached indicator was dead cross. The big trend of decline is still very obvious, but for now, the continuation and strength are relatively poor, which is also the reason why the price is simple and easy to wash; the short-cycle hourly chart yesterday's European market price fell and did not break down, the US market price supported the rebound, the current K-line pattern is continuous positive, and the attached indicator is golden cross, so there is a high probability that it will rise and break the high during the day.
Today's ETH short-term contract trading strategy:
Buy at the current price of 2530 area, stop loss at 2495 area, and target 2580 area;

#ETH/USDT#ETH
The price is moving within a descending channel on the 1-hour frame, adhering well to it, and is heading toward a strong breakout and retest.
We are experiencing a rebound from the lower boundary of the descending channel, which is support at 2460.
We are experiencing a downtrend on the RSI indicator, which is about to break and retest, supporting the upward trend.
We are heading toward stability above the 100 moving average.
Entry price: 2540
First target: 2582
Second target: 2646
Third target: 2717

Ethereum’s 19-Day ETF Inflow Streak: What Really HappenedEthereum’s 19-Day ETF Inflow Streak: What Really Happened to Price, Structure, and Sentiment
Table of Contents
1. Executive Summary
2. ETF Backdrop: How the 19-Day Inflow Wave Took Shape
3. Chronology of Price: Day-by-Day Performance
4. Weekly Chart Anatomy: The “Pre-Tower Top” Signal Explained
5. Intraday Technicals: From $2,450 Low to the $2,620 Hurdle
6. On-Chain & Derivatives Lens: Funding, OI, CEX Balances
7. Fundamental Undercurrents: Dencun Afterglow, L2 Fees, Staking Yields
8. Risks & Catalysts: ETH vs. Macro, vs. BTC Dominance, vs. SEC Noise
9. Playbooks for Traders and Long-Term Allocators
10. Conclusion: A Pause, Not a Peak—If Key Levels Hold
________________________________________
1. Executive Summary
• Ethereum received 19 consecutive days of net inflows into spot-linked exchange-traded products (ETPs) totaling $1.37 billion, the longest positive streak since the 2021 bull-run.
• Over the same period ETH/USD rose 18.4 %, printing a local high at $2,750, but has since pulled back to $2,575 amid broad crypto risk-off and Middle-East tensions.
• The latest weekly candle morphs into a “pre-tower top” pattern—two tall green candles followed by a small-bodied doji—often a harbinger of heavy distribution if confirmed by another red week.
• Short-term structure improved Monday: price pierced a contracting-triangle ceiling at $2,550, reclaimed the 100-hour SMA, and now eyes $2,620 as the gatekeeper to renewed upside.
• Funding rates flipped neutral, exchange reserves hit a 7-year low, and staking deposits outpace withdrawals 1.7 : 1—on-chain signs that the sell-off is more leverage shakeout than top formation.
________________________________________
2. ETF Backdrop: How the 19-Day Inflow Wave Took Shape
2.1. The Players
Unlike Bitcoin’s mammoth U.S. spot ETFs, Ethereum’s inflow streak drew from Europe and Canada, where physically backed ETPs have traded since 2021. The three biggest contributors:
Product Country 19-Day Net Flow AUM Growth
21Shares Ethereum ETP (AETH) Switzerland +$502 m +38 %
CI Galaxy Ethereum ETF (ETHX) Canada +$458 m +29 %
WisdomTree Physical Ethereum EU +$227 m +24 %
Rumors of an SEC approval window “after the U.S. election” sparked pre-positioning; asset managers figured it was cheaper to accumulate now than chase later once liquidity explodes on Wall Street.
2.2. Flow Mechanics
When an ETP issues new shares, it must buy spot ETH or tap an AP that can supply coins—direct demand unmatched by equivalent selling pressure. Over the 19-day window, the net 396 k ETH of creation equaled 57 % of all new issuance from block rewards post-Dencun, creating a measurable supply squeeze.
2.3. Historical Context
The only longer stretch was January–February 2021 (27 days), which culminated in ETH exploding from $1,400 to $2,000. The key difference today: market cap is six times larger, so identical inflows exert a milder percentage impact, explaining why price “only” added ~18 %.
________________________________________
3. Chronology of Price: Day-by-Day Performance
Day Date ETF Net Flow Price Close % Δ vs. Prior Day
1 Mar 18 +$58 m $2,110 —
5 Mar 22 +$73 m $2,265 +7.3 %
10 Mar 27 +$94 m $2,430 +2.4 %
15 Apr 1 +$125 m $2,690 +3.8 %
19 Apr 5 +$81 m $2,750 +0.9 %
Across the stretch, realized volatility rose from 32 % to 46 %, but skew stayed positive, showing call demand outpaced puts until the very end, when geopolitical headlines flipped sentiment.
________________________________________
4. Weekly Chart Anatomy: The “Pre-Tower Top” Signal Explained
4.1. What Is a Tower Top?
In candlestick lore, a tower top comprises:
1. A tall green candle (strong breakout)
2. Another tall green candle (exhaustion)
3. A narrow doji or spinning top (equilibrium)
4. A large red candle (breakdown confirmation)
We currently have the first three pieces: the last two weeks of March delivered back-to-back 10 % advances; the first week of April closed as a +0.6 % doji. The pattern is not confirmed until a decisive red week engulfs the doji body (< $2,540).
4.2. Indicators
• RSI (weekly): 59 → ticking down from 68 high; still shy of overbought.
• MACD histogram: Positive but flattening.
• Bollinger bands: Price mid-point of upper band, room for one more expansion.
Conclusion: the candle warns of fatigue, but momentum hasn’t rolled over—yet.
________________________________________
5. Intraday Technicals: From $2,450 Low to the $2,620 Hurdle
5.1. Hourly Chart (Kraken Feed)
• Triangle Breakout: Price sliced through descending trend-line at $2,550, tagging $2,590.
• Moving Averages: ETH trades marginally above the 100-hour SMA ($2,575) but below the 200-hour ($2,610).
• Fibonacci Zones: $2,620 aligns with 0.5 retrace of the $2,750→$2,450 fall—classic reversal pivot.
A clean hourly close >$2,620 opens the door to $2,680 (0.618 Fib) and psychological $2,700. Failure rejects to $2,520 support cluster.
5.2. Order-Book Heat Map
Coinbase Pro data shows 1,300 ETH ask wall at $2,620 and a thinner 890 ETH bid at $2,520. Liquidity skew favors dip-buying, but bulls need market orders >1 k ETH to smash the ask block.
________________________________________
6. On-Chain & Derivatives Lens
6.1. Exchange Reserves
Centralized exchanges now hold 12.9 million ETH, lowest since July 2017. The 19-day ETF harvest accelerated an already extant down-trend of roughly 60 k ETH/week outflows, mostly into staking contracts and L2 bridges.
6.2. Staking Flows
• Beacon deposit contract: +188 k in April’s first week.
• Withdrawal queue: 11 k ETH—tiny relative to deposits.
• Effective deposit APR after Dencun: 3.2 %, still beating U.S. 2-year T-notes post-tax for many investors.
6.3. Perpetual Funding & OI
• Funding normalized to 0.007 %/8 h (≈ 3.2 % APR), down from 9 % at March highs—spec longs flushed.
• Open Interest shed $420 m in the two-day dip—liquidations, not fresh shorts, drove the wash-out.
6.4. Options Skew
• 25-delta risk reversal (1-month): flipped to –4 % (puts pricier than calls) for first time since January—hedging demand but nowhere near panic-level (–12 % in 2022 bear).
________________________________________
7. Fundamental Undercurrents
7.1. Dencun Afterglow & L2 Fees
Proto-danksharding (EIP-4844) slashed L2 data costs by 85 %, pushing average Arbitrum and Optimism transaction fees under $0.02. Cheaper blockspace fuels on-chain activity:
Metric Pre-Dencun Post-Dencun Δ
Daily L2 Txns 2.4 m 4.1 m +71 %
Bridged ETH to L2s 6.8 m 7.9 m +16 %
More usage → more gas burned → structural tailwind to ETH as a fee-burn asset.
7.2. DeFi TVL
Total value locked rebounded to $61 billion, led by EigenLayer and restaking hype. ETH comprises 68 % of TVL collateral—every lending loop pins additional demand.
7.3. Competing Narratives
• Solana season siphoned retail mind-share; SOL/ETH ratio popped 42 % YTD.
• Bitcoin L2s (Stacks, Rootstock) attempt to mirror Ethereum’s smart-contract moat, but dev tooling remains nascent.
•
Net: Ethereum retains developer supremacy (70 % of new GitHub commits among smart-contract chains) and therefore garners institutional comfort.
________________________________________
8. Risks & Catalysts
Factor Bearish Angle Bullish Rebuttal
Macro Sticky U.S. CPI halts Fed cuts → higher real yields weigh on non-yielders ETH staking yield + MEV is real cash-flow; Dencun lowers L2 costs → adoption offset
SEC Spot ETF Delay past Jan 2026 or outright denial kills U.S. inflow dream 19-day streak proves ex-U.S. capital is hungry; approval >0 is all it takes for supply shock
BTC Dominance Halving FOMO may keep Bitcoin’s share >55 %, starve ETH rotation Historical pattern: ETH rips 6-10 weeks post-halving as beta plays catch-up
Tower-Top Pattern Weekly confirmation could spark drop to $2,200 support Pattern fails if bulls recapture $2,750 quickly, turning doji into bullish flag
________________________________________
9. Playbooks for Traders and Long-Term Allocators
9.1. Short-Term Momentum (0–7 days)
• Bias: Range-trade $2,520–$2,620 until breakout.
• Instruments: ETH-perp on Bybit/Deribit, 3× leveraged tokens for reduced funding bleed.
• Trigger: 15-minute candle above $2,620 with ≥ $50 m aggregated CVD buys.
• Stop: $2,560 (triangle retest).
• Target: $2,680 then $2,700.
9.2. Swing (1–8 weeks)
• Bias: Accumulate dips as long as weekly stays >$2,350 (0.382 Fib of Oct→Mar leg).
• Tools: 1-month $2,500-$2,800 call spreads; spot with 25 % collar protection.
• Catalysts: SEC commentary May 23, FOMC June 18.
9.3. Position (6–18 months)
• Bias: Dollar-cost average into staking nodes; carry 4 % ETH on portfolio NAV.
• Thesis: EIP-4844 usage boom + probable U.S. ETF = $4–5 k fair value by 2026.
• Risk Control: Hedge 25 % notional via BTC-perp short if BTC.D >58 %.
________________________________________
10. Conclusion: A Pause, Not a Peak—If Key Levels Hold
The 19-day ETF inflow streak proves that institutional demand for Ethereum exists even without a U.S. spot vehicle. Price responded vigorously but not parabolically, reflecting the asset’s growing market-cap gravity. The nascent “pre-tower-top” weekly candle warns of exhaustion; confirmation, however, requires another bearish week that cracks $2,540 support.
Short-term order-flow shows willing dip buyers, staking metrics scream supply sink, and the macro backdrop—while shaky—fails to dent ETH’s relative value proposition versus fiat yields. Translation: Ethereum is vulnerable to headline-driven squalls but structurally sound.
If bulls recapture $2,620, the path to retest $2,750 and ultimately $3,000 reopens. Lose $2,450 and the tower top will complete, sending ETH toward $2,200 where ETF inflow buyers likely reload. For now, the balance of evidence favors consolidation with an upward skew—tower construction, perhaps, but no wrecking ball yet.

ETH-----Sell around 2525, target 2475 areaTechnical analysis of ETH contract on June 14:
Today, the large-cycle daily level closed with a small negative line yesterday, the K-line pattern continued to fall, the price was below the moving average, and the attached indicator was dead cross. The decline in the big trend is still very obvious, but we still have to pay attention to the stimulus brought by the news data. The low support is still around the 2300 area; the short-cycle hourly chart yesterday's European session rose and corrected the US session. The price began to retreat under pressure in the Asian morning today. The current K-line pattern is continuous and the price is below the moving average. The attached indicator is dead cross, so it is likely to continue to fluctuate downward during the day.
ETH short-term contract trading strategy:
The current price is 2525, directly short, stop loss in the 2565 area, and the target is the 2475 area;

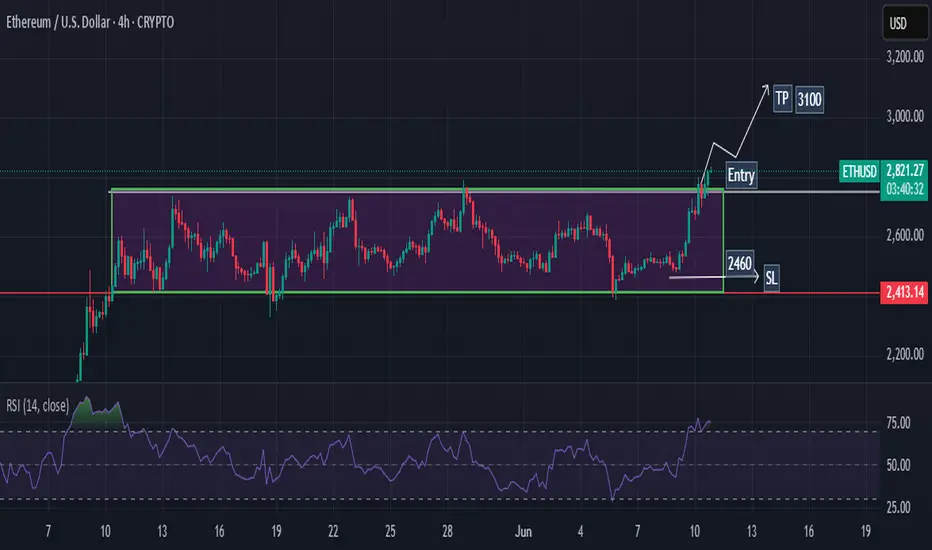
"Bearish Reversal Opportunity Following Supply Zone Rejection"1. Double Top Formation (Resistance Level Identified)
The chart displays a clear double top structure at the 2,760–2,800 USDT level.
This level has acted as a strong supply zone (highlighted in red), where price previously reversed, indicating heavy selling interest.
Current price action has retested this resistance zone and shown signs of rejection.
2. Liquidity Sweeps & False Breakouts
On the left side of the chart, an aggressive downward wick (marked with a blue arrow) suggests a liquidity sweep below a key low before strong bullish momentum returned.
This type of price action indicates smart money involvement, designed to remove weak hands before pushing price higher.
3. Accumulation Phases (Sideways Consolidation)
Multiple accumulation ranges are highlighted with blue rectangles.
These ranges show horizontal consolidation, where price builds up energy before breakout.
The most recent breakout led to a vertical rally toward the resistance zone, signaling an end of the accumulation and a start of distribution.
4. Double Bottom Support Structure
Identified near the 2,480 level, marked by red circles.
This level has historically acted as demand/support, evidenced by multiple bounces from this price zone.
Now highlighted with a grey zone, it is projected to act as the next key support area.
5. Bearish Projection
A large black arrow suggests a forecasted bearish move from the current high (~2,800) back to the support zone (~2,480).
This aligns with the idea of a mean reversion or pullback after a strong bullish impulse.
---
Conclusion & Trade Idea:
🔻 Bias: Bearish (Short-term)
The chart presents a classic reversal pattern with a double top at a well-defined supply zone.
Entry could be considered after confirmation of rejection from this level.
🧠 Trade Plan Suggestion:
Entry: Short near 2,780–2,800 after bearish confirmation (e.g., bearish engulfing candle or break of structure).
Target: 2,480 (support zone).
Stop Loss: Above 2,820 (recent high).
Risk-Reward: Approximately 1:2.5 or better depending on execution.

Ethereum (ETH/USDT) Breakout Watch ! Hello traders here is KingPro's analysis on Ethereum
📈ETH is at the critical resistance level strong closing above it could tiger a bullish move.
Current Price: $2,628
EMA 70 Support: Price is holding above the 70-period EMA ($2,577), showing bullish structure.
Support Zone: The area around $2,320–$2,400 is acting as a strong historical support, confirmed multiple times.
Supply Zone: Consolidation occurred near $2,570–$2,620, but price has broken above it — indicating accumulation.
Critical Resistance Area: Around $2,780–$2,800. This is a key level — a breakout above could lead to strong bullish continuation.
Next Target: $2,782.93 – price may retest this resistance as indicated by the projection arrow.
📊 Trade Idea:
If ETH sustains above $2,620 and breaks the short-term channel resistance, a move toward $2,782+ is likely.
🔒 Risk: A breakdown below the EMA or the supply zone (~$2,570) could invalidate the setup.

ETH HIT THE LIKE TO MANIFEST THISETH/USD is teasing the breakout zone again... 👀
Are we finally ready for liftoff, or is it another fakeout? 🚀🔄
The chart’s looking spicy, and the energy feels right. 🌌
Hit that like to manifest the pump — we’re in this together. 💎🙏
Let’s speak green candles into existence! 📈✨
#ETH #Ethereum #CryptoVibes #ManifestMoneyMoves #ETHUSD #ToTheMoon"

ETH Price Prediction June: Don't Ignore Ethereum's Path to $3KEthereum, the second-largest cryptocurrency by market capitalization, is once again commanding significant attention across the digital asset landscape. As the broader market navigates periods of uncertainty and consolidation, Ethereum appears to be carving out a distinct path, demonstrating remarkable resilience and attracting substantial capital inflows. A confluence of factors, including a new all-time high in a critical on-chain metric, robust institutional interest, and a building technical momentum, suggests that ignoring Ethereum at this juncture would be a misstep for any serious investor. The current market dynamics are painting a compelling picture for Ether's trajectory, particularly as June unfolds, with analysts eyeing significant price levels.
The Unignorable Signal: A New All-Time High in a Major Metric
The digital asset space is often characterized by its volatility and rapid shifts in sentiment. Yet, beneath the surface of daily price fluctuations, fundamental indicators often provide the most profound insights into the health and growth of a blockchain network. For Ethereum, a recent development has sent a clear signal that cannot be overlooked: a major network metric has reached an unprecedented all-time high. While the specific metric can vary, such milestones typically point to an underlying surge in network utility, user adoption, or developer activity.
Consider, for instance, metrics like the total value locked (TVL) in decentralized finance (DeFi) protocols built on Ethereum, the number of active addresses engaging with the network, or the aggregate gas consumption, which reflects overall network demand. A new peak in any of these areas signifies a robust and expanding ecosystem. If the all-time high is in TVL, it suggests that more capital is flowing into and being utilized within Ethereum’s DeFi applications, indicating growing trust and utility in its financial primitives. An increase in active addresses points to a wider user base interacting with the network for various purposes, from transacting to engaging with decentralized applications (dApps). Similarly, sustained high gas consumption, even if it leads to higher transaction fees, underscores the immense demand for block space on the Ethereum blockchain, a testament to its indispensable role in the decentralized internet.
This surge in a key metric is not merely a statistical anomaly; it represents a fundamental validation of Ethereum's long-term vision and its ongoing evolution. It suggests that despite market corrections or periods of sideways trading, the underlying utility and adoption of the Ethereum network continue to grow unabated. This organic growth, driven by real-world use cases and an ever-expanding developer community, forms a strong bedrock for future price appreciation. Pundits are right to highlight this signal, as it separates Ethereum from purely speculative assets and firmly places it in the category of a foundational technology with increasing real-world relevance. It implies that the network's value proposition is strengthening, attracting more users, developers, and capital, thereby reinforcing its position as the leading smart contract platform.
Institutional Endorsement: $296 Million Inflows and a Historical Week
Perhaps one of the most compelling narratives surrounding Ethereum's current strength is the undeniable surge in institutional interest. In a market environment often described as a "slowdown," Ether investment products witnessed an astonishing $296 million in inflows last week. This figure is not just significant in absolute terms; it marks the best week for Ether crypto funds since the election of former US President Donald Trump, a period that dates back several years and encompasses numerous market cycles
.
This monumental inflow of capital from institutional players is a powerful vote of confidence in Ethereum. It signifies that large-scale investors, including hedge funds, asset managers, and family offices, are increasingly allocating significant portions of their portfolios to Ether. Such inflows are particularly noteworthy during a "market slowdown," as they suggest a strategic long-term positioning rather than speculative short-term trading. While retail investors might be more susceptible to market sentiment swings, institutional investors typically conduct extensive due diligence and operate with a longer investment horizon. Their willingness to deploy hundreds of millions of dollars into Ether products indicates a conviction that Ethereum represents a valuable asset with substantial growth potential, capable of delivering strong returns over time.
The context of these inflows is also crucial. Investors are currently awaiting clarity from the US Federal Reserve's June rate decision, a macroeconomic event that often casts a shadow of uncertainty over risk assets. Despite this prevailing caution, institutional money continued to flow into Ethereum, underscoring a belief in its intrinsic value and its ability to perform independently of, or even as a hedge against, traditional market volatility. This behavior suggests that institutions view Ethereum not just as a speculative digital currency, but as a critical piece of the emerging digital economy, akin to a technology stock with immense disruptive potential. The steady accumulation by these sophisticated players provides a strong floor for Ether's price and signals a maturation of the asset class, moving beyond the fringes into mainstream financial portfolios. This institutional embrace is a critical catalyst, providing liquidity, stability, and legitimacy to the Ethereum ecosystem.
Consolidation and Momentum: Setting the Stage for June's Price Action
From a technical analysis perspective, Ethereum's price action has recently been characterized by a period of consolidation. Consolidation, in market terms, refers to a phase where an asset's price trades within a relatively narrow range, often after a significant price movement. This period is typically seen as a time for the market to digest previous gains or losses, allowing for accumulation or distribution before the next major move. For Ethereum, this consolidation is occurring while momentum is visibly building.
The concept of "momentum building" implies that underlying buying pressure is gradually increasing, even if the price isn't making dramatic upward moves on a daily basis. This can manifest through higher lows, decreasing selling pressure at key support levels, and a gradual increase in trading volume during upward movements. This type of price action is often considered healthy, as it allows the market to establish a strong base from which to launch its next leg up. Rather than a parabolic and unsustainable surge, a period of consolidation followed by building momentum suggests a more organic and sustainable growth trajectory. It allows early investors to take profits, new investors to enter, and the market to find a new equilibrium before breaking out.
Ethereum June Price Prediction: Key Levels to Watch
Given the current market dynamics, including the new all-time high in a major metric, the significant institutional inflows, and the building technical momentum, analysts are increasingly bullish on Ethereum's prospects for June. A prominent analyst has explicitly stated that a target of $3,000 is "in sight" for the month. This specific price target is not arbitrary; it likely stems from a combination of technical indicators, such as Fibonacci extensions, previous resistance levels, and psychological price points, combined with the strong fundamental and institutional tailwinds.
To reach and sustain the $3,000 level, Ethereum will need to navigate several key price points. Currently, the immediate resistance levels might be found around recent local highs, perhaps in the range of $2,500 to $2,700. Breaking through these levels with conviction, ideally on increased volume, would confirm the building momentum and pave the way for further upward movement. The psychological barrier of $3,000 itself is significant; once breached, it can often act as a new support level, attracting further buying interest and reinforcing bullish sentiment.
On the downside, key support levels would be crucial to watch. These might lie around the lower bounds of the recent consolidation range, potentially in the $2,200 to $2,300 area. A strong bounce from these levels, should the price retest them, would confirm the underlying strength and the presence of buyers willing to defend these price points. A more significant support could be found around the $2,000 mark, a major psychological and technical level that has historically proven to be a strong area of interest. Maintaining above these critical support zones would be essential to keep the bullish narrative intact and to validate the analyst's $3,000 target.
Factors that could influence this trajectory include the aforementioned US Fed rate decision, which could either provide clarity and boost risk appetite or introduce further caution. Additionally, ongoing developments within the Ethereum ecosystem, such as progress on scalability solutions (Layer 2 networks) and the continued growth of its dApp ecosystem, will play a role. Any major news regarding regulatory clarity or institutional product launches could also act as significant catalysts. However, the current confluence of strong on-chain fundamentals and institutional demand provides a robust foundation for the projected price appreciation.
Ethereum's Enduring Significance and Future Outlook
Beyond the immediate price predictions and market movements, it is crucial to remember Ethereum's enduring significance in the broader cryptocurrency and blockchain landscape. Ethereum is not merely a digital currency; it is the foundational layer for the vast majority of decentralized applications, non-fungible tokens (NFTs), and the burgeoning decentralized finance (DeFi) sector. Its smart contract capabilities have enabled an explosion of innovation, creating an entirely new digital economy that continues to expand at an exponential rate.
The ongoing advancements within the Ethereum ecosystem, particularly the continuous development of its scalability solutions and the transition towards a more energy-efficient consensus mechanism, are critical for its long-term viability and growth. These technical improvements aim to address network congestion and high transaction fees, making Ethereum more accessible and efficient for a global user base. As these solutions mature and become more widely adopted, Ethereum's capacity to host and process an ever-increasing volume of transactions will only strengthen, further solidifying its position as the backbone of the decentralized web.
The "do not ignore" message resonates deeply with Ethereum's fundamental value proposition. It is a network that is constantly evolving, attracting the brightest minds in technology, and demonstrating real-world utility that extends far beyond speculative trading. The combination of a thriving developer community, a vibrant ecosystem of dApps, growing institutional acceptance, and a clear roadmap for future improvements positions Ethereum as a cornerstone of the digital future. The current market signals, from the new all-time high in a key metric to the unprecedented institutional inflows, are not just fleeting trends but indicators of a profound shift in how the financial world and broader society view and utilize this revolutionary technology.
In conclusion, Ethereum stands at a pivotal moment. The convergence of strong on-chain fundamentals, evidenced by a new all-time high in a major network metric, and a significant influx of institutional capital underscores its growing maturity and undeniable importance. Despite broader market uncertainties, Ether investment products have seen historical inflows, signaling deep-seated confidence from sophisticated investors. Technically, the asset is consolidating, building momentum that analysts believe could propel it towards the $3,000 mark in June. For those observing the digital asset space, the message is clear: Ethereum is not just surviving a market slowdown; it is thriving, evolving, and cementing its role as an indispensable pillar of the decentralized economy. Ignoring its current trajectory would be to miss a significant chapter in the ongoing digital revolution.

It tapped the level I was watching. Now it’s time to act, not reBINANCE:ETHUSDT just kissed the 0.382 fib at 2479 — and that’s not coincidence. That’s engineered precision. Anyone still waiting for confirmation is late. The confirmation already happened.
Here’s the structure:
4H FVG sits just below, untouched. It’s a magnet — but we may front-run it.
Price reacted from the 0.382, aligning with volume and previous inefficiency.
The 1H OB above (2541–2585) is the first real test. Break it, and we’re looking for 2640+.
This isn’t trend-following. This is manipulation-following. Watch where price shouldn’t go — and then track where it chooses to go.
What I’m watching:
Long is active from the 2479–2441 zone
TP1: 2510 (half-level reclaim)
TP2: 2541–2585 OB sweep
Final target: 2640.86 (EQ of full move)
Invalidation: clean break below 2440 FVG
A level doesn’t need your belief to hold. It needs liquidity.
More setups — real Smart Money reads, not noise — are posted in the profile.

#ETH/USDT#ETH
The price is moving within a descending channel on the 1-hour frame and is expected to break and continue upward.
We have a trend to stabilize above the 100 moving average once again.
We have a downtrend on the RSI indicator that supports the upward move with a breakout.
We have a support area at the lower limit of the channel at 2429, acting as strong support from which the price can rebound.
Entry price: 2535
First target: 2564
Second target: 2598
Third target: 2647

#ETH/USDT#ETH
The price is moving within a descending channel on the 1-hour frame, adhering well to it, and is heading for a strong breakout and retest.
We are seeing a rebound from the lower boundary of the descending channel, which is support at 2460.
We have a downtrend on the RSI indicator that is about to be broken and retested, supporting the upward trend.
We are looking for stability above the 100 moving average.
Entry price: 2506
First target: 2550
Second target: 2600
Third target: 2656

Technical analysis of ETH contracts (outlook for next week)Technical analysis of ETH contract on June 7 (next week outlook):
After the price rose last year and hit the high point of 4170, the weekly level has been fluctuating downward for four consecutive months this year. After the price rose sharply in May, it has maintained a high-level oscillation trend. The K-line pattern is single Yin and single Yang, and there is no signal of breaking; the daily level is still oscillating in the box, with a high point of 2780 and a low point of 2300; although the price is below the moving average, the attached indicator is dead cross, but the strength and continuation are the current problems; then the advantage of price decline in a short time is relatively large, the current high pressure of the four-hour chart and the hourly chart is near the 2533 area, and the low is near the 2450 area; in general, next week, before the price has no obvious break and trend signal, it is still necessary to follow the trend and still treat it as a range of fluctuations;

Is Ethereum Back In Business? A Confluence of Bullish Patterns Is Ethereum Back In Business? A Confluence of Bullish Patterns, Brutal Liquidations, and Fundamental Strength
The cryptocurrency market is a theater of perpetual drama, a relentless cycle of fear and greed, innovation and volatility. In this unforgiving arena, Ethereum, the world’s second-largest digital asset, has once again captured the spotlight. After a period of underperformance that left investors questioning its momentum, a confluence of technical signals, market-shaking liquidations, and strengthening fundamentals has ignited a fierce debate: Is Ethereum truly back in business? The answer is not a simple yes or no but a complex narrative woven from bullish chart patterns, the chaotic fallout of political spats, and the quiet, inexorable growth of its underlying network.
At the heart of the bullish thesis lies a classic technical analysis signal: the Morningstar candlestick pattern. For traders and analysts who scour charts for clues about future price movements, the appearance of a Morningstar on Ethereum's monthly chart is a development of profound significance. Simultaneously, the market has been violently shaken by an $800 million liquidation event, a brutal culling of leveraged positions in both Bitcoin and Ether, reportedly triggered by a public feud between political and tech titans Donald Trump and Elon Musk. This event serves as a stark reminder of the market's fragility and its susceptibility to external shocks.
Yet, beneath this surface-level chaos, a different story is unfolding. On-chain metrics point to a network that is not just surviving but thriving. Institutional interest is surging, evidenced by substantial inflows into newly approved spot Ethereum Exchange Traded Funds (ETFs). Whales, the market's largest players, are sending mixed but largely accumulative signals. And technological upgrades continue to enhance the network's scalability and utility. This article will delve into these competing narratives—the hopeful story told by the Morningstar pattern, the cautionary tale of massive liquidations, and the quietly confident hum of Ethereum's fundamental growth—to paint a comprehensive picture of where the pioneering smart contract platform stands today.
The Morningstar's Dawn: A Technical Harbinger of a Bullish Reversal
In the lexicon of technical analysis, candlestick patterns provide a visual language for market sentiment. The Morningstar is one of the most revered bullish reversal patterns, a three-candle formation that often signals the end of a downtrend and the beginning of a new upward climb. Its appearance on a high-timeframe chart, such as the monthly chart for Ethereum, carries significant weight, suggesting a major shift in market psychology from bearish despair to bullish optimism.
To understand its power, one must first understand its structure. The pattern consists of three distinct candles appearing after a prolonged price decline. The first is a long bearish candle (typically colored red or black), which confirms the continuation of the downtrend and reflects the sellers' firm control. The second candle is the "star" of the pattern—a small-bodied candle that can be either bullish or bearish. This candle often gaps down from the previous one, indicating a moment of acute indecision in the market. The selling pressure that characterized the first candle has waned, but buyers have not yet seized full control. It represents a point of equilibrium, a pause where the prevailing trend loses its momentum. The third and final candle is a long bullish candle (typically green or white) that closes well into the body of the first bearish candle. This final candle is the confirmation; it signifies that buyers have decisively taken over, overwhelming the sellers and initiating a reversal.
The psychology behind the Morningstar pattern is a story of a power shift. The long bearish candle shows sellers are confident. The small middle candle reveals that confidence is cracking; a battle for control is underway. The final strong bullish candle declares the buyers as the victors, signaling that the path of least resistance is now upwards.
Recently, several crypto analysts have highlighted the formation of this very pattern on Ethereum’s monthly chart. After a period of consolidation and price decline, the emergence of a Morningstar suggests that the bottom of the recent downtrend may be in. Analysts see this as a macro reversal signal, a technical foundation for a potential rally. Some have set initial price targets around $3,300, viewing the current resistance levels as temporary hurdles that will likely be broken in the face of this powerful bullish formation. When combined with other indicators, such as trading volume, which ideally should increase during the formation of the third candle, the Morningstar provides a compelling technical argument that Ethereum is gearing up for a significant move higher. While no technical pattern is infallible, its appearance on a macro scale has undeniably injected a strong dose of optimism into the market, suggesting that Ethereum’s period of slumber may be coming to an end.
The $800 Million Purge: A Tale of Liquidations and Political Tremors
Just as technical analysts were celebrating the bullish omens on the charts, the market delivered a brutal reminder of its inherent volatility. A massive liquidation event, totaling over $800 million and by some estimates approaching $1 billion, swept through the cryptocurrency markets, disproportionately affecting leveraged traders in Bitcoin and Ethereum. In a span of just 24 hours, hundreds of thousands of traders saw their positions forcibly closed, a cascade of selling that sent prices tumbling.
Liquidations are the boogeyman of leveraged trading. When a trader uses borrowed funds (leverage) to amplify their position, they must maintain a certain amount of collateral. If the market moves against their position and their collateral falls below a required threshold, the exchange automatically closes the position to prevent further losses. This forced selling creates a domino effect. As prices fall, more long positions hit their liquidation points, triggering more selling, which in turn drives prices down further, liquidating even more positions. This is a liquidation cascade, and it can lead to rapid and violent price drops.
Recent data showed that long positions accounted for the overwhelming majority of these liquidations, indicating that the market was caught off guard by the sudden downturn. Exchanges like Bybit and Binance were at the epicenter of this financial storm, with Bybit alone reportedly accounting for nearly $354 million in liquidations. The largest single liquidation order was a multi-million dollar position, underscoring the high stakes involved.
What triggered this sudden market panic? Many analysts pointed to an unlikely source: a public and increasingly acrimonious feud between former U.S. President Donald Trump and Tesla CEO Elon Musk. The dispute, reportedly stemming from disagreements over a major tax and spending bill, spilled out onto social media, creating a storm of uncertainty that rattled investors. In today's interconnected world, high-profile clashes between powerful figures can have an immediate and tangible impact on financial markets, particularly on assets perceived as "risk-on," such as cryptocurrencies.
The public fallout was seen as a destabilizing event, injecting political uncertainty into an already fragile market. The fear was that the conflict could have broader economic implications or affect the regulatory landscape for technology and digital assets. This sentiment sparked a broad-based sell-off, not just in crypto but across traditional equities as well. For a market driven heavily by narrative and sentiment, the Trump-Musk tussle provided a powerful bearish catalyst, spooking investors and triggering the cascade of liquidations that sent Bitcoin and Ethereum prices sharply lower. The event serves as a crucial counterpoint to the bullish technical picture, highlighting how susceptible the crypto market remains to macroeconomic and political shocks, regardless of its own internal fundamentals.
The Bullish Undercurrent: On-Chain Metrics and Institutional Adoption
While the liquidation event painted a picture of chaos and fear, a deeper dive into Ethereum's on-chain data and ecosystem developments reveals a much more optimistic and resilient narrative. These fundamental metrics, which track the health and growth of the network itself, often provide a clearer long-term signal than the noise of short-term price fluctuations.
A Thriving and Growing Network
One of the most reliable indicators of a blockchain's long-term value is its network activity. On this front, Ethereum is showing undeniable strength. The number of unique active addresses interacting with the blockchain has been on a steady rise. Recent data shows a significant surge, with weekly active addresses surpassing 17 million, a testament to growing engagement and adoption. This isn't just speculative trading; it reflects genuine usage across Ethereum's vast ecosystem, including decentralized finance (DeFi), non-fungible tokens (NFTs), and Layer 2 scaling solutions.
Furthermore, the growth in new users joining the network is a powerful leading indicator of future demand. The rate of new address creation has been on an upward trajectory, signaling that Ethereum's value proposition continues to attract a broader audience. This organic growth is the lifeblood of any network, creating a flywheel effect: more users attract more developers, who build more valuable applications, which in turn attract even more users.
The Rise of Layer 2 and Technological Upgrades
A key driver of this network growth has been the maturation of Layer 2 scaling solutions like Arbitrum, Optimism, and Base. These networks handle transactions off the main Ethereum chain, allowing for faster speeds and dramatically lower fees while still inheriting Ethereum's security. The explosion of activity on these Layer 2s has been a game-changer, alleviating congestion on the main network and making Ethereum accessible to a wider range of users and applications.
Simultaneously, core protocol upgrades continue to enhance Ethereum's capabilities. The recent Pectra upgrade, for example, has improved scalability and further refined the network's deflationary mechanics. Since the implementation of EIP-1559, a portion of every transaction fee is "burned," or permanently removed from circulation. This, combined with the vast amount of ETH locked in staking contracts, creates a dynamic where the supply of available ETH is constantly shrinking. This principle of decreasing supply coupled with increasing demand is a fundamental recipe for long-term price appreciation.
The Arrival of Institutional Capital
Perhaps the most significant bullish development for Ethereum in recent times has been the approval and successful launch of spot Ethereum ETFs in the United States. This provides a regulated and accessible on-ramp for institutional investors to gain exposure to ETH, unlocking a potential wave of new capital. The early data is promising. In May 2025 alone, spot Ethereum ETFs recorded net inflows of over half a billion dollars, a sharp increase from the previous month.
This institutional validation is a powerful signal. It signifies that some of the world's largest financial players view Ethereum not just as a speculative asset, but as a foundational technology with long-term strategic value. This flow of "sticky" institutional money is expected to provide a strong support floor for the price and reduce volatility over the long run.
The Whale Watch: Accumulation and Confidence
The behavior of "whales"—large holders of Ethereum—provides another crucial, albeit sometimes conflicting, layer of insight. On one hand, there have been reports of significant accumulation by these large players. Data shows massive transfers of ETH from exchanges to private wallets, a classic sign of long-term holding, as it reduces the immediately available supply for selling. One notable transaction involved Galaxy Digital moving hundreds of millions of dollars worth of ETH into a private wallet, suggesting strong institutional confidence. Over the past month, data from on-chain analytics firms has shown that whale wallets have increased their holdings, while retail holdings have slightly decreased, a pattern often seen before a bullish market run.
However, the picture is not entirely one-sided. There have also been instances of long-term whales selling off portions of their holdings, contributing to short-term price drops. This reflects the diverse strategies among large holders. Some may be taking profits, while others are positioning for a long-term hold. Despite the mixed short-term signals, the broader trend appears to be one of accumulation and a net outflow of ETH from exchanges, which is a fundamentally bullish indicator. With exchange balances hitting seven-year lows, the potential for a supply squeeze is becoming increasingly real.
Conclusion: Navigating the Storm Towards a Bullish Horizon
So, is Ethereum back in business? The evidence suggests a resounding, if complex, "yes." The current market environment is a fascinating juxtaposition of short-term turmoil and long-term strength. The public spat between Trump and Musk, and the subsequent $800 million liquidation event, underscore the market's vulnerability to sudden shocks and the perils of leveraged trading. These events serve as a healthy dose of caution, reminding investors that the path forward will undoubtedly be volatile.
However, when we look past the immediate noise, the underlying picture is one of robust and accelerating health. The Morningstar pattern on the monthly chart provides a powerful technical signal that a macro trend reversal is underway, suggesting that the recent period of bearish sentiment has exhausted itself. This technical optimism is strongly supported by fundamentals. Ethereum's network is growing at a remarkable pace, fueled by the success of Layer 2 solutions and continuous protocol improvements that enhance its scalability and economic model.
The most compelling evidence, however, comes from the demand side. The launch of spot Ethereum ETFs has opened the floodgates for institutional capital, a structural shift that will likely define Ethereum's market for years to come. This, combined with the steady accumulation by whales and a shrinking available supply due to burning and staking, creates a powerful bullish cocktail.
Ethereum is navigating a perfect storm of conflicting signals. The violent waves of short-term liquidations and political drama can be disorienting. But beneath the surface, the deep currents of network growth, technological innovation, and institutional adoption are flowing strongly in one direction. For investors who can look beyond the immediate horizon, the story told by Ethereum's fundamentals, supported by classic bullish chart patterns, is not just one of being "back in business"—it's a story of a platform solidifying its position as a cornerstone of the decentralized future.

No impulse here is random. Each wick is a message.ETH has been rotating around inefficiency — not in confusion, but in setup.
This isn’t sideways. It’s structured accumulation just beneath premium OB.
Here’s the narrative:
Price swept the local low, then tapped the 2,619.06 level — a key reaction zone
Above us: a 15M OB at 2,639.07 — this is where early longs will either get paid or punished
Below: 2,592.78, the real demand block — if we break down, that’s the last hold before structure flips
The volume profile shows clear interest at mid-range — meaning Smart Money isn’t chasing price. It’s absorbing.
Expectations:
Hold above 2,619 → target 2,639 and reevaluate
Failure below 2,592 → rotation opens into inefficiency
Execution plan:
Clean long above 2,619, invalidation below 2,592
Short only if price flips 2,639 and fails to hold it on the retest
This is a reaction zone — I’m not chasing. I’m positioned.
Don’t confuse consolidation with indecision. Smart Money’s already placed.
More trades mapped like this — before they move — are in the profile description.

They bought the dip. I anticipated the shift.This ETH setup didn’t require hopium — just structure, volume, and timing.
The chart respected every level I mapped days ago. And now? Price is setting the table again.
We swept liquidity below 2488.11 — textbook turtle soup into a bullish STB on the 1H.
Then price ripped clean into the 4H OB and tapped 2649.12 — the fib extension target. That’s not retail momentum. That’s interbank delivery at work.
Now we’re pulling back. And here’s where it gets clear:
The 0.5–0.618 zone sits between 2586.56–2571.80
It overlaps with the 1H STB zone — a demand pocket from the origin of the expansion
If price consolidates above 2550.78 (the 0.786) and flips 2564.83 again, I expect continuation back toward 2618.32 and 2648.46
If we sweep 2524.01 without reaction — then it’s a deeper rotation
This isn’t a “buy support” setup. This is a model-driven continuation based on structure and internal range logic.
Entry bias is valid above 2580. Below 2524 — it’s invalidated.
I don’t guess entries. I forecast structure.
More models and trades? Check the profile description. Precision lives there.

Price doesn’t chase liquidity. It engineers it.ETH is mid-delivery — not in trend, not in reversal — but in execution. This is where most get faked out. I’m just reading the structure.
Here’s the play:
We’ve tapped into the FVG 4H, reacting from an inefficiency left by the last aggressive selloff
Above that, the BPR 4H marks a supply zone engineered for reaction, not breakout — that’s where early longs will get tested
Fib levels are clean: price is hovering around 0.5 (2,623.76), with clear tolerance for a dip into the 0.618–0.786 (2,584–2,528)
Two paths from here:
A clean push into 2,662.89 → 2,711.32, possibly even sweeping into 2,789.59, followed by rejection from premium imbalance
A deeper pull into OB 4H at 2,457.92 before any real mark-up begins
Execution mindset:
Intraday longs are valid as long as we hold above the 4H OB
HTF liquidity targets sit above 2,660 — but the smarter entries were already taken lower
If we reject the BPR without breaking 2,662, I expect a controlled drop back into discount
This isn’t a breakout. It’s a rebalancing. You don’t follow price. You align with its logic.
For more setups with structure, not noise — check the account description.
