ETH-----Buy around 3850, target 3930 areaTechnical analysis of ETH contract on July 28:
Today, the large-cycle daily level closed with a small positive line yesterday, the K-line pattern continued to rise, the price was above the moving average, and the attached indicator was running in a golden cross. The general trend of rising is still very obvious. The current price has deviated from the moving average and returned to the moving average support position near the 3775 area, so you still need to pay attention to the risk trend of retracement in trading. The overall trend of the short-cycle hourly chart is in a volatile upward trend, but the price is relying on the support of the MA5 and MA10 daily moving averages to rise, and the general trend of rising is relatively obvious, so you still need to find obvious signals to enter the market during the day. The current four-hour moving average support position is near the 3850 area, and the hourly chart continues to fall.
Today's ETH short-term contract trading strategy:
Purchase at the 3850 area when retreating, stop loss at the 3820 area, and target the 3930 area;
Ethreum

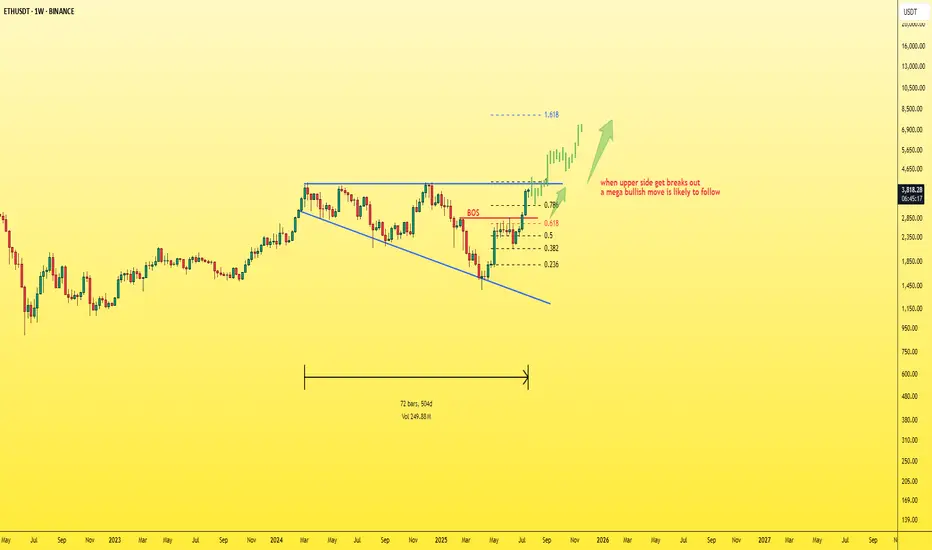
ETH - simple chart and mega moveEthereum is currently the strongest and most stable asset in the market, especially after many had lost hope in it.
Now, Ethereum is back with strength, and it’s just a few steps away from breaking out of the current pattern.
📈A breakout above the upper boundary will likely lead to a new all-time high (ATH) for ETH.
My projection: Ethereum could surpass $7,000 before the end of 2025.
Best regards:
Ceciliones🎯
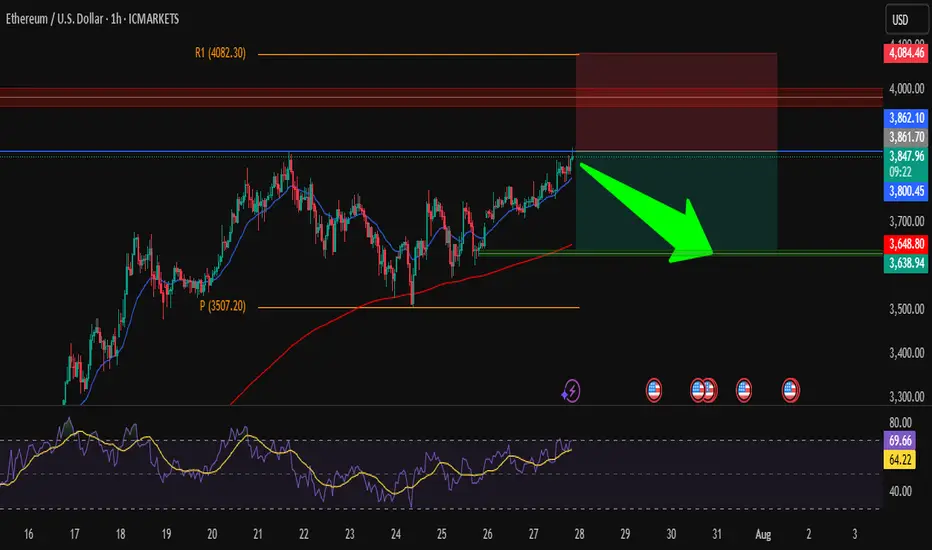
ETH/USD – Short from ResistanceHi traders ! , I opened a short position on ETH/USD as price is hitting a strong resistance zone.
Entry: 3850
SL: 4084.46
TP: 3638.94
📌 Why I took this trade:
Price is testing a strong resistance zone around 3860, RSI is overbought, and we could see a pullback toward the support area around 3640.
Nice risk/reward setup, keeping it simple.
This is just my analysis, not financial advice.
What’s your view — drop or breakout?
You thinking of buying ETH ? read this first
There is a saying- "Charts NEVER lie"
And here it is
ETH USDT Weekly chart, suggesting that, right now, ETH is up against resistance that has rejected it more times than it has been support.
The RSI on this chart also suggests a pull back is coming
Again, RSI has been rejected in this range more times than it found support
Conclusion -WAIT before you buy and see if it crosses that line of resistance and tests it as support before you spend your money
Just saying
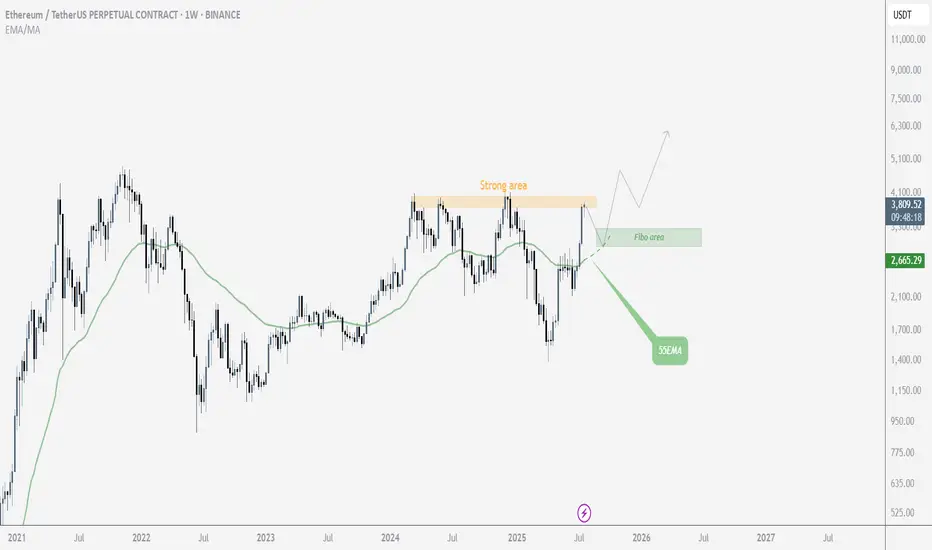
$ETH Mid-TermLooking at Ethereum from a mid-term perspective, it’s currently sitting near its price ceiling, suggesting a potential need for a correction. Of course, it’s also possible that this level could be broken, depending on overall market conditions. However, the primary scenario is that it fails to break through and pulls back, with the potential reversal zone identified based on Fibonacci levels. On the other hand, the 55 EMA is also providing solid support.
If Ethereum manages to break above this resistance, then we'll wait for either a confirmation or a pullback before entering a long position
Bitcoin Versus ETH daily charts- one is VERY BULLISH
No Guesses which one.
Bitcoin printing a Bullish pennant on the daily with the Apex late this Wednesday, After the FED tell us what they are doing with interest rates
PA always reacts before the Apex.
ETh on the other hand, is under a Huge area of long therm resistance and running out of steam
If we zoom out to the weekly, we can see how long this line has rejected PA
My money remains in Bitcoin, whihc has also made gains over the weekend.
And is highly likley to remain there

ETHUSD Long Setup: Targeting $4,000 After Bullish Reversal from ETH just swept the previous lows near $3,650–$3,700, clearing liquidity and flipping that zone into fresh support. This classic price action move often precedes expansion, and ETH looks primed for a continuation toward $4,000 in the coming sessions.
🧠 Technical Analysis
Previous Highs Swept: ETH took out the prior highs around $3,650–$3,700, trapping late shorts and grabbing liquidity.
Break of Structure: We've seen a clear bullish market structure form on the 4H and daily TFs, with higher highs and higher lows intact.
Support Zones:
$3,650–$3,700 (former resistance, now flipped support)
$3,550 (consolidation base before breakout)
Resistance Zones:
$3,950–$4,000 (psychological level + previous 2024 highs)
$4,100+ (weekly imbalance and potential extension zone)
Now that ETH has cleared short-term liquidity and confirmed demand on the retest, the path of least resistance appears to be up.
🔍 Fundamental Outlook
ETH ETF Narrative: Market anticipation for spot ETH ETF approval is heating up, boosting demand and institutional interest.
Reduced Sell Pressure: With the Shanghai upgrade long behind us, staking continues to increase, reducing circulating supply.
Macro Tailwinds: Risk-on sentiment in the broader market is aiding crypto momentum, especially for large-cap assets like ETH.
🎯 Target: $4,000
📉 Invalidated Below: $3,550 (if reclaimed by bears, invalidates bullish thesis)

ARKK: The Calm Before the Innovation Storm -ALTSEASON Is COMING🚀 ARKK: The Calm Before the Innovation Storm 🌪️
The markets are shifting, and disruption is about to go vertical. ARK Innovation ETF (ARKK) is quietly positioning itself for what could be the most explosive move of this decade. With high-conviction bets in AI, Bitcoin, genomics, and next-gen tech, this isn’t just a fund—it’s a launchpad for exponential growth.
This post breaks down exactly why ARKK could go parabolic—and why the smart money is already moving in. 👇
Explosive upside in 2026
ARKK is already up over 24% YTD , showing strong momentum compared to broader markets and signaling early stages of a potential parabolic move .
High-conviction concentration in game-changers
Top 10 holdings include Tesla, Roku, Zoom, Coinbase, UiPath, Block, Crispr Therapeutics, DraftKings, Shopify, and Exact Sciences. These are leaders in innovation sectors with massive upside potential .
Deep exposure to Bitcoin and digital assets
Heavy allocation to Coinbase and Block gives indirect exposure to Bitcoin . If BTC breaks into a new cycle high , ARKK stands to benefit significantly.
Positioned in exponential growth sectors
Focus on AI, genomics, EVs, fintech, robotics, and blockchain , all of which are entering accelerating adoption phases globally.
Aggressive smart-money accumulation
Cathie Wood’s team continues buying aggressively during dips, reinforcing institutional confidence in the fund’s long-term trajectory.
Technical breakout structures forming
Ascending triangle and multi-month consolidation breakouts suggest a technical setup primed for explosive upside .
Innovation supercycle aligning
ARKK's themes are aligned with major global shifts like de-dollarization, decentralized finance, and AI convergence .
High beta = massive upside leverage
With a beta above 2 , ARKK tends to outperform in bull runs , offering leveraged exposure to innovation without the need for margin.
Resurgence of top holdings
Names like Coinbase, Tesla, Shopify, and Roku are up 50%–100% YTD , driving ARKK’s NAV growth and fueling bullish sentiment .
Long-term vision with short-term catalysts
The fund projects 5x returns over the next five years , while Bitcoin halving cycles, tech innovation, and regulatory clarity serve as short-term ignition points .
Marty Boots | 17-Year Trader — smash that 👍👍, hit LIKE & SUBSCRIBE, and share your views in the comments below so we can make better trades & grow together!

Ethereum Charts Aligning for a Major BreakoutI analyzed Ethereum on both the monthly and 2-week timeframes, and the structure looks strong.
On the right side, we have the monthly chart, where ETH has printed a bullish Morning Star pattern right off the key support trendline.
This is a classic reversal signal, and price is now approaching the upper resistance zone. A breakout from here could trigger a major rally, similar to what we saw in 2020.
On the left side, the 2-week chart shows CRYPTOCAP:ETH pressing into a critical resistance zone after a strong bounce. If price breaks and holds above this zone, it could open the doors to $6K–$8K targets in the coming months.
ETH is showing strength, now we wait for confirmation from the breakout.
Thanks for reading!

ETH/USDTHello friends, my analysis for Ethereum is bullish and I think it will continue its recent gains. What do you think?

ETH (5 year of accumulation!)ETH / USDT
📌 Background: i shared an analysis about ETH/BTC chart and i predicted the ultimate bottom, from which ETH/BTC pumped 52% and ETH/USDT pumped 97% in few days !
you can check previous analysis: click here
📌 Today we have different chart against stable coin … Ethereum is being accumulated since 5 years in mega accumulation range with 2 major stop-loss hunt (long and short)
📌 What IF ?
What if ETH made a breakout throughout this accumulation ? i think we can see scenario like that in the green candles in my chart
DO YOU AGREE ?

ETH-----Sell around 3680, target 3650-3630 areaTechnical analysis of ETH contract on July 22:
Today, the large-cycle daily level closed with a small positive line yesterday, the K-line pattern continued to rise, the price was above the moving average, and the attached indicator was running in a golden cross. The overall upward trend was still very obvious, and yesterday's decline can be regarded as a correction based on the current trend. The price just returned to the support of the moving average, and the strong support position was near the 3630 area; the short-cycle hourly chart currently has a continuous negative K-line pattern, the price is below the moving average, and the attached indicator is running in a dead cross, so let's look at the retracement trend during the day, and pay attention to the 3630 area below the support.
Today's ETH short-term contract trading strategy:
The current price is 3680, short, stop loss in the 3745 area, and the target is the 3650-3630 area;

#ETH/USDT SETUP ,Bought From $3696#ETH
The price is moving within a descending channel on the 1-hour frame, adhering well to it, and is on its way to breaking strongly upwards and retesting it.
We have support from the lower boundary of the descending channel at 3640.
We have a downtrend on the RSI indicator that is about to be broken and retested, supporting the upside.
There is a major support area in green at 3600, which represents a strong basis for the upside.
Don't forget a simple thing: ease and capital.
When you reach the first target, save some money and then change your stop-loss order to an entry order.
For inquiries, please leave a comment.
We have a trend to hold above the Moving Average 100.
Entry price: 3696.
First target: 3764.
Second target: 3826.
Third target: 3904.
Don't forget a simple thing: ease and capital.
When you reach your first target, save some money and then change your stop-loss order to an entry order.
For inquiries, please leave a comment.
Thank you.

ETHUSDT TECHNICAL LONG CHART PATTENT ETHUSDT Technical Outlook – Bearish Momentum Building
ETH has clearly rejected the resistance zone near 3900, and the structure has now shifted bearish after failing to hold above 3760.
📉 Trendline Breakdown: Price action confirms entry into a bearish phase, supported by lower highs and a descending trendline.
🟠 First Setup Zone: Around 3500
🎯 Primary Target: 3300
🚨 If momentum continues, a deeper pullback toward 3100 is possible in the coming sessions.
Key Resistance: 3760 – As long as ETH trades below this level, bearish continuation remains in play

ETHUSD heading towards the top of the D1 frame✏️ CRYPTO:ETHUSD is in a strong uptrend towards the resistance zone of the 3800 daily frame. There are not many conditions for the sellers to jump in and reverse the current trend. Wait for the price reaction at the resistance of the D1 frame to consider the SELL strategy. Because currently if BUY is too Fomo.
📉 Key Levels
Sell trigger: Rejection from 3800
Target 3400, potentially 3,380
Leave your comments on the idea. I am happy to read your views.

ETH-----Buy around 3600, target 3660 areaTechnical analysis of ETH contract on July 18:
Today, the large-cycle daily level closed with a small positive line yesterday, the K-line pattern continued to rise, the price was above the moving average, and the attached indicator was running in a golden cross. The general trend of rising is still relatively obvious. Recently, you can see that Ethereum is stronger than the big cake, and the continuous high-breaking prices are getting closer and closer to the previous historical highs. So this month there is a chance to touch or test; the short-cycle hourly chart rose strongly in the morning and broke the previous day's high position. The current price is above the moving average, and the attached indicator is running in a golden cross. The intraday and European sessions still depend on the trend of continuing to break high.
Today's ETH short-term contract trading strategy:
Buy in the 3600 area, stop loss in the 3570 area, and target the 3660 area;

ETH is up about 50% Since June 2025Relying on the absolute intraday low from June to claim that ETH is “up 70%” is a textbook data‑skewing mistake often found in AI‑generated headlines. A more robust approach is to average prices over several days (or even a full week). On that basis, ETH has risen roughly 50% since June— not 70%. Don’t let a distorted headline push you into adding leverage through perpetuals just because your strategy’s returns lag spot performance; that reaction only compounds impermanent‑loss risk.

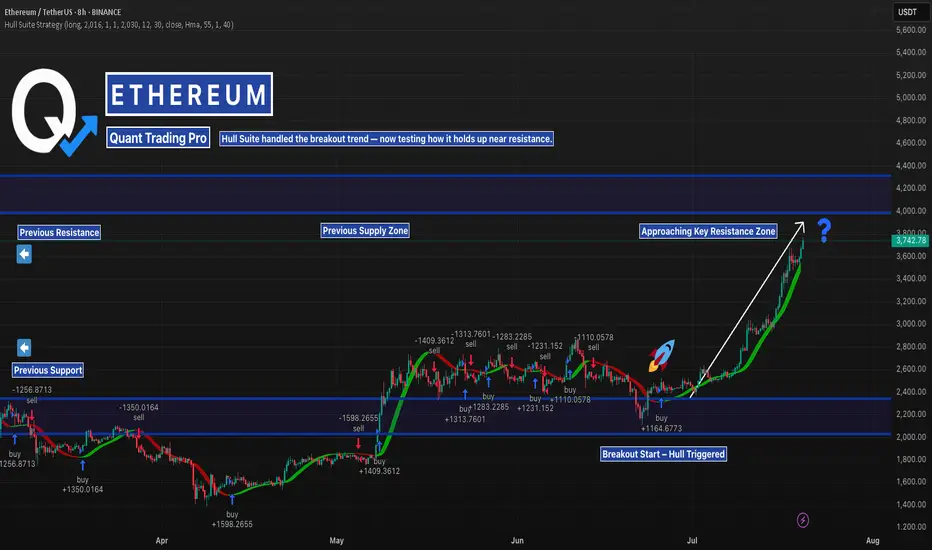
ETH in Liftoff Mode — But Resistance AheadEthereum has been trending hard — with the Hull Suite catching the breakout perfectly from the $2,200 base.
But now it’s flying straight into a key resistance zone that capped price earlier this year.
This is where many trend strategies get tested. Will Hull keep riding the wave — or will we start seeing signs of exhaustion?
📊 Watching closely how it reacts near the previous supply zone. These are the conditions where robust backtests matter most.
—
#ETHUSD #Ethereum #TrendAnalysis #HullSuite #BreakoutTrading #ResistanceZone #QuantTradingPro #TradingView #CryptoAnalysis
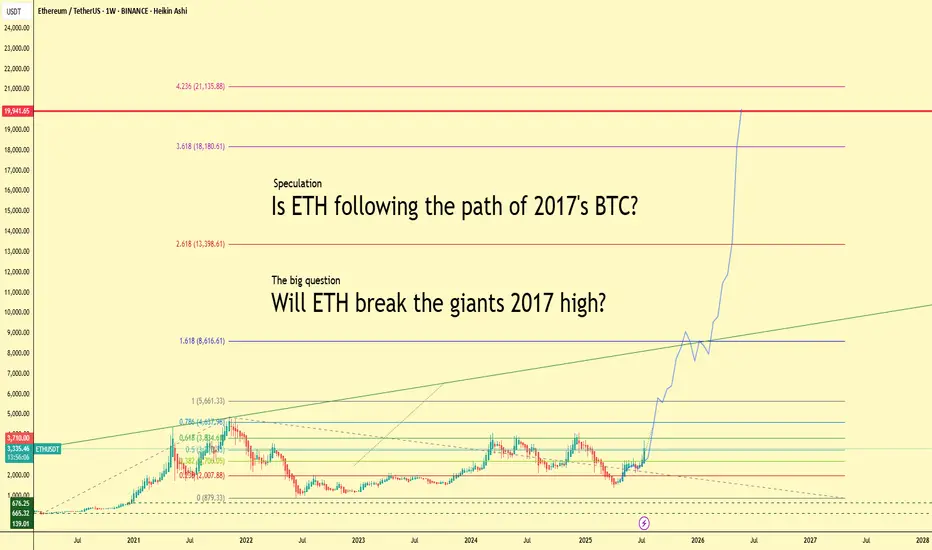
Will ETH Follow BTC’s 2017 Path? $20K in Sight?Ethereum is heating up — up more than 20% this week and currently trading above $3,300. But what if we told you this might just be the beginning?
This chart explores a bold yet exciting speculation:
👉 Is ETH repeating Bitcoin’s legendary 2017 run?
Back then, BTC went from obscurity to global headlines, smashing through $1k, then $5k, then $10k… and eventually peaking just below $20,000. Ethereum might just be lining up for a similar parabolic path.
🚀 Fibonacci Levels Say: Sky’s the Limit
The chart projects Fibonacci extensions up to:
1.618 = $8,600
2.618 = $13,400
3.618 = $18,180
4.236 = $21,135
Notice the key level: $19,941. That’s the legendary BTC high of 2017. Will ETH match or even surpass that milestone?
🧠 The Big Question:
Can ETH become the new “giant”?
While Bitcoin still leads the narrative, Ethereum’s ecosystem, real-world adoption, and institutional attention have never been stronger.
💬 Let’s Talk
Do you believe Ethereum is set to break $20K this cycle? Or is this just hopium and lines? Share your thoughts and let's compare notes.
#Ethereum #ETHUSDT #Crypto #Altseason #BTC2017 #Fibonacci #Bullrun #ETHBreakout #Parabola #CryptoSpeculation
ETHUSDT | Two Opportunities. One Smart Approach.I’ve been closely watching how buyers behave under the green line — and they’re clearly not backing down. But what really catches my eye is the blue box , a clean demand zone I’ve seen act as a launchpad in the past.
You don’t need to jump in blindly.
Depending on your risk appetite, both levels are valid. But if you wait for a 15-minute breakout confirmation on the low timeframe before acting on either, your odds of success increase significantly.
This is how I keep my win rate high, waiting for the market to prove itself first.
“I will not insist on my short idea. If the levels suddenly break upwards and do not give a downward break in the low time frame, I will not evaluate it. If they break upwards with volume and give a retest, I will look long.”
Most traders rush in. You wait smart. That’s the edge.
Choose wisely. Follow closely.
📌I keep my charts clean and simple because I believe clarity leads to better decisions.
📌My approach is built on years of experience and a solid track record. I don’t claim to know it all but I’m confident in my ability to spot high-probability setups.
📌If you would like to learn how to use the heatmap, cumulative volume delta and volume footprint techniques that I use below to determine very accurate demand regions, you can send me a private message. I help anyone who wants it completely free of charge.
🔑I have a long list of my proven technique below:
🎯 ZENUSDT.P: Patience & Profitability | %230 Reaction from the Sniper Entry
🐶 DOGEUSDT.P: Next Move
🎨 RENDERUSDT.P: Opportunity of the Month
💎 ETHUSDT.P: Where to Retrace
🟢 BNBUSDT.P: Potential Surge
📊 BTC Dominance: Reaction Zone
🌊 WAVESUSDT.P: Demand Zone Potential
🟣 UNIUSDT.P: Long-Term Trade
🔵 XRPUSDT.P: Entry Zones
🔗 LINKUSDT.P: Follow The River
📈 BTCUSDT.P: Two Key Demand Zones
🟩 POLUSDT: Bullish Momentum
🌟 PENDLEUSDT.P: Where Opportunity Meets Precision
🔥 BTCUSDT.P: Liquidation of Highly Leveraged Longs
🌊 SOLUSDT.P: SOL's Dip - Your Opportunity
🐸 1000PEPEUSDT.P: Prime Bounce Zone Unlocked
🚀 ETHUSDT.P: Set to Explode - Don't Miss This Game Changer
🤖 IQUSDT: Smart Plan
⚡️ PONDUSDT: A Trade Not Taken Is Better Than a Losing One
💼 STMXUSDT: 2 Buying Areas
🐢 TURBOUSDT: Buy Zones and Buyer Presence
🌍 ICPUSDT.P: Massive Upside Potential | Check the Trade Update For Seeing Results
🟠 IDEXUSDT: Spot Buy Area | %26 Profit if You Trade with MSB
📌 USUALUSDT: Buyers Are Active + %70 Profit in Total
🌟 FORTHUSDT: Sniper Entry +%26 Reaction
🐳 QKCUSDT: Sniper Entry +%57 Reaction
📊 BTC.D: Retest of Key Area Highly Likely
📊 XNOUSDT %80 Reaction with a Simple Blue Box!
📊 BELUSDT Amazing %120 Reaction!
📊 Simple Red Box, Extraordinary Results
I stopped adding to the list because it's kinda tiring to add 5-10 charts in every move but you can check my profile and see that it goes on..

BTC/USD Fake out before Pump | Bullish Flag formationBTC/USDT (1D) Market Outlook – July 1, 2025
Introduction
BTC is currently consolidating within a bullish flag pattern after printing a swing high at 108.9K and a recent swing low at 98K. The price sits just below a major supply zone.
Context 1: Key Zones
Supply: 104.6K – 112.1K
Demand: 74.4K – 82.5K
Fair Value Gaps (FVG): 3 zones below price, with one near 88–90K
Context 2: Technical Confluence
Liquidation Zone: 106.2K
Golden Pocket (Fib 0.618): 102.1K
Psychological Levels: 105K and 110K
Context 3: Market Structure
Pattern: Bullish flag
Trend (LTF): Sideways/consolidation
Volume Profile: Heavy activity near 105K–110K
Bullish Scenario
Breaks above 106.2K (liq zone)
Pulls back to 102.1K (golden pocket), forms higher low
Retests resistance for continuation
Alt scenario: clean breakout above resistance → ATH retest
Bearish Scenario
Breaks below 106.2K and flag support
Fills FVG, breaks prior low at 98K
Triggers macro downtrend toward 88–90K zone
Summary
BTC is at a decision point inside a bullish flag, facing supply. A break above 106.2K favors upside continuation, while rejection and a lower low could trigger a deeper retracement. Watch key levels closely.

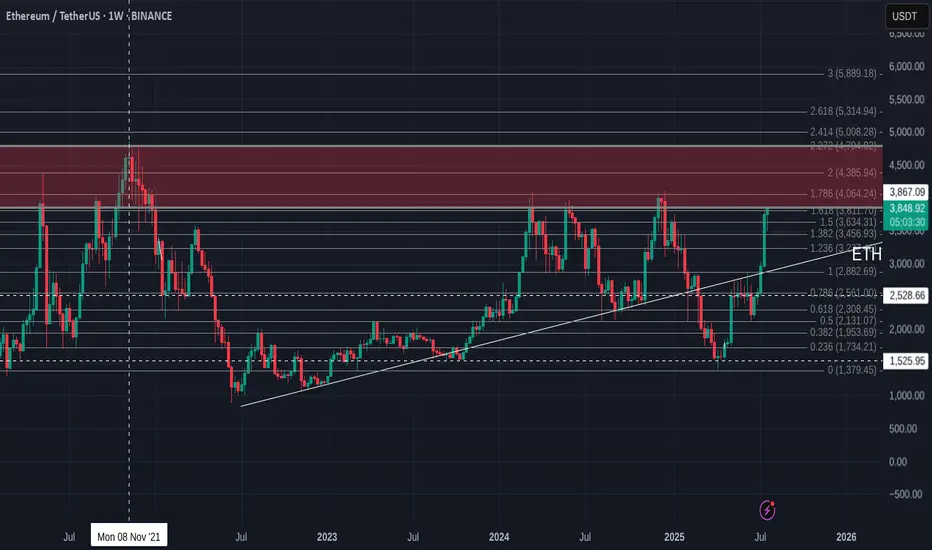
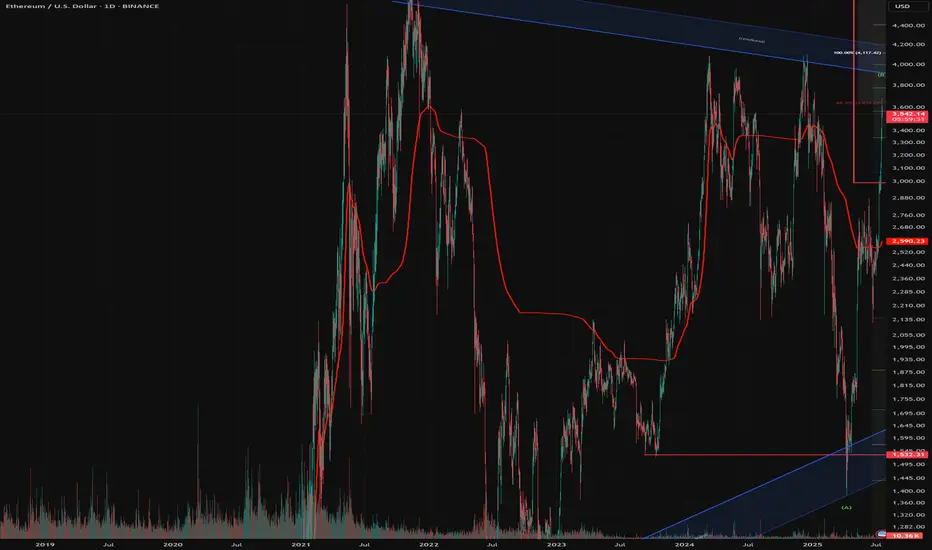
MY VIEW ON ETH - BULLISH & BEARISHMy analysis of Ethereum (ETH): Bullish and bearish scenario
The analysis of Ethereum is currently quite complex. The price structure does not show clear impulses in the form of classic wave movements, but frequently overlapping patterns that indicate ABC correction waves.
I therefore present both my primary and an alternative scenario for a bullish (rising) and a bearish (falling) trend.
Primary bullish scenario:
Wave 2 seems to be completed at the lower end of the blue trend channel and at the 70.70-% FiB. We could currently be in red wave 3. However, the structure of this movement is more reminiscent of an ABC formation, which could indicate a weaker impulse.
Should the price break through the upper edge of the blue trend channel and exceed the 100% Fibonacci level at around USD 4,424, several important Fibonacci zones would converge in the “profit area” marked in red. In this case, a setback as part of the red wave 4 could not be ruled out.
Alternative (bearish) scenario:
It is possible that the blue V-wave could turn into a white ABC structure. In this case, an additional wave 4 would be omitted, which could result in a stronger sell-off.
Secondary scenario - bearish:
If Ethereum fails to play out the primary bullish count scenario, I expect that we will continue to be in an overarching correction phase. This assessment also fits in with the typical market slowdown during the summer months.
In this case, a green ABC correction could form, whereby wave C could theoretically still rise to the 100% Fibonacci level at USD 4,416. However, this would be an overextended wave B.
In addition, we are already in the area of the sales or profit zone, which indicates that only a limited rise is possible.
Subsequently, I expect a stronger downward movement towards the green buy area between the 1.618 Fibonacci level and around USD 1,866.
LEAVE YOUR COMMENTS AND ASSESSMENT
ETHUSDTThis movement downtrend. If breake 2.790 movr to 3.500$ but breke 2.200 move trend to 1.500$.
