ETHUSDTThis movement downtrend. If breake 2.790 movr to 3.500$ but breke 2.200 move trend to 1.500$.
Ethreum

$ETH Ethereum Market Outlook – July 2025Ethereum Market Outlook – July 2025
Brought to you by ProfessorXtrader
🚀 Ethereum Breakout Confirms Multi-Year Bullish Setup
Ethereum ( CRYPTOCAP:ETH ) has officially broken out of a multi-year consolidation range, signaling a strong bullish cycle ahead. With the current price sitting at $3,645.50, ETH has posted a remarkable 46.65% monthly gain as of July 18, 2025.
This move sets the stage for a multi-tiered upside potential — here’s what the chart is telling us.
📊 Key Levels & Targets
🔸 Previous Consolidation Range (2018–2021)
ETH spent over three years capped under the ~$4,884 level, forming a solid accumulation base.
🔸 Breakout Zone
Support: $1,150 – $1,250
Confirmation of Cycle Shift: Price now trading well above breakout zone.
🎯 Upside Targets (Ethereum)
1st Target:
📍 Price: $7,387.56
📈 Potential Gain: ~100%+ from breakout zone
2nd Target:
📍 Price: $11,394.14
📈 Potential Gain: ~180%
Final Exit (Major Reversal Zone):
📍 Price Range: $15,443.81 – $15,477.64
🚨 Total Gain Potential: ~280% from breakout
📌 The area between $15.4K to $18K is marked as the Major Reversal Zone, a region where profit-taking and trend exhaustion are highly likely.
📈 Market Interpretation
Bullish Breakout: Long-term resistance is now support.
Volume & Momentum: Strong monthly candle with expanding volatility confirms conviction.
Structure: Targets are based on clean technical projections, Fibonacci expansions, and market psychology.
🔔 What to Watch Next
📅 Monthly Close above current levels will confirm the breakout.
🔍 Monitor for rejection signals near the first target.
📉 Place trailing stops as we approach the major reversal zone.
💡 Pro Tip from ProfessorXtrader
"The biggest profits in crypto are made during clean breakouts from multi-year ranges. ETH is entering that phase now — plan your targets and protect your capital as you climb."

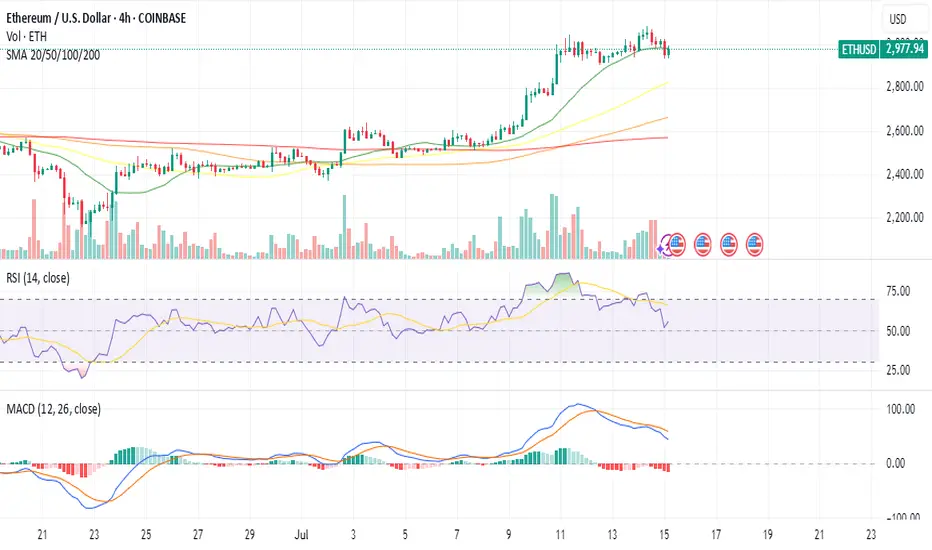
Ethereum/US Dollar 1D Chart - BINANCEdaily price movement of Ethereum (ETH) against the US Dollar (USD) on the Binance exchange. The current price is $2,992.08, reflecting a +1.39% increase (+$41.10) as of 09:54 AM CEST, July 11, 2025. Key levels include a resistance zone around $3,500-$4,000 and support near $2,736. The chart highlights recent buy and sell signals, with a notable upward trend approaching the resistance zone.

ETH relative to AltcoinsI fee like at this current point as we see altcoin pairs bleed against ETH and BTC while putting in lower lows while Eth puts in higher highs we will not see the altseason we are hoping for until altcoin pairs hit here range lows which I can see happen end of Q3 into the start of Q4 but until then they can still rise as ETH.D continues its rally but I feel until altcoins reach its range lows being the .25 lvl on (TOTAL3-USDT)/BTC we will not see that face melting rally we are looking for.

When will Altseason start?So with ETH.D sweeping its all time low I feel very confident that eth has made the low for this cycle as well as BTC.D retracing providing further confluence that this is the case and we will see eth start to outperform bitcoin but I begun to question where altcoins stand currently stand and when we will start to see them outperform both BTC and ETH as they currently bleed to them as Both ETH and BTC make higher lows while altcoin pairs are making lower lows. I feel like until we see a run above this trend line above the .82 lvl we will see altcoins bleed against ETH and BTC.

New phase of ETH adoption? holding longLot of bills and adoption of ETH ecosystem, i do like the idea of another 2017 like breakout, CRYPTOCAP:ETH COINBASE:ETHUSD

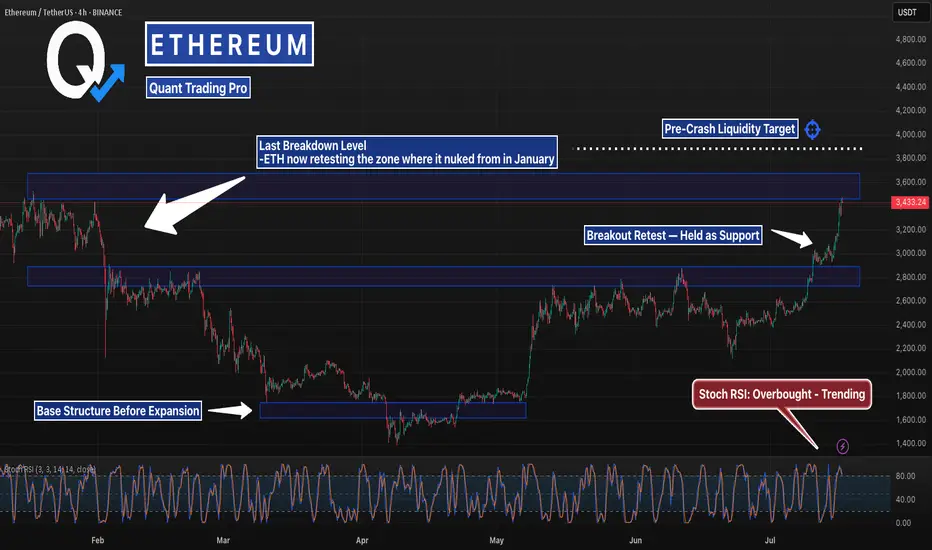
This Level Crashed ETH Last Time… It’s BackETH just blasted back into the same zone it collapsed from in January — but this time the structure underneath is stronger, tighter, and holding.
Stoch RSI is stretched, but bullish momentum remains intact. If it clears $3,870, lights out.
#Ethereum #ETHUSD #CryptoCharts #BreakoutLevels #ChartAnalysis #TradingView #QuantTradingPro #CryptoTraders #BacktestEverything
ETHUSDT minor trendsEthereum BINANCE:ETHUSDT is downtrend with lower highs from the bottom is nearly finished 📉 . For a stronger rise, it needs to stabilize above $2500 ⚡. Mid-term targets are $3300 (end of second leg) and $3700 (major resistance) 🎯. Key supports are $2500, $2070, $1800, and $1550, the base where the uptrend began 🛡️.
Supports & Resistances:
Supports: \$2500, \$2070, \$1800, \$1550
Resistances: \$2500 (critical level), \$3300, \$3700

ETHUSD: Double Top into A Bearish 5-0 Breakdown (Extended)Updated Commentary: ETH has extended a bit further than projected as the Pattern Completed at the 0.618 but ETH gapped into the 0.786 instead. The gap up aligned with an upside gap fill on the CME futures as well as a gap fill on the grayscale ETH futures ETF $ETHE. The easier move from here to simply add to the ETH shorts and adjust the stop to be above the previous highs while sizing up at the 0.786 and playing off this gap higher as an anomaly. Beyond this, my view on ETH at the current 0.786 retrace remains the same as the original Idea posted as ETH rose into the initial 0.618 PCZ the details of which I will also include once again below as it still remains relevant.
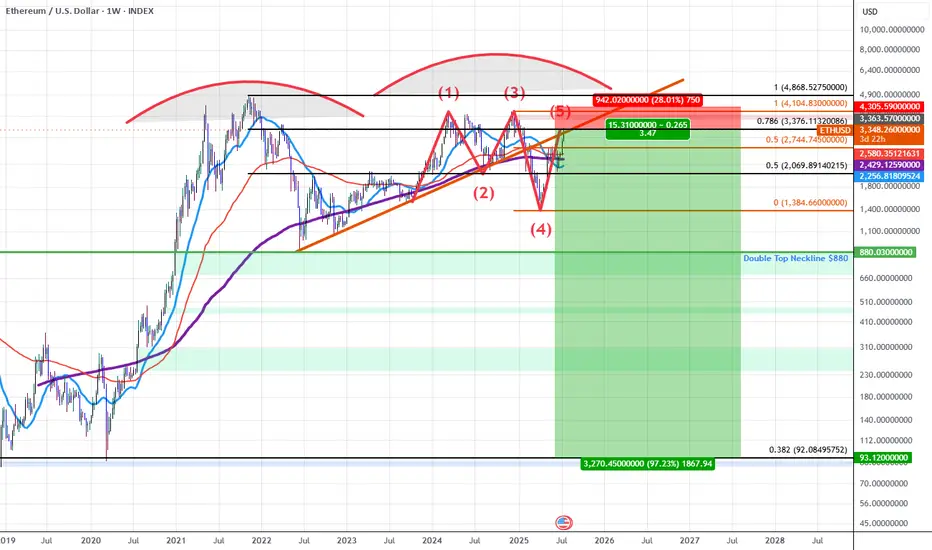
ETH for the last 5 years has been developing a Double Topping pattern which has put in a series of lower highs during the most recent 2nd run up. As we've confirmed these lower highs we've broken down below trendline and are finding resistance at the trendline which happens to have confluence with the PCZ of a Bearish 5-0 wave formation near a 0.786 retrace.
As we begin to find weakness and Bearish price action begins I suspect price will make it's way towards the neckline of the double top aligning with the $880 price level if ETH breaks below that level there will be no significant support until it reaches the all-time 0.382 retrace down at around $92.10.
In short it seems ETH is in the early stages of a macro breakdown which could result in value declines greater than 80%.
I also suspect that we will see many of the assets that ran up significantly going into this week to sharply reverse those run-ups as this week comes to a close and the new week begins mainly due to the effects of OpEx, this includes: Bitcoin, MSTR, SOL, XLC, META, and BTBT. Long-dated Put accumulation on these assets at these levels is far easier to manage than naked short positions and that's how I will go about positioning here.
ETHUSDT 1D Chart Analysis | RSI Strength & Fibonacci TargetsETHUSDT 4H Chart Analysis | RSI Strength & Fibonacci Targets in Play
🔍 Let’s break down the latest ETH/USDT setup — bullish momentum is building with confluences pointing toward key upside targets.
⏳ 4-Hour Overview
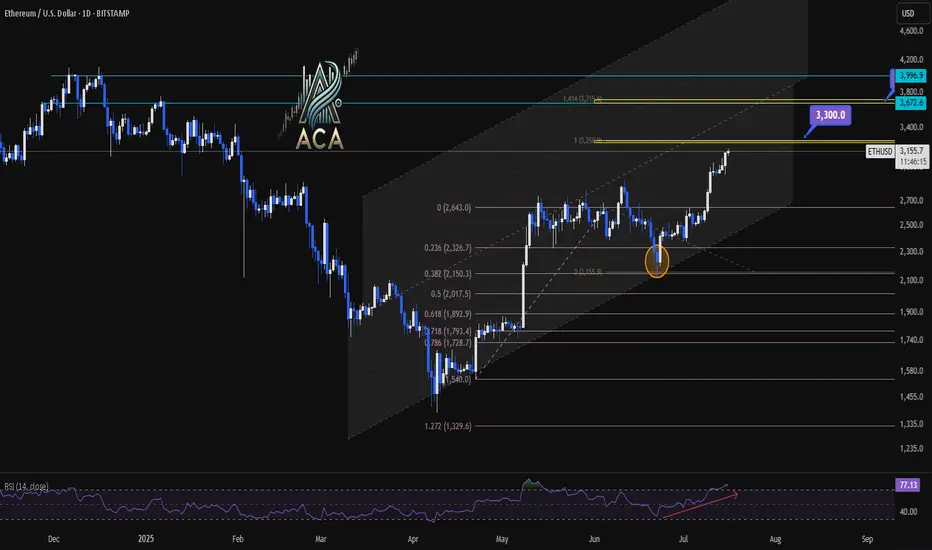
Ether continues climbing within a well-defined ascending channel, with recent candles holding above mid-level support. Price is pressing higher from a clean bounce at the 0.5 and 0.618 Fibonacci retracement zone ($2,017–$1,899), signaling the correction has likely ended.
📉 Fibonacci Levels & RSI Confirmation
- The strong recovery aligns with rising volume and a bullish structure.
- RSI is pushing into overbought territory (above 73), often a sign of strength during trends—not exhaustion.
- ETH is now positioned for a breakout continuation move if momentum holds.
🎯 Bullish Targets Ahead
- Immediate resistance: $3,300 (1.414 Fib extension + historical supply)
- Next major target: $3,700 (1.618 extension + upper channel confluence)
- Pullback zones: $2,950 (mid-channel) and $2,017 (Fib support base)
📊 Key Highlights:
- Price is respecting the rising channel structure — higher lows, higher highs in play.
- Volume supports the breakout narrative, rising on green candles.
- RSI breakout supports trend continuation, not exhaustion.
- Targets at $3,300 and $3,700 remain actionable on a confirmed breakout.
🚨 Conclusion:
ETH is showing a multi-variable bullish setup with clear continuation potential. A strong move above $3,300 could quickly send price toward $3,700. Pullbacks to $2,950–$2,017 could offer high-risk/reward re-entry zones. Momentum favors bulls — stay alert.
ETH to $4K ? Whales Accumulate as ETFs Break Records🕞 Timeframe: 4H
.
🟢 Bias: Bullish
1. 🧭 Fundamental Overview:
📈 Massive Institutional Inflows:
Ethereum ETFs have recorded over $1.2 billion in net inflows this July, with $908M just in the week ending July 11. This strong demand from institutional players (notably through ETHA and Bitwise) has pushed ETF AUM above $13.5 billion.
🏢 Corporate Accumulation:
Companies such as SharpLink Gaming have begun adding ETH to their balance sheets. SharpLink's 10,000 ETH (~$49M) purchase highlights growing corporate adoption of Ethereum as a store of value and strategic reserve.
🛠️ Ecosystem Resilience:
Ethereum continues to lead in network upgrades (e.g., Dencun), institutional DeFi, and tokenized assets—strengthening the long-term fundamentals of the chain.
2. 🧠 Sentiment & On‑Chain Metrics
🏦 Institutional Sentiment:
Ethereum ETFs have seen 12 straight weeks of inflows, outperforming Bitcoin in institutional allocation growth (ETH: 1.6%, BTC: 0.8%).
🐋 Whale Activity & Exchange Flows:
Declining ETH balances on exchanges suggest accumulation and reduced sell pressure. Whales and smart money are taking positions.
📊 Public Sentiment:
Bullish expectations remain strong amid price consolidation above key levels and positive ETF momentum.
3. 🔼 Key Levels:
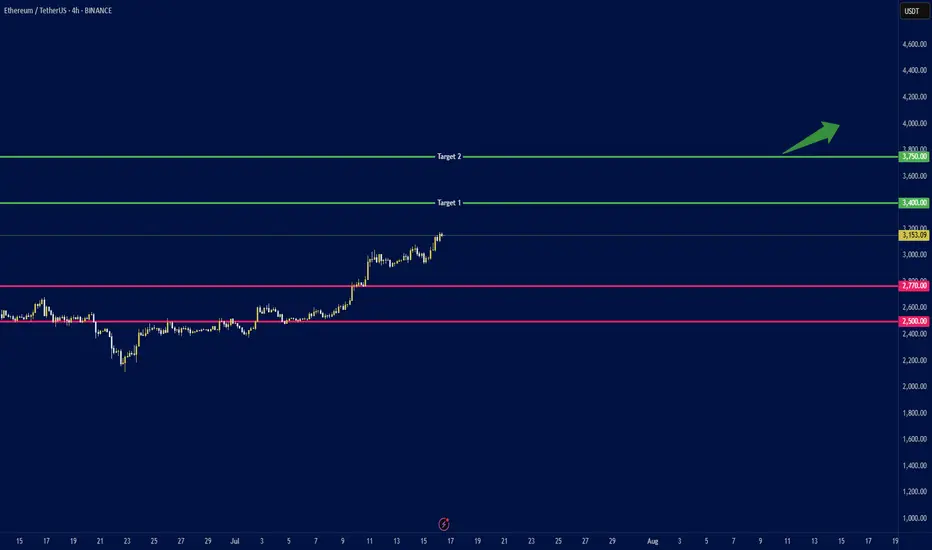
Support: $2,770 and $2,500 (major trendline and psychological level).
4.🎯 Price Targets:
Short‑term (2–4 weeks):
If ETH breaks above $3,150: next targets at $3,400 and $3,750.
Medium‑term (by end of Q3 2025):
ETH could reach $3,500 with potential upside to $4,000.
.
.
.
⚠️ Disclaimer: This analysis is for educational purposes and not financial advice. Please do your own research and risk management.
.
✅ If you like this analysis, don't forget to like 👍, follow 🧠, and share your thoughts below 💬!
ETH might just be setting up for a monster move!Something BIG is brewing with #Ethereum...
👀 And it’s being quietly triggered by a law almost no one was talking about, till today.
A new rally could be closer than you think. Here's the full story 🧵👇
Last month, the U.S. Senate passed the Genius Act — the first serious law aimed at regulating stablecoins.
Sounds boring? It's not.
Because this act could light a fire under ETH... and hardly anyone sees it coming.
Stablecoins like CRYPTOCAP:USDC will soon have clear rules to follow.
That opens the doors for banks, funds, and institutions to use them legally — and massively.
And who benefits most from that? You guessed it: Ethereum.
Ethereum hosts nearly 50% of ALL stablecoin supply.
It's the core infrastructure of the stablecoin economy.
That means:
More stablecoin adoption → More activity on ETH → More gas fees → More ETH burned.
And it doesn’t stop there.
Right now, Ethereum handles about 60% of all stablecoin transactions.
Tron is in second place… with just 15%.
This is ETH's game to lose.
Here’s where it gets juicy:
ETH gas fees = ETH getting burned.
Rising stablecoin usage doesn’t just mean more revenue for the network…
It means less ETH in circulation.
And you know what that does to price.
Oh — and the smart money knows.
Since mid-2024, ETH whales have been quietly accumulating.
Whale holdings just hit their highest level since 2021.
Last time that happened?
Right before a massive rally.
Also… Ethereum activity is already spiking on-chain.
Transaction volume is rising, fast.
The last two times we saw this setup?
🔹 2016–2017
🔹 2020–2021
ETH went on to crush ATHs both times.
Circle — the company behind USDC — just IPO’d in June.
Their stock? Skyrocketed!
The stablecoin dominoes are falling fast...
And Ethereum is sitting at the center of it all.
To sum it up:
✅ Regulatory clarity (Genius Act)
✅ Institutional greenlight for stablecoins
✅ ETH is the foundation
✅ Whales accumulating
✅ On-chain activity heating up
✅ Supply burn kicking in
The House just rejected a key vote on the GENIUS Act.
🚨 Regulatory momentum just hit a speed bump — but the charts will tell you the real story.
Pass or fail... ETH might just be setting up for a monster move.
Here’s the set up…
If ETH can secure a Weekly close above the orange major resistance and confirm a breakout above the yellow ascending trendline, we could experience LIFTOFF. 🚀
NFA... For edutainment purposes only!

Don't miss Ethereum todayHello friends
Given the good rise we had, you can see that the price has entered a correction and has provided us with a good opportunity to buy in steps, of course with capital and risk management.
*Trade safely with us*

Ethereum:Daily signalhello guys👋
According to the drop we had, you can see that buyers came in and the price had a good growth, and after that a trading range was made in which the price got stuck.
Now, considering that the price is in the trading range and it seems that the buyers have shown their support, it is possible to step into the specified support areas with risk and capital management and move up to the set goals.
🔥Follow us for more signals🔥
*Trade safely with us*

When does Bolran start?Read carefullyhello friends👋
💰Many of you are asking when Bolran will start or if it will start at all, we decided to explain it to you in a full post.
Well, you can see the Ethereum chart moving in a channel, and with a drop, it created a big fear that a fall is coming, and meanwhile, the buyers returned the price to above 2000 dollars with a strong and unexpected return.
✅️Now the price is stuck in the specified box between 2200 and 2500, and if this range is maintained, the price will easily move up to the range of 3200 in the first wave, and if it fails to maintain this range, the price will fall below 1500 dollars.
🧐Now, in our opinion, due to the rapid return of the price from the channel, this failure is a fake channel and the range will be maintained, and we are likely to see Ethereum rise in the coming weeks.
🤔You know that Ethereum is the leader of altcoins, and if it grows, important altcoins will grow, which is the beginning of Bolran, and there are important altcoins that can be used for good profit.
🌟You can join us if you like.🌟
🔥Follow us for more signals🔥
*Trade safely with us*

Ethereum Price Rejects $3K: Is A Deeper Correction Ahead?Ethereum's Precarious Perch: Price Stumbles at $3K as Long-Term Conviction and Quantum Threats Collide
The cryptocurrency community is intently watching Ethereum as the premier smart contract platform engages in a fierce battle around the psychologically crucial $3,000 mark. Following a promising surge that breached this barrier for the first time in several months, the upward momentum has stalled, giving way to a tense period of consolidation. This raises a pivotal question for investors and market observers alike: is a more significant correction on the horizon, or is this merely a strategic pause before the next major advance toward $3,200 and potentially higher valuations?
The recent price action has been a whirlwind for traders. Ethereum climbed with bullish determination, reaching heights near $3,080 before encountering substantial selling pressure that forced a retreat. This downturn has left the price hovering near the $2,940 level, trading precariously near its 100-hourly Simple Moving Average (SMA). Exacerbating the bearish sentiment, the price has broken below a key bullish trend line that had previously offered support at the $2,980 mark, a technical development that often signals the potential for further declines.
This short-term market turbulence, however, unfolds within a much broader and more intricate narrative. While hourly charts may be flashing warning signs, an analysis of long-term on-chain data reveals a story of strengthening fundamentals, underscored by a record amount of Ethereum being locked away by confident, long-term holders. In parallel, the Ethereum developer community, with co-founder Vitalik Buterin at the forefront, is proactively strategizing for a distant yet potentially existential threat: the "Quantum Apocalypse." This unique convergence of immediate bearish technical indicators, profound long-term bullish sentiment, and forward-thinking security planning creates a fascinating and unpredictable landscape for the pioneering blockchain platform.
The Short-Term Tug-of-War: A Correction Towards $2,900 or a Rally to $3,200?
In the immediate term, the market is a battlefield of competing forces. The inability to sustain a position above the $3,000 level has emboldened sellers, and key technical indicators are suggesting a cautious approach. The hourly MACD (Moving Average Convergence Divergence) is indicating a loss of momentum within the bullish zone, while the RSI (Relative Strength Index) has fallen below the 50 mark, suggesting that selling pressure could be gaining the upper hand.
Market analysts are now laser-focused on the $2,900 zone, viewing it as the primary line of defense for the bulls. If this support level can withstand the selling pressure, it could provide the necessary foundation for a fresh increase, enabling Ethereum to reclaim its lost ground and launch another attempt to conquer the $3,000 resistance. Conversely, a decisive break below this critical support could initiate a more substantial correction. In such a scenario, subsequent support targets would likely be found near $2,800, with the potential for further drops to the $2,720 or even $2,650 price points.
A particularly compelling theory circulating among analysts involves the concept of a "liquidity sweep." On-chain data indicates a significant concentration of liquidity—essentially, a large cluster of buy orders and stop-loss orders—residing just below the $2,900 level. Market dynamics frequently see price action gravitate toward these zones to trigger liquidations, effectively shaking out over-leveraged traders before a more sustained move in the opposite direction. Consequently, a brief dip below $2,900 to "grab" this liquidity would not be an unexpected development. Paradoxically, such a move could be the very catalyst required to fuel a durable rally toward the next major target: the $3,200 supply zone. This level is widely regarded as the next significant hurdle, a price ceiling where a large volume of sell orders is anticipated to be waiting.
The volatility surrounding key psychological levels like $3,000 is notoriously difficult to predict, as human emotions of fear and greed often drive exaggerated market reactions. For the time being, the short-term outlook remains uncertain, heavily contingent on whether the crucial $2,900 support can absorb the selling pressure or if a flush-out of liquidity is needed before the bulls can confidently reassert control.
The Bullish Undercurrent: Smart Money's Long Game and a Shrinking Supply
Looking beyond the volatile daily price charts reveals a powerful undercurrent of bullish conviction. A key metric that speaks volumes about long-term investor sentiment is the quantity of Ethereum locked in staking contracts, which has recently soared to a new all-time high.
Recent on-chain data indicates that nearly 30% of Ethereum's total supply is now staked on the network. As of mid-2025, more than 35 million ETH have been committed to validator nodes, a process that helps secure the network while allowing stakers to earn passive income. This trend, which has seen a notable acceleration in recent months, serves as a powerful indicator of long-term confidence. When investors, particularly large holders often referred to as "whales," stake their ETH, they are effectively removing it from the liquid, tradable supply. This reduction in available supply, frequently described as a "supply shock," means that any future increase in demand can have a more pronounced positive effect on the asset's price.
This staking activity is widely interpreted as "smart money" placing a long-term bet on Ethereum's continued growth and success. These are not day traders reacting to minor price swings but rather institutional investors and seasoned crypto participants who are focused on the bigger picture. Their actions signal a deep-seated belief that the intrinsic value of the Ethereum network—as the foundational layer for decentralized finance (DeFi), non-fungible tokens (NFTs), and a vast ecosystem of other applications—will continue to appreciate over time. This accumulation is not limited to staking; the number of wallets with no history of selling has also reached a record high, collectively holding over 22.8 million ETH.
This expanding pool of illiquid supply, driven by a firm belief in Ethereum's fundamental value proposition and its future roadmap, provides a strong counter-narrative to the short-term bearish technicals. It suggests that while the price may experience turbulence in the near term, a substantial and growing cohort of investors is prepared to hold through the volatility, thereby creating a solid foundation for future price appreciation.
The Existential Question: Can Ethereum Outsmart a Quantum Apocalypse?
While traders and short-term investors grapple with hourly charts and staking metrics, Ethereum's core developers are concentrating on a threat that is far more distant but infinitely more profound: the advent of quantum computing. The "Quantum Apocalypse" is a term used to describe the hypothetical future event—often called "Q-Day"—when a quantum computer becomes powerful enough to break the cryptographic algorithms that secure virtually all of our modern digital infrastructure. This includes blockchain networks like Ethereum and Bitcoin.
Such a powerful machine could, in theory, reverse-engineer a user's private key from their public key, which would grant an attacker complete and unfettered control over their digital assets. For a multi-billion dollar ecosystem built on the unwavering promise of cryptographic security, this represents an existential threat of the highest order.
However, the leadership within the Ethereum ecosystem, including co-founder Vitalik Buterin and the Ethereum Foundation, is not idly waiting for this threat to materialize. They are actively and transparently working to make the network quantum-resistant. Buterin has publicly addressed the issue, noting that prediction markets currently forecast the arrival of a cryptographically relevant quantum computer sometime between 2030 and 2035. This timeline provides a crucial window for the network to transition its security protocols to a more robust standard.
The strategy to neutralize this threat is multifaceted and is a core component of Ethereum's long-term development roadmap. Key initiatives include:
• Post-Quantum Cryptography: Researchers are diligently developing and testing new types of signature schemes that are designed to be resistant to attacks from both classical and quantum computers. Two of the most promising approaches are STARKs (Scalable Transparent Arguments of Knowledge) and lattice-based cryptography. STARKs, for instance, would allow users to prove ownership of their assets without ever exposing their private keys.
• The "Lean Ethereum" Roadmap: Buterin and fellow researcher Justin Drake have put forth a vision for a "Lean Ethereum" that aims to simplify the blockchain's base layer. This simplification would not only make the protocol easier to audit and secure but would also facilitate the integration of post-quantum-ready signatures and other advanced defensive measures.
• Emergency Hard Forks: In a worst-case scenario where a quantum threat emerges much sooner than anticipated, Buterin has suggested that an emergency hard fork could be deployed as a final line of defense. This would involve a network-wide upgrade where all users would be required to migrate their funds to new, quantum-resistant "smart" wallets, thereby rendering the old, vulnerable accounts obsolete.
Buterin remains cautiously optimistic about the network's ability to navigate this challenge. The proactive stance, the commitment to public and transparent research, and the multi-layered defense strategy all demonstrate a deep commitment to ensuring Ethereum's security for decades to come. This effort aims to transform a potential apocalypse into a manageable, albeit complex, technological evolution.
Conclusion: A Market at a Crossroads
Ethereum currently stands at a fascinating crossroads, a point where short-term technical uncertainty is juxtaposed with immense long-term fundamental strength and remarkable foresight. The immediate price action is a toss-up, delicately balanced on the crucial $2,900 support level. A sustained dip below this line could send prices into a corrective wave toward $2,800 or lower, possibly to sweep liquidity before a stronger and more convincing rebound. Conversely, if this support holds firm, it could empower the bulls to decisively conquer the $3,000 barrier and set their sights on the formidable $3,200 resistance zone.
When one zooms out from the daily noise, the picture becomes clearer and decidedly more bullish. The record-breaking amount of ETH locked in staking contracts paints a portrait of unwavering long-term conviction from sophisticated investors who are systematically reducing the available supply while simultaneously strengthening the network's security. This patient accumulation provides a powerful buffer against short-term market panic.
Looking even further into the future, Ethereum's leadership is already waging a quiet war against the quantum threat, meticulously laying the groundwork for a post-quantum world. This long-range planning, while not a direct factor in today's price movements, underpins the network's potential for longevity and resilience.
For the investor, the current dilemma—a rally to $3,200 or a pullback first?—is largely a matter of time horizon. The path of least resistance in the coming days and weeks remains ambiguous, clouded by liquidation levels and psychological barriers. But for those with a longer view, the on-chain data and the forward-thinking roadmap strongly suggest that Ethereum is not just building for the next bull run, but for the next generation of the internet. The current price turbulence, while unsettling, may ultimately be remembered as a minor tremor before a much more significant structural shift in value.
ETH-----Buy around 3000, target 3070 areaTechnical analysis of ETH contract on July 14:
Today, the large-cycle daily level closed with a small positive line yesterday, the K-line pattern continued to rise, the price was above the moving average, and the attached indicator was running in a golden cross. The general trend of rising was relatively obvious, but it was not as strong as the big cake. The previous historical high was in the 4877 area in November 2021, so in this way, the later rise may be more fierce than the big cake; the short-cycle hourly chart intraday starting point is in the 2970 area, and the current K-line pattern shows a trend of continuous negative retracement. The attached indicator is running in a golden cross, but the general trend is still strong. The four-hour chart retracement moving average support is in the 3000 area.
Today's ETH short-term contract trading strategy:
Purchase in the 3000 area, stop loss in the 2970 area, and target the 3070 area;

"Ethereum Is The New Bitcoin" - Tom Lee ETH / Stablecoins Are the ChatGPT of Crypto
Stablecoins are exploding in adoption — just like ChatGPT took over AI and Ethereum is the engine driving that revolution. In this post, we break down 10 reasons why Tom Lee is extremely bullish on Ethereum and why it could be the single most important digital asset in the future of finance . If you're sleeping on ETH, this might be your wake-up call.
Top 10 Bullish Points from Tom Lee on Ethereum:
• Ethereum is the backbone of stablecoins , which Tom Lee compares to the “ChatGPT of crypto” due to their viral adoption and massive utility.
• Over 51% of all stablecoins operate on Ethereum , contributing to around 30% of the network’s total fees.
• Ethereum network fees could 10x as stablecoin usage grows from $250 billion to $2 trillion.
• Ethereum is positioned to lead the tokenization of real-world assets , including stocks and real estate.
• ETH could reach $10,000 if asset tokenization becomes a mainstream financial practice.
• Ethereum has a regulatory edge in the U.S. , making it the preferred platform for compliant financial innovation.
• A $250 million ETH treasury strategy is underway , aiming to use Ethereum as a long-term reserve asset.
• Institutions will buy and stake ETH to secure stablecoin networks, making ETH the “next Bitcoin.”
• Ethereum dominates the crypto ecosystem , with nearly 60% of activity including DeFi, NFTs, and dApps built on its chain.
• HODL ETH for long-term growth , as its utility, demand, and institutional support continue to rise.
Conclusion:
Ethereum isn’t just a Layer 1 blockchain — it’s becoming the core financial infrastructure for the digital age . As stablecoins expand and institutions enter, ETH could be the most asymmetric opportunity in crypto right now.
📢 Drop a like, leave your thoughts in the comments, and don’t forget to follow for more powerful macro + crypto insights. 👍👍

ethusd to 70 000 or 700 and 70 in two Months we seeEthereum in parallel channel and huge bull flag. if in next two months it will break out of the 4000 could go to 75000.
If not will range in channel till 700 and breaking down would mean even 70 and lower

ETHEREUM - ETH Weekly Recap & Projection 13.07.2025Current Structure
Ethereum is showing a clear bullish bias.
Last week’s price action broke above a significant weekly swing level with solid candle closures — suggesting continuation.
Short-Term Scenarios
We could see two potential outcomes:
• A consolidation range forming at current levels
• A short-term retracement influenced by Bitcoin’s movement
Due to ETH’s high correlation with BTC, traders should review Bitcoin’s chart to understand ETH’s likely path.
Trading Plan
Wait for Bitcoin to complete a retracement
Monitor ETH for LTF (lower timeframe) confirmation and bounce
Seek long setups below the CME Gap (pink line)
Step 2 will serve as the trigger to initiate any positions on ETH.
Macro Risk-On Catalyst – Powell Resignation?
There are growing rumors regarding Federal Reserve Chairman Jerome Powell potentially resigning.
If confirmed, this could result in a strong rally across risk assets, including ETH — likely pushing prices higher without traditional pullbacks.
Summary
• ETH broke major weekly structure
• Watch BTC for clues — correlation remains high
• Plan favors long entries after BTC retrace + ETH LTF confirmation
• Powell resignation rumors could accelerate bullish trend

ETH / USDC Liquidity Pool RangeEthereum is climbing alongside Bitcoin, but it’s clearly outperforming. In many ways, ETH is the Microsoft of the crypto space—serving as a foundational platform on which countless networks and tokens are built, much like Windows supports a broad software ecosystem. In contrast to Bitcoin’s role as a digital currency, Ethereum functions more like a software operating system.
We broke out of the previous range for strong profits. The new range is tighter, with the lower boundary set just above the current ETH spot price at $2,995.91 and the upper boundary at $3,340.90, as marked by the horizontal yellow lines. On the 3-hour chart, momentum is beginning to turn upward. To enter the liquidity pool within this range, we must be fully allocated in ETH.

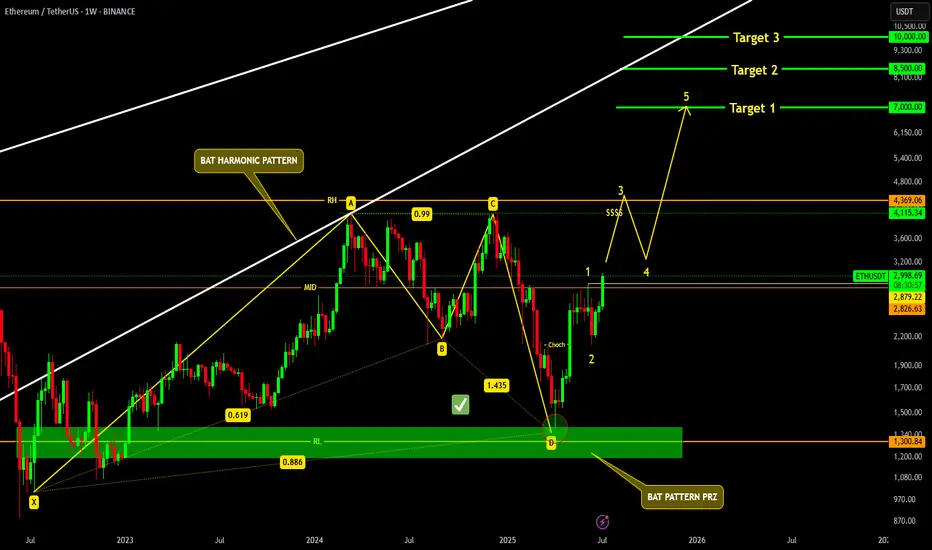
ETHEREUM READY TO SMASH 10K !!!AS per previous Ethereum update, CRYPTOCAP:ETH successfully tapped our Bat PRZ and making it's way to the top.
as per micro elliott wave count, we will see Ethereum slamming 7k, and could potentially smash 10k in coming months.
Ethereum Idea and Buying Plan⚪️ CRYPTOCAP:ETH
We mentioned earlier that our goal is 3290 - 3473 which is the gap formed in CME contracts
⭕️ Currently, for speculative thinking or looking to enter the support range after all this rise is between 2789.57 to 2685.87
🚨 The important thing is to stay above 2326 to support the continuation of the rise strongly
🔼 The key to the rise will be maintaining movement above 3000 on the 4h and 1d frames
📄 The closest targets for this model, upon meeting the conditions, are 3356 reaching the range of 3567 - 3857
