Analysis of BTC/USDT Weekly ChartThis analysis examines both the short-term and long-term trends for Bitcoin (BTC) against Tether (USDT) using the weekly chart.
Short-Term Trend:
Based on the current bearish sentiment, I believe there's a high possibility of BTC experiencing a further drop in the short term.
A potential support level could be found around the intersection of the 21-week EMA (Exponential Moving Average) and the 38.20% Fibonacci retracement level (highlighted by the yellow circle on the chart).
Long-Term Trend:
Despite the short-term weakness, the overall trend remains bearish on the weekly timeframe. This is evidenced by the price being below major moving averages (10-week, 20-week, etc.) and the bearish Ichimoku Cloud... BUT
Potential Long-Term Opportunity:
If BTC finds support at the mentioned confluence zone (21-week EMA and 38.20% Fibonacci level), a potential long-term buying opportunity might emerge.
In this scenario, the price could target a range between $80,000 minimum and potentially reach $100,000 initially, marking the completion of the third bullish wave.
Additional Considerations:
This analysis is based on technical indicators and should be combined with other factors like fundamental news and on-chain metrics for a more comprehensive understanding.
Market conditions are dynamic, and these targets and support levels are estimates. Always practice proper risk management when trading.
This version clarifies my analysis and it's just a possibility and not financial advice.
Ethreum

ETHUSDPair : ETHUSD ( Ethereum / U.S Dollar )
Description :
Completed " 12345 " Impulsive Waves
RSI - Divergence
Break of Structure and Retracement
Impulse Correction
Fibonacci Level - 23.80%

Ethereum's Uphill Battle: Can Bulls Reclaim Lost Ground?
Ethereum (ETH), the world's second-largest cryptocurrency by market capitalization, recently experienced a rollercoaster ride, briefly surging above $3,300 before encountering a sharp decline. This price action has left many investors wondering: can the bulls regain control and propel ETH back towards its previous highs?
A Short-Lived Rally Followed by a Relentless Downturn
The initial rally saw ETH break past the $3,300 barrier, a level that had previously acted as resistance. This positive momentum fueled optimism amongst bulls, who anticipated a potential continuation of the uptrend. However, their hopes were dashed as the bears re-emerged, triggering a swift reversal.
The price plunged below not only the $3,300 mark but also the 100-hourly Simple Moving Average (SMA), a technical indicator often used to gauge momentum. This breach suggests a potential shift in market sentiment, with sellers regaining dominance.
Technical Indicators Paint a Bleak Picture
Adding to the bearish concerns is the break below a crucial bullish trend line on the hourly chart. This trend line had previously provided support for ETH's price, and its violation indicates a potential weakening in the uptrend.
Furthermore, if ETH fails to hold the current support level around $3,165, the decline could continue downwards. This additional technical hurdle creates a significant obstacle for the bulls as they attempt to reverse the recent downtrend.
Where Do We Go From Here?
The near-term future of Ethereum remains shrouded in uncertainty. Several factors will influence its price trajectory in the coming days and weeks.
1. Market Sentiment: The overall sentiment in the cryptocurrency market plays a significant role in determining individual coin prices. If broader market sentiment remains bearish, it will likely put further downward pressure on ETH. Conversely, a shift towards optimism could trigger a renewed buying spree, propelling ETH upwards.
2. Bitcoin's Influence: As the leading cryptocurrency, Bitcoin (BTC) often exerts a strong influence on the price movements of other digital assets, including ETH. If BTC experiences a significant price swing, it can have a ripple effect on ETH, potentially amplifying its own price movements.
3. News and Events: Upcoming events or major news announcements related to the Ethereum ecosystem can also impact its price. For instance, successful protocol upgrades or positive developments within the decentralized finance (DeFi) space built on Ethereum could boost investor confidence and drive prices higher.
Can the Bulls Stage a Comeback?
While the current technical indicators suggest a bearish outlook, it's too early to write off the Ethereum bulls entirely. Here are some reasons why they might still mount a successful comeback:
1. Strong Underlying Fundamentals: The Ethereum network continues to see steady growth in terms of user activity, transaction volume, and the number of decentralized applications (dApps) being built on its platform. These strong fundamentals could provide long-term support for ETH's price, even amidst short-term volatility.
2. Potential for Renewed Investor Interest: Despite the recent pullback, Ethereum remains a highly attractive asset for many investors due to its established position within the blockchain industry and its potential for future growth. Renewed buying pressure from institutional investors or retail traders could spark a price reversal.
3. The Merge: The highly anticipated Ethereum Merge, which will transition the network from a Proof-of-Work (PoW) to a Proof-of-Stake (PoS) consensus mechanism, could be a significant catalyst for price growth. The increased efficiency and scalability promised by the Merge could attract more users and developers to the Ethereum ecosystem, boosting its overall value proposition.
Conclusion: A Careful Balancing Act
The battle for Ethereum's price is far from over. While the bulls face an uphill battle in the short term, the long-term outlook for ETH remains promising. Investors should closely monitor technical indicators, market sentiment, and upcoming events within the Ethereum ecosystem to make informed decisions. As with any investment in the volatile cryptocurrency market, a cautious and well-researched approach is crucial.

Ethereum currency analysis update#Update analysis result #Analysis of Ethereum Time 1D currency
As expected, the price has entered an upward trend from the specified level and has seen a spot price growth of about 15%, and I hope you have taken advantage of this upward trend.
Currently, the price is reaching its dynamic resistance level, and if this area breaks, we can still expect the upward trend to continue.

ETHBTC Very Bullish Falling Wedge FakeoutAfter a very ullish run on the ETHBTC pair from 2019 - 2021, ETH has spent nearly the last 3 years consolidating into a falling wedge pattern. This has formed an even bigger Bullish pennant pattern. With a breakout of the falling wedge we'd have about a 13-% gain to the upside.
Locally, price has formed a triple bottom, and formed a Fakeout from the low of the falling wedge. Price has responded with a strong reaction to the upside. With the BTC halving just being finished and the ETH ETF on the way, it is about time for ETH to make its run.

ETHUSDPair : ETHUSD ( Ethereum / U.S Dollar )
Description :
Falling Wedge as an Corrective Pattern in Short Time Frame
Break of Structure
RSI - Divergence
Completed Impulse and Correction " ABC "
Fibonacci Level - 50.00%

Ethereum - Forming A Base Like So Many Times Before ?#ETH
Ethereum is forming higher lows and a higher high while bouncing off support ATM
This bottoming structure has been formed similarly many times in this pair.
All while sentiment is a like a funeral procession & ETH ETFs are loading in the background
Probably Nothing...

📈 Ethereum Market Analysis: Navigating the Range Box🔍Let's dive into today's market analysis! Overall, the market is still range-bound, but there has been a minor downward correction since yesterday. It seems like we're experiencing a correction of that minor dip today, but in reality, all these movements are happening within a range box, and they don't hold much significance in determining the long-term trend. Ethereum (ETH) was an exception yesterday, briefly dipping downwards before re-entering its short-term range box.
🔄If we look at it from a scalping perspective, Ethereum is currently within a range box from $3111 to $3167. However, this box is quite small and is more meaningful in the 1-hour timeframe rather than the 4-hour one we're analyzing. In the 4-hour timeframe, the price is within a larger box from $2899 to $3283, and we don't have a clear trend to rely on for trading. So, until a trend emerges, we're forced to reduce our targets and not expect sharp, dramatic price movements. If you're comfortable with short-term trading and not seeking high risk-to-reward ratios, you can trade within this range. But if you're only comfortable with high risk-to-reward ratios, I suggest you wait until the daily box is broken for a sharp move.
📈For a long position, if you're a scalper and can control yourself in lower timeframes without getting too excited, you can enter a long position after breaking $3167. However, be mindful that, as I mentioned, you shouldn't expect high risk-to-reward ratios. The confirmation for this area would be the midline of the RSI, or 50, coinciding with the break of $3167. However, keep in mind that currently, the SMA25 is above the candlesticks, and the ideal scenario for this position is for the SMA25 to be broken and for the price, when breaking $3167, to play the role of support rather than resistance and cause the price to rise. The area where the price dipped is also the Point of Control (POC) of the fixed range volume profile, which is another confirmation that the price has strong support. For a more confident long position, wait for the price to reach $3283 and see its reaction.
🎯If the market experiences a decline, our first trigger is $3111, but the point to note here is that just below this area, we have the POC, which is a very important area and may prevent the price from coming down easily and hitting the target, maintaining momentum. So, I recommend waiting for the price to reach the support range we had previously and, based on its reaction, finding its trigger. Lastly, keep in mind that today is Sunday, and the volume is very low. Overall, because we're inside a range box, traders are trading less, resulting in low market volume. So, if I were you, I'd reduce my risk a little to avoid losing the profits I've made in these days.
🧠💼It's important to acknowledge the inherent risks in futures trading, with the potential for margin calls if risk management is neglected. Always adhere to strict capital management principles and utilize stop-loss orders, ensuring that the initial target offers a risk-to-reward ratio of 2

ETH analyse monthly time frameHello friends,
In the ETH chart as you can see here.
The price in a strong fresh zone for buying.
But we need this false breakout to be confirmed.
If this monthly candle close above this zone, we will have the chance to see ETH fly.
If not will see it in the support below.
Hope you understand what I'm going to say.
Focus on price action.
See you next time

Elliott's Wave analysis at Ethereum ETH priceToday's wave analysis based on #ETHUSDT
The only open question, at least for us, is whether the A-B-C correction within the 4th wave has already been completed or not.
↗️ If it has, then buyers should not allow the price of CRYPTOCAP:ETH to fall below $2925 and, accordingly, continue to grow according to the blue scenario.
↘️ If it hasn't ended yet, then market players are still waiting for an impulsive drop in the #ETHUSD price to the $2525 area. After that, the price may recover according to the white scenario.
Which scenario do you prefer, which do you believe in more?

ETH Following BTC?This setup is pretty similar to the one on BTC. I see a possible reversal pattern on smaller timeframe and here we have two resistance trendline to break in order to flip long. $3100 is a support level that must hold to validate this idea

ETH: buy in support📊Analysis by AhmadArz:
🔍Entry: 3131.74
🛑Stop Loss: 3109.12
🎯Take Profit: 3152 -3180 -3214 -3235
🔗"Uncover new opportunities in the world of cryptocurrencies with AhmadArz.
💡Join us on TradingView and expand your investment knowledge with our five years of experience in financial markets."
🚀Please boost and💬 comment to share your thoughts with us!

Ethereum Eyes $3,600 Resistance as Bullish Signals EmergeEthereum, the world's second-largest cryptocurrency by market capitalization, is exhibiting signs of a potential breakout after a period of consolidation. Recent technical indicators, including a Simple Moving Average (SMA) crossover and price action hovering near a resistance level, suggest a bullish outlook for Ether (ETH).
Breaking Down the Bullish Signals:
• SMA Crossover: A Simple Moving Average (SMA) is a technical indicator used to gauge an asset's price trend. A recent crossover has occurred where the short-term SMA (often the 50-day) has crossed above the long-term SMA (often the 200-day). This crossover historically signifies a shift in momentum towards an uptrend. In Ethereum's case, the recent crossover suggests a potential break above resistance levels and sustained price increases.
• Price Consolidation Around $3,600: Following a volatile period, Ethereum's price has been consolidating around the $3,600 mark. This consolidation phase indicates a period of indecision between buyers and sellers. However, if the price manages to break decisively above this resistance level, it could signal a continuation of the uptrend.
• Underlying Demand: Despite the recent market volatility, there appears to be underlying demand for Ethereum. The ongoing development of the Ethereum ecosystem, including the highly anticipated shift to a Proof-of-Stake consensus mechanism, is attracting investor interest. This could provide long-term support for ETH prices.
Potential Roadblocks:
While the technical indicators are encouraging, some factors could impede Ethereum's upward trajectory:
• Macroeconomic Uncertainty: The broader macroeconomic environment remains a source of concern for investors. Rising inflation and potential interest rate hikes by the US Federal Reserve could dampen risk appetite, impacting cryptocurrency prices, including Ethereum.
• Regulatory Landscape: Regulatory uncertainty surrounding cryptocurrencies persists. Increased government oversight could potentially stifle innovation and adoption within the Ethereum ecosystem, impacting its long-term growth prospects.
• Competition: The cryptocurrency market is a highly competitive landscape. The emergence of new blockchain platforms vying for market share could pose a challenge to Ethereum's dominance.
The Path Forward
The success of Ethereum's potential breakout hinges on several factors. Overcoming the $3,600 resistance level and maintaining momentum above it will be crucial. Additionally, positive developments within the Ethereum ecosystem, coupled with a favorable macroeconomic environment, could further fuel the rally.
Investors should closely monitor the following:
• Price Action: Sustained price movement above the $3,600 resistance level is a key indicator to watch.
• Trading Volume: Increasing trading volume alongside a rising price suggests strong buying pressure.
• Regulatory Developments: Any regulatory clarity or positive pronouncements could boost investor confidence.
Conclusion
Ethereum's recent technical indicators and price action paint a cautiously optimistic picture. The SMA crossover and price consolidation near $3,600 suggest a potential breakout. However, navigating the broader market uncertainties and overcoming competition will be essential for Ethereum to sustain its upward trajectory. Investors should conduct thorough research and maintain a risk-tolerant approach before entering the cryptocurrency market.

ETH: 3.000 is important zone📊Analysis by AhmadArz:
🔍Entry: 3080
🛑Stop Loss: 3185
🎯Take Profit: 2986 -2859 -2736 -2622
🔗"Uncover new opportunities in the world of cryptocurrencies with AhmadArz.
💡Join us on TradingView and expand your investment knowledge with our five years of experience in financial markets."
🚀Please boost and💬 comment to share your thoughts with us!

Just a re-test of an H/S invertedZoom out on COINBASE:ETHBTC to reveal an H/S inverted that hasn't yet hit TP 1 or 2 and is re-testing its breakout.
For a more conservative set of targets (purple), it consolidated around TP 1 and is now re-testing its neckline.
Conditions for success: remain above the yellow and/or purple necklines.

ETHEREUM UPDATES We go higher and breaks the previous ATH.
This idea base on 2 fibs on retracements. if the previous buyers would buy this zone.
Im expecting 5600$ per CRYPTOCAP:ETH on this run.
This is not a financial advice.
Follow for more.
Long term makes you weird. long view makes you stronger.
Stay salty my crypto friends.
See it for yourself this year.

ETH Long ideaI am bullish as long as eth stays above the last bottom level 3055, the first target zone 3400 second target zone 3735. Good Luck. No Fear.

ETHUSD 12HETH ~ 12H 📈
#ETH Make purchases gradually within this pattern zone, with a target of at least 10%+

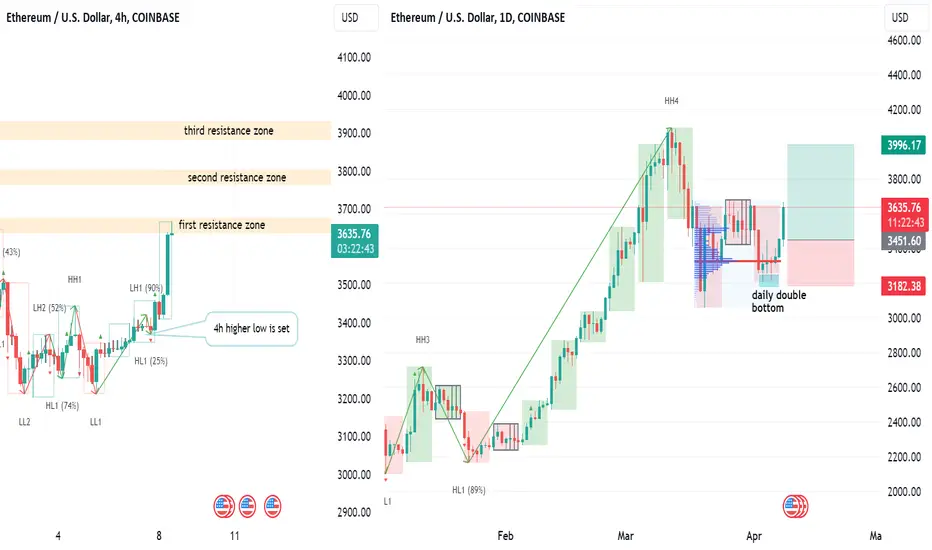
ETH is shaping weekly higher lowEthereum is trying to set weekly higher low (we're still in a weekly uptrend, setting weekly higher low is strong signal of trend continuation).
It failed one time (last week of March) but now it has better chance of accomplishing it. While it opens opportunity for a LONG play we should recognize that there was quite aggressive selling in the middle of March. Bears might be still waiting at certain levels (marked on the chart). So, entering trade at this moment doesn't provide good P/L ratio. It would be better to wait for some sort of retest (e.g. lower value area, near current week low) to enter. Consider partial profit taking at resistance zones.
Example of the trade is shown on the chart.
Disclaimer
I don't give trading or investing advice, just sharing my thoughts.
$ETH-Long IdeaEthereum broke through the swing high. Expecting a follow through in the price. Will be looking to take longs/buy at the marked bullish zones. A break below the swing low would invalidate the trade.

ETH: buy in liquidity zone📊Analysis by AhmadArz:
🔍Entry: 3500
🛑Stop Loss: 3325
🎯Take Profit: 3659-3885-3975
🔗"Uncover new opportunities in the world of cryptocurrencies with AhmadArz.
💡Join us on TradingView and expand your investment knowledge with our five years of experience in financial markets."
🚀Please boost and💬 comment to share your thoughts with us!

ETH Waiting for a breakEthereum is preparing a new pump. I am waiting a break above the yellow trendline before taking any action. I would like to see a little accumulation with a range above the trendline before entering in a long trade. My targets would be the resistance area at $3.600 first and $3.900 next

