Ethereum stuck in resistanceEthereum has broken the trendline, but is stuck to broke the resistance zone also. ETH price could chop for a while in this range till it decides to broke up (or down)
Ethreum

ETH as Whale Traders Inject $124B – An Exciting Opportunity!The recent surge in ETH has been nothing short of remarkable, and it's all thanks to mighty whale traders injecting a staggering $124 billion into the Ethereum network!
The trends are clear, and the time is now to seize this opportunity and make ETH your go-to choice for long-term investments. By joining the ranks of successful traders who are capitalizing on this extraordinary development, you too can ride the upward momentum of ETH and potentially secure substantial profits for yourself.
Are you ready to be part of this revolution? Take action today and make a smart move towards long ETH positions. Don't miss out on the chance to grow your crypto portfolio and be at the forefront of a digital revolution reshaping the financial world as we know it.
To get started, carefully analyze the current market conditions, stay updated with the latest industry news, and consider consulting with trusted investment advisors. Remember, every investment holds its own risks, so exercise prudence, conduct thorough research, and set realistic expectations. By utilizing the available resources, you can stay ahead of the game and maximize your potential gains.
Embrace this thrilling opportunity and embark on a remarkable journey towards financial success. Together, we can ride the wave of ETH's unstoppable ascent and achieve incredible results.
www.newsbtc.com

ETHUSD reach support levelwe have perfect setup for bearish at previous analysis,
right now, support almost reach.
trading plan is simple, buy right now or wait at support around $1,944 and set target at triangle resistance.
I will monitoring and update this analysis if I found some key level.
don't forget to support,
If you have any question, do not hesitate to contact me
Your support at this analysis will also support ETHUSD to reach bullish target
Click here to check my other analysis

ETHUSDT--------TO THE 2500$$$$$$$$$$$$$$$$$$$$$$$$$$$Ethereum is involved in a downward trend.
The most important resistance we are involved in is the $2130-$2150 range.
If they pass this price, altcoins will start to grow well.

ETHUSDT Falling Wedge LONGExcuse me!
In my bold opinion, this is a pre-eruption/in-progress moment.
According to Fibonacci numbers, the target zone could be the $2100 level.
If my analysis is correct, the exchange rate may reach this level.
R3ncso

is $ETHBTC gonna make a double bottom?Ethereum BITSTAMP:ETHBTC is ready for another leg up and i think could make a double bottom patterns, and if it happens, Ethereum is most likely to out perform Bitcoin, which means alts season is about to begin.
this not a financial advice, please do your own research.

Ethereum Price Struggles to Maintain $1,935 Support LevelThe price of Ethereum (ETH) is at risk of losing a crucial support level at $1,935, marking the midpoint of the supply zone that has become a breaking point for the extended bullish trend ranging from $1,864 to $2,004. If the $1,935 level fails to hold firm, it could spell disaster for token holders, with ETH potentially sliding down to the psychological level of $1,800 or, in severe cases, rendering the bullish argument ineffective below $1,753.
Both the RSI and AO indicators support this outlook, trending southward as momentum continues to weaken. On the flip side, increasing buying pressure is substantial enough to demonstrate Ethereum's ability to overcome the supply barrier mentioned above at $2,009, fostering optimism and potentially propelling ETH back onto the upward trend. This could result in a price increase to $2,136, representing a 10% gain from the current level.

ETHUSD almost at resistanceETHUSD still at symmetrical triangle pattern.
If we look at previous lower high, it touch with a long shadow , so in this wave maybe $2,038 is the new lower high.
pullback from this position at fibonacci support or at triangle support around $1,957
maximum high for this wave at $2,074
Don't forget to support this analysis, Thanks.

Ethereum Price Signals Potential 60% Surge Ethereum is showing signs of a significant breakout, forming an ascending triangle pattern with three higher lows and three nearly equal highs since June 2022. A decisive weekly close above the $2,000 horizontal resistance could trigger a 43% surge to $2,943.
Currently, Ethereum is holding above the support of the Momentum Reversal Indicator (MRI) at $1,936, indicating potential strength. If Bitcoin's price remains stable, Ethereum is expected to rally towards $2,943, facing resistance at $2,539.
While the target is theoretically $2,943, Ethereum could surpass this and reach $3,186, implying a 60% increase. Conversely, a failure to maintain support above $1,936 may lead to a correction towards $1,795. A weekly close below $1,547 would invalidate the bullish scenario, potentially pushing Ethereum down to $1,309.

ETHUSDT Ascending Triangle Pattern!!ETHUSDT (1h Chart) Technical analysis
ETHUSDT (1h Chart) Currently trading at $1973
Buy level: Above $1970
Stop loss: Below $1941
TP1: $1990
TP2: $2030
TP3: $2075
TP4: $2140
Max Leverage 10x
Always keep Stop loss
Follow Our Tradingview Account for More Technical Analysis Updates, | Like, Share and Comment Your thoughts

ENS ABOUT TO DO IT????I think with global adoption and previous work done(FIRST MOVER) we will see this project take new highs. Maybe now, maybe 2025, maybe 2028 WTF knows.
Bull run incoming?
Have you created your own profile?
What do you think of ENS?
NOT FINANCIAL ADVICE!!!

ETH ANALYSISHello friends,
Early we saw huge movement from Crypto Market, Especially BTC and ETH.
I believe sooner or later price will come back to these zones I draw on the chart. As you can see, these zones are the place where buyers push the price up. So, I expect the price go UP when it meets these zones.
P.S: Always Do your ANALYSIS.

Road to $2529 part 3after reach triangle resistance, ETH pullback with strong bearish candle, and reach fibonacci support now at $1994.7
Target from this support at triangle resistance around $2082
This analysis are continuation from my previous analysis you can check here :
part 1
part 2
I will update more especially at important key level.
don't forget to like this analysis.
Many thanks.

AVAX vs ETHWe're near the lowest bound of the range of AVAX plotted against ETH. I think Avalanche will return to at least the highs of the range (and I feel very confident that we will move beyond the highs), which simply means for me that however long I am ETH I believe AVAX will do 5X better.
I think ETH could see at least a 5X of its own over the next couple of years and therefore I'd expect AVAX to put in at least a 25X from here.

Overview of the ETH (global picture)Until October 23 , the picture was bearish, which motivated people to open short positions. At the moment, I expect growth to 2200-2400-2600 (which will be a bull trap in the classical sense). So far, the majority does not believe in such growth. Plus, they are catching up with positive news (when the price comes out, I expect even more good news). As a buyer, I am not very happy with positive news (look at the history)

"Ethereum Maintains Strong Position Above $1,935 Support Level" Ethereum's price maintains its position above the crucial $1,935 support level, which could spell doom for ETH if breached. With the RSI tilting upwards and AO staying in the positive zone, ETH may extend its upward trajectory, recovering above the $2,029 support to follow the upward trend. This could propel the second-largest cryptocurrency by market capitalization to reach its highest point at $2,136. However, in the face of increased selling pressure, Ethereum's price might dip below the $1,935 support. A decisive move below this level would confirm a downtrend, with ETH potentially testing the 25-day or 50-day EMA at $1,892 and $1,806, respectively.
In a more bearish scenario, Ethereum's price could target the 100-day EMA at $1,763, and breaking and closing below this level would invalidate the bullish argument below the $1,753 support.
Read also: Ethereum Price Prediction: Ascending Triangle Pattern Evaluates $4,000 Target for ETH in 18 Months.

ETHUSD Road to $2529 part 2last night Ethereum drop to fibonacci 0.618 support at $1961
with this price action, bullish continue and perform a new fibonacci pattern with a new symetrical triangle.
Opening a long position at symetrical triangle support have 3 target :
1. $2101 at symetrical triangle resistance (intraday setup)
2. $2252 at fibonacci 1.618 projection
3. $2398 at symetrical triangle projection.
with this target, ethereum getting closer to our main target at $2529.
Don't forget to like this analysis,
If you have any question, do not hesitate to contact me
Your support at this analysis will also support ETHUSD to reach bullish target
Click here to check my other analysis

ETH short period analysis ⏰ ETHERIUM 🆓🚦📌 #dyor
💰 Position size :: 1%
💱 Leverage :: cross ➖ 2-5x
🪙 CRYPTOCAP:ETH -USDT 📌 🔰
#futuretrade :: ↗️ ......🌴
#BUY :: $1530.84 - $1592.97 ( split % 💰 )
🎯
:: $1669
:: $1754
:: $1906
Stop 🛑 lose #SL :: $1499 🚏
📌 always move stop lose #sl
when target get reached 📌
#risk :: medium #scalping
#explanation
👉 Before crash 🩸 expecting some bounce

ETH trade setup for 15th Nov 2023My setup yesterday was bullish, I only caught a 1:2rr. I didn't see other factors telling me to go bearish.
I was bent on being bullish, so I know and believe, setups can change. So learning to be dynamic is key and not holding to one belief of how the trade should pane out. However, it was a good day.
Today being, 15th Nov 2023, I'll be expecting a bearish scenario as outline on the chart. So I'll be expecting price to enter into the areas highlighted above and also the rectangle above for a reason to go short at specific time.
This is not a trade advice, please dyor

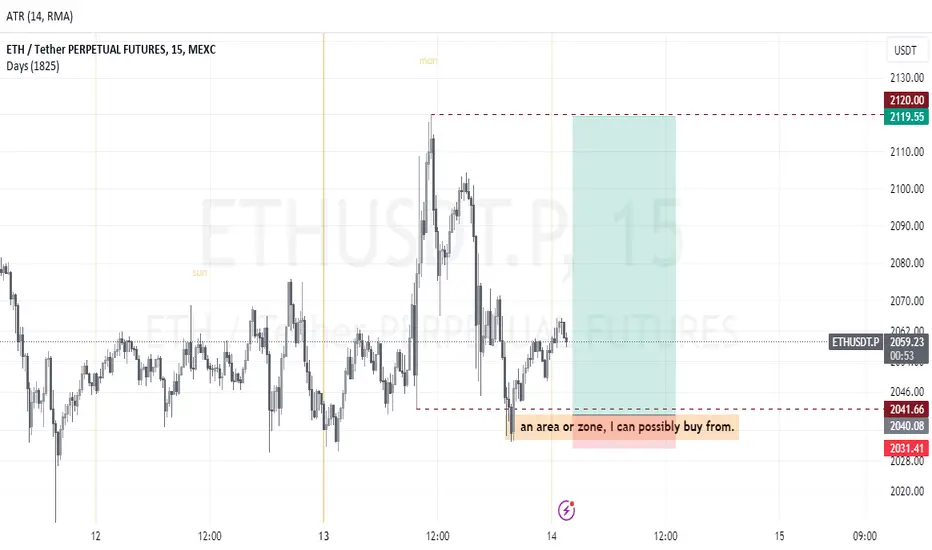
ETH Trade setup for 14th Nov 2023Eth has been bullish compared to BTC, so for me to trade this pair because it refused to make lower low but it also still took out some lows as an inducement to go short however, that's not the actually direction. It's direction is bullish to offset short traders. My possible scenario is for the market to trade into my zone at about 9:30am NY time today, then I can see what price is doing. If there be reasons to go long or short.
ETH's Phenomenal Bullish Flag and Your Chance to Long ETH!Ethereum (ETH), that unstoppable force of innovation and decentralized potential, has just experienced a jaw-dropping bullish flag after an outstanding breakout. This unprecedented event has set the stage for an extraordinary opportunity, and I couldn't contain my excitement any longer - it's time for you to long ETH!
A bullish flag breakout is like witnessing a majestic creature soar high above the clouds, defying all limits and embracing its full potential. It's an adrenaline-fueled rally that propels ETH to new heights, and guess what? That time is now! With this awe-inspiring bullish flag, ETH's potential knows no bounds; it's soaring skywards, ready to rewrite the history books once again.
But what makes this breakout even more thrilling is the dawn of a new era for Ethereum. With the launch of Ethereum 2.0 just on the horizon, we are witnessing a groundbreaking transformation that will revolutionize the world of decentralized finance and elevate ETH's value exponentially.
Now, fellow traders, it's time to seize this incredible moment. Let your excitement power your actions! Take your stand, and join the long ETH movement without hesitation. This is your opportunity to be part of a revolutionary journey, a journey that could change your financial landscape forever.
So, don't let this extraordinary bullish flag fade away without taking a leap of faith. Remember, legends aren't created by sitting on the sidelines - they are made by seizing the opportunities in front of us. Long ETH today and become part of this awe-inspiring story that's unfolding before our very eyes!

ETHUSD with new flagA new bullish flag perform today with small wave. In this analysis, I use 1 hour timeframe.
To make sure bullish continuation, ETH need to break up $2,102 and create a new higher high as bullish confirmation.
Bullish flag profit projection at $2,308, this target are same level as resistance channel up at my previous analysis.
Click here if you wanna learn about bullish flag pattern.
Don't forget to like this analysis,
If you have any question, do not hesitate to contact me
Your support at this analysis will also support ETHUSD to reach bullish target
Click here to check my other analysis

ETH : With a good break of the resistance range of $1997With a good break of the resistance range of $1997 and a suitable pullback, the price was able to rise to the heavy resistance of the $2139 area.
Currently, according to the chart, in the one-hour time frame between the above two areas, it has reached the support drawn with appropriate reaction.
With the breakdown of the drawn downward trend line, and the appropriate reaction to the upward trend line, the desired long position can be checked.
This is not a buy or sell offer.
According to your own technical analysis knowledge, do the required checks.
Good luck .
