Middle-term trade for Ethereum ETH priceEntry $1831
Stop $1739 (-5%)
Take profit $2794 (+52%)
Potential profit/loss ratio = 10.5/1
So far, the ETHUSDT price is in consolidation in a strong liquidity zone. After the price fix is above $2020, growth may accelerate.
Do you like this format of ideas? Write about it in the comments.
_____________________
Did you like our analysis? Leave a comment, like, and follow to get more
Ethrum

ETH USD ShortWait for price to reach to target area for Shorts and if it does our limits are ready :)

ALPHA/USDT - SHORT----- Welcome, dear followers! -----
- Here is my trading methodology. I trade with a normal system and analysis of resistance and support, as well as price reversal patterns.
- For the record, I do not place a stop loss within my trades. So that I only risk 1.5% of my total capital in order to support the loss due to a price reversal against me.
- If a price reversed against my expectation and touched the drawn line r3, then I transferred targets to the entry point and waited for the price to close at it with a loss equal to almost zero.
- Today's deal is shown in the chart, and here are the entry and exit points below.
-- Support me with numbers and follow up on my account for other deals in the future. Thank you for coming to this part. --
-------------------------------------------------------
⚡️⚡️ ALPHA/USDT ⚡️⚡️
Exchange: Binance Futures
Trade Type: Breakout (Short)
Leverage: Cross (1.0X)
Entry Orders:
1) 0.1166 - 100.0% (53.8353 USDT)
Take-Profit Orders:
1) 0.1100 - 80.0%
2) 0.1063 - 19.999%
Trailing Configuration:
Stop: Breakeven -
Trigger: Target (1) .

XMR/USDT - SHORT----- Welcome, dear followers! -----
- Here is my trading methodology. I trade with a normal system and analysis of resistance and support, as well as price reversal patterns.
- For the record, I do not place a stop loss within my trades. So that I only risk 1.5% of my total capital in order to support the loss due to a price reversal against me.
- If a price reversed against my expectation and touched the drawn line r3, then I transferred targets to the entry point and waited for the price to close at it with a loss equal to almost zero.
- Today's deal is shown in the chart, and here are the entry and exit points below.
-- Support me with numbers and follow up on my account for other deals in the future. Thank you for coming to this part. --
-------------------------------------------------------
⚡️⚡️ XMR/USDT ⚡️⚡️
Exchange: Binance Futures
Trade Type: Breakout (Short)
Leverage: Cross (1.0X)
Entry Orders:
1) 143.05 - 100.0% (63.64626 USDT)
Take-Profit Orders:
1) 140.62 - 80.0%
2) 138.62 - 19.999%
Trailing Configuration:
Stop: Breakeven -
Trigger: Target (1)

ETHEREUM TARGET IS NOW UNDER 600 FIB CYCLES AND PRICES Have been acting near perfect within the fractal and fib algorithm

HOOK WHAT IS THIS HOOK WHAT IS THIS always there on uniswap with only 10,000 supply no info nothing on it but it always there on uniswap


ETH READY TO BULLISH ( ATH )😎💍😎💍Hi dear treaders, According to the previous analysis, we reached the desired targets. And now: Atrium reached a resistance of 1650$ in a 1 hour time frame in a rally. We proceed according to the formed triangle pattern that can be seen in the chart three times. If the resistance is broken correctly, the next target is 1770$ and then we can get 1900$. In case of return, the first support area is in A. And in case of failure of this area, we reach the support of area B. The main support is located in area C.
If you like my idea please click the * like * button and comment your idea.
Good luck.

ETH READY TO REACH 1600$ ?🤔👀🤔Hi dear treaders, According to the previous analysis, we reached the desired targets. At the moment, Atrium has formed a bullish pattern in the 1-hour timeframe, the condition for which is the correct failure of the 1550$ resistance. If the failure is complete, the next target is 1600$ and the next important resistance is 1685$. The first support area is the s1 area. And the main support region is seen in s2.
If you like my idea please click the * like * button and comment your idea.
Good luck.

ETH READY TO BULLISH 😎💥😎💥Hi dear treaders, Atrium is crossing the 1380$ resistance. If this resistance is broken correctly, the next important targets are 1450$ and 1500$. Maybe an explosion is waiting for Atrium. The important support area is in S2 and the closest support area is seen in S1. The RSI chart also shows the support line in this area.
If you like my idea please click the * like * button and comment your idea.
Good luck.

ETH IS READY TO GO TO THE MOON ( ATH ) 💍💣💍💣Hi dear treaders, Atrium, like Beat, was in the consolidation phase and resumed its uptrend today. The 1150$ to 1170$ area should become a strong support area for Atrium to be able to advance the uptrend with strength. The resistance is before 1348$. Support areas S1 and S2 are marked in the chart . According to RSI and MACD, the market is bullish. The next target is 1400$ and 1450$
If you like my idea please click the *like* button and comment your idea.
Good luck .

ETH ready to go to ATH 😎👑💎❣Hi dear treaders, According to the previous analysis, we saw that the price broke the upper side of the triangle, but could not break the resistance of 1258$ properly. So it went back into the channel. The first area is supported and the second area is seen near the EMA200. To enter, it is better to wait until the 1258$ resistance is broken correctly and also the price returns to the 1167$ or 1157$ near SMA50.
If you like my idea please click * like *button and comment your idea.
Good luck

ETH bullish or bearish 🤔🤔👀👀Hi dear treaders, ETH fluctuates in the area of 1230$ to 1180$. If the price breaks the trend line, the price will go down to the support area S1. The main support is in the S2 area, which is specified by the EMA200. In case of failure of the upper side of the triangle and correct failure of the 1258$ resistance, the next target is 1298$.
If you like my idea please click * like *button and comment your idea.
Good luck

ETHRUM in 4H time frame rising for scalp trading 🤔🕶🕶Hi dear treaders, ETH improved to the support area of 900 $ after its sharp rise. And now it is fluctuating in the upper channel. At this time, the best time frame for trading is 1 hour. You can trade as a scalp. Green lines are marked for entry and blue lines for save profit.
If you like my idea please click * like * button and comment your idea.
Good luck

ETHRUM in 4H time frame trying to reach 1200$ & 1300$ 😎🗯💥🗯Hi guys, The price has twice moved from the support of 900$ to the highest point, 1162$, but it was unsuccessful and could not advance more than 1120$. This is the third attempt and if it fails, it goes back to the first support area identified. And if this support is broken, the second area is desired. The movement trend is seen in the chart.
If you like my idea please click * like * button and comment your idea.
Good luck

ETH ready to go to MOON 1500$ 1800$💣💥💣💥Hi dear treaders, We saw a great rally like BTC. And now we are ready for a proper climb if the resistance are broken correctly as you can see in the chart above.
If you like my idea please click * like *button and comment your idea.
Good luck

ETH is bullish and ready to going up 🎅🎅💎💎Hi dear treaders,in 4H time frame The price broke the upper side of the triangle and the upward trend began. If the $ 760 resistance is broken correctly, the next target is $ 780 and $ 800. Support range is between $ 740 and $ 720 in case of return. The main support is $ 714.
If you like my idea please click * like * button and comment your idea.
Good luck

ETHRUM get ready to reach 800$ & 850$ 👣💥👣💥Hi dear treaders, ETH is moving in an uptrend channel in 1D time frame . The main resistance is 740$. The final target 850$ is available if the correct resistance is breakout. If it returns, it reaches the range of 650$ and then climbs to the resistance of 840$ and 850$. The best buy area is between 650$ and 670$.
If you like my idea please click * like *button and comment your idea.
Good luck

How ETH is rising in 4H time frame bullish or bearish 🤔🤔Hi dear treaders, According to the previous analysis, ETH broke the pattern of the rising flag and advanced to 717$. And now there is a negative divergence in RSI and market trends. The resistance is 690$ and the first support is 636.37$ and the main support is 600$. If the resistance break , the first target is 700$. It is possible to reach 735$ if buyers keep up the pressure.
If you like my idea please click * like * button and comment your idea.
Good luck

ETH is rising flag pattern 💥💥Hi dear treaders, Following the previous analysis, as you can see, we reached the desired targets. And now we have reached the resistance of $ 650, which is a rising flag pattern. If the resistance breaks, the pattern is confirmed. MACD and RSI also show an uptrend. The nearest support is $ 640 and $ 616.71.
If you like my idea please click * like *button and comment your idea.
Good luck

Eth is getting ready to bullish 💎💎Hi treaders, Eth in 4H time frame bullish if the breakout 633.71$ then rising to 640 $ and the next resistance 650 $.
First support zone 616.71 $ and the main support zone is 600$.
If you like my idea please click * like * button and comment your idea.
Good luck.

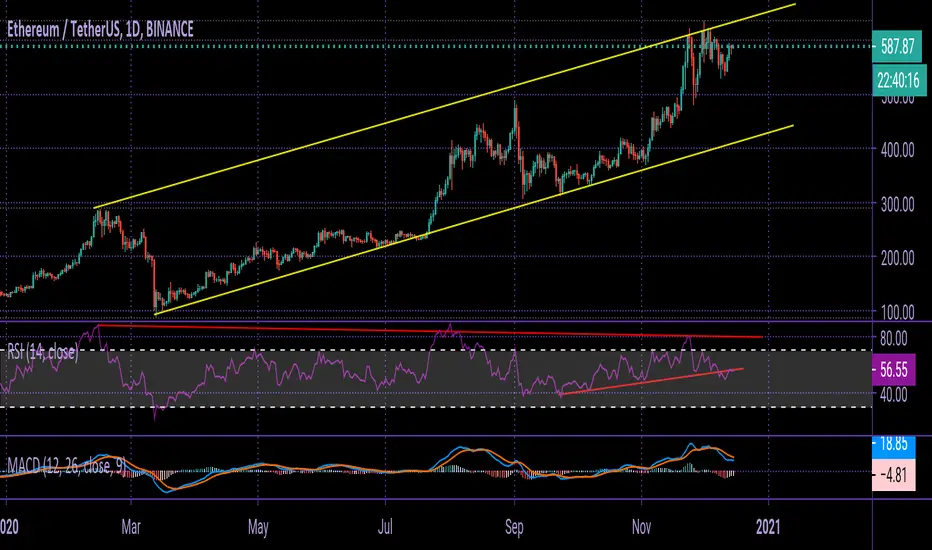
Ethrum Analysis in 1D time frame Hi,The price of ETH in daily time is on an upward trend, which has just left its long-term channel. The MACD indicator and the price chart are converging, indicating a tendency to maintain an uptrend, but given the divergence in the RSI, one should expect a price correction in the daily time. The RSI indicator has broken its support line down and is now pulling back to it. If Polback confirms and this support fails, a deeper price correction should be expected.
GOOD LUCK