ETH/USD 1DAY UPDATE BY CRYPTO SANDERS !!Hello, welcome to this ETH/USDT update by CRYPTO SANDERS.
CHART ANALYSIS:- Ethereum (ETH) was another big mover, surging above 2,000 in today’s session, which came as a result of the Ripple news.
Following a low of 1,878.81 on Thursday, ETH/USD jumped to an intraday high of 2,026.20 earlier in the day.
the world’s second-largest cryptocurrency recorded its strongest level since April 19.
A downward crossover of moving averages also failed to materialize, with momentum now back in the hands of bulls. Ethereum’s RSI failed to break out of a ceiling at 65.00, with the index now at a reading of 63.02.
ethereum is trading at $1,933.
I have tried to bring the best possible outcome to this chart.
Hit the like button if you like it and share your charts in the comments section.
Thank you
Ethshort

ETH USD ShortWait for price to reach to target area for Shorts and if it does our limits are ready :)

ETHUSDT | SHORT If we consider Ethereum to be falling, we are actually moving completely against the direction of the trend.
But in my opinion, this scenario has a 60% chance of falling.
Not for trading and swinging, just for analysis.
So do not trade according to this!

Short on ETH The market is filled with joy from the victory of XRP over the SEC, everyone immediately started buying everything (a very good sign)
Why shorts? market on local heights + euphoria

#ETH - thoughts out loud №3Good evening from Ukraine!
Dear colleagues, I am glad to welcome you!
I expect the price to rise to 2000, and then we'll see.
Thank you all for your attention, I wish you success.
Sometimes you win/sometimes you learn.
- thoughts out loud
- thoughts out loud
- thoughts out loud

Ethereum: Daily AnalysisAt Time Daily Ethereum we are seeing a nice head and shoulders pattern forming. According to what we see now, we expect the price to move up to the resistance of 1923 and after hitting this level, it will return to the neck line (1825 support).
Resistances: 1923-2000
Support: 1790-1825

Limit SHORT ETHUSDT at 190x | Target 1780-1800Short ETHUSDT at 190x
+ Stoploss : 1930
+ TP1: 1850
+ TP2: 1800
+ TP3: 1780
I use SMC to analysis ETHUSDT.P chart today (7/10/2023)
Above is my plan of ETH for the community, looking forward to your input on my ideas
Happy trading!!!!!

ETHUSD about to breakoutETHUSD looks pretty strong. However it's inside the formation.
If we get the breakout , we may see much higher prices soon
RSI shows that the trend is strong and it's far away of being overbought.
Enter the long position once the breakout occurs.
Moreover, to avoid trading the fakeout, look for the volume increase.
3 targets for longs are shown on the chart
Good luck

ETH/BUSD Short Trade - Potential Breakdown | Target $1680ETH/BUSD is currently experiencing a significant breakdown from its support trendline. A short trade opportunity can be considered at the current market price of $1798. The ascending chart pattern suggests a potential target around $1680. It is advisable to set a stop loss at $1882 to manage potential risks. #ETHBUSD #Cryptotrading
keep an eye on DXY as it sharply rises, surpassing a key resistance level at 104.

My short setup for #ETHUSDTHELLO Guys
As you can see #ETH is drawing Head and shoulders pattern in 1D and I am looking for entry trigger are the area of $1927 using candle stick patterns

Negative Money Flow Index for ETH - Explore AlternativesI write to you with caution regarding Ethereum (ETH) and its current negative dropping Money Flow Index (MFI).
As many of you know, the MFI is a popular technical indicator used to measure the strength and direction of money flowing in and out of an asset. It provides insights into market sentiment and can help identify potential buying or selling opportunities. Unfortunately, the recent MFI trend for ETH has raised concerns and warrants our attention.
Over the past few weeks, ETH's MFI has shown a consistent negative drop, indicating a significant outflow of money from the asset. While market fluctuations are common in cryptocurrencies, it is crucial to acknowledge this downward trend and consider its implications for your investment strategy.
Therefore, I urge you to step back and reevaluate your portfolio allocation, especially regarding ETH. While Ethereum has undoubtedly been a pioneer in the blockchain space and has witnessed remarkable growth, it is essential to remember that diversification is the key to long-term success in any investment venture.
Given ETH's negative dropping of MFI, I strongly encourage you to explore alternative asset classes within the cryptocurrency market. By diversifying your holdings, you can mitigate risks associated with a single asset's performance and potentially capitalize on emerging opportunities elsewhere.
Consider allocating a portion of your portfolio to other promising cryptocurrencies demonstrating positive signs and growth potential. Conduct thorough research and analysis, considering factors such as market demand, technological innovation, and the team behind each project. This approach will help you make informed decisions and reduce the impact of any adverse trends affecting a particular asset.
Remember, the cryptocurrency market is highly dynamic and ever-evolving. As traders, we are responsible for adapting and staying ahead of the curve. By considering alternatives to ETH and diversifying your investments, you can better position yourself to navigate the market's ups and downs while potentially maximizing your returns.

Bullish falling channel BINANCE:FIDAUSDT
Bullish falling channel pattern In Fida Looks Filled Buyer Candle
continue to follow this week as it is very solid


ETH - an important level ahead! Be careful!Hello trader! Today I have a new idea for you. Like and subscribe to the channel, there is a lot of useful information.✅
Friends, I want to update for you the idea of my marginal positions.
ETH - the technical has broken through the level with a false movement (red line on the chart), which was quite expected, and the price is again moving down to the support levels.
We have an important level ahead of us (I just marked it on the chart) I plan to exit plus or minus in this range of $1820-1835, the average entry point is $1940 (18% with 3X leverage)
Perhaps from the support level of 1820 we will see the reaction of the buyer, quite attractive support from there to place limit orders to buy.

ETH/USD 1DAY UPDATE BY CRYPTO SANDERS !!Hello, welcome to this ETH/USDT update by CRYPTO SANDERS.
CHART ANALYSIS:- ethereum (ETH) slipped in today’s session, falling below 1,950.
ETH/USD dropped to a bottom at 1,949.15 earlier in the day, less than 24 hours after peaking at 1,974.78.
The world’s second-largest cryptocurrency has since rebounded and is once again closing in on a multi-month high.
ETH bulls will need to take price strength above an upcoming ceiling at the 64.00 zone.
Currently, the RSI has a reading of 62.59, which is its highest level since April 19, when the price was above 2,100.
Some believe that ETH could head back toward this point in the coming weeks.
Hit the like button if you like it and share your charts in the comments section.
Thank you

Ethereum - bulls are in huge DANGER!Hello, everyone!
Yesterday I made the BTC analysis where pointed out that it's pump will be ended soon. Today it's time to talk about CRYPTOCAP:ETH which is going to follow Bitcoin.
1️⃣WHY THE ELLIOTT WAVE FORMATION IS VALID?
Let's take a look at the ETH price chart. We can see also the clear 5 Elliott waves formation. Notice that wave 3 has perfectly hit the 1.618 Fibonacci extension level, which corresponds to extended target for this wave. Wave has also reached it's original target between 0.38 and 0.5 Fibonacci retracement levels. Now price is printing the wave 5. You can tell me that this wave 5 is ugly, but it could be in shape of ending diagonal. That's why I expect the slight higher high before the deep dive.
2️⃣WAVE 5 TARGET
Wave 5 has the target zone inside the red box. The lower band of this box has been already reached. I think Ethereum will hit the higher band at $2000 and it's gonna be the top.
3️⃣OTHER BEARISH SIGNS
The Awesome Oscillator supports my idea because it has already formed the confirmed divergence. The only one thing we need is the bearish reversal squat (MFI state) bar on the 4h time frame to tell that uptrend is over. Moreover on the 1D time frame ETHUSDT has already formed the squat MFI bar yesterday, which could be the strong early bearish sign.
Best regards, Ivan
_____________________________________________________________
🔥Please, follow me and smash the rocket🚀 button to support me🔥

#ETH - thoughts out loud №2Good evening from Ukraine!
Dear colleagues, I am glad to welcome you!
In a nutshell, there is no buyer's strength in this trajectory, and I expect a short-term development of the situation.
Thank you all for your attention, I wish you success.
Sometimes you win /sometimes you learn .
- thoughts out loud
- thoughts out loud
- thoughts out loud
BINANCE:ETHUSDT

Ethereum ETH potential rally with the Stock MarketCryptocurrencies were left behind by the recent Stock Market rally.
With the arrival of new BTC Bitcoin ETFs, I expect the Crypto Market to follow!
ETH/USDT prediction
Entry Range: $1800 - 1900
Take Profit 1: $1950
Take Profit 2: $2010
Take Profit 3: $2100
Stop Loss: $1730

Ethereum continues to hold back the bulls.Ethereum - 24h expiry - We look to Sell at 1915 (stop at 1955)
We look to trade the current range.
1920 continues to hold back the bulls.
Preferred trade is to sell into rallies.
Although the bulls are in control, the stalling positive momentum indicates a turnaround is possible.
We look for a temporary move higher.
Our profit targets will be 1815 and 1795
Resistance: 1871 / 1900 / 1915
Support: 1845 / 1815 / 1800
Please be advised that the information presented on TradingView is provided to Vantage (‘Vantage Global Limited’, ‘we’) by a third-party provider (‘Everest Fortune Group’). Please be reminded that you are solely responsible for the trading decisions on your account. There is a very high degree of risk involved in trading. Any information and/or content is intended entirely for research, educational and informational purposes only and does not constitute investment or consultation advice or investment strategy. The information is not tailored to the investment needs of any specific person and therefore does not involve a consideration of any of the investment objectives, financial situation or needs of any viewer that may receive it. Kindly also note that past performance is not a reliable indicator of future results. Actual results may differ materially from those anticipated in forward-looking or past performance statements. We assume no liability as to the accuracy or completeness of any of the information and/or content provided herein and the Company cannot be held responsible for any omission, mistake nor for any loss or damage including without limitation to any loss of profit which may arise from reliance on any information supplied by Everest Fortune Group.

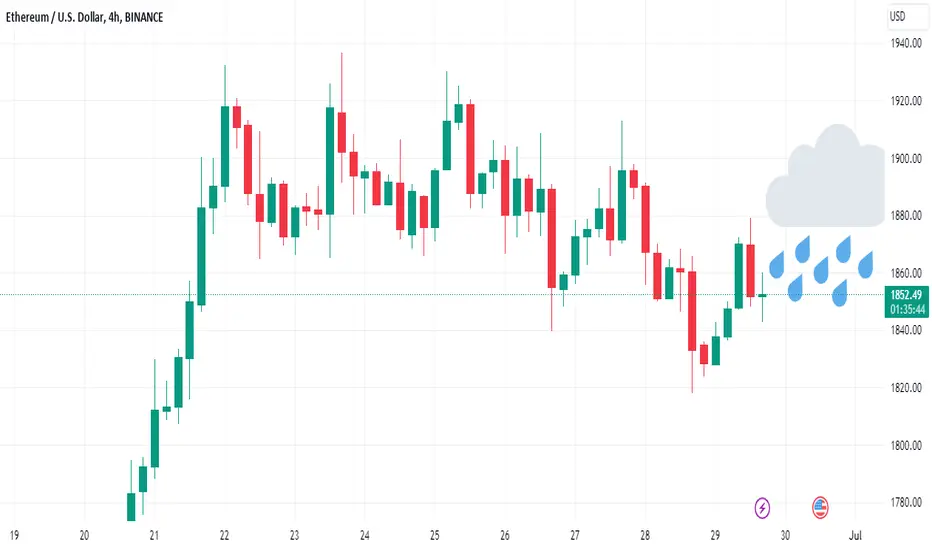
🌧️ Outlook for Ethereum & Altcoins; ☀️ for BTC & BNBEther and many other altcoins face cloudy ☁ or even rainy conditions 🌧️, signaling a bearish trend with downside risks according to ATTMO.
However, sunny weather with a few scattered clouds lies ahead for Bitcoin and Binance in the next 24 hours ☀️, painting a slightly bullish market outlook as investor interest in the crypto sphere remains strong.
Over a one-week horizon, ATTMO predicts prevailing sunny trading conditions across most of the crypto market. 📈
Follow us for more crypto weather reports!
ETH Short in to a Long?Since Bitcoin has started to rise again and Ethereum has found its local bottom at $1815.05 (Bybit Chart ETHUSDT.P), there haven't been many opportunities for traders to enter a long position. A scenario we would like to see is a price rejection around the zone between $1886.39 and $1904.81. Setting a stop loss now is almost impossible as, from a trader's perspective, we always advise not to preset trades but to wait for a change in market structure. The goal would be to enter short.
Pay close attention during the descent. Currently, the price continues to remain in a local downtrend (the price continues to mark Lower Lows, Lower High), for this reason, it is important to protect your position and take profit along the descent. Always remember that Bitcoin commands the market and the price of ETH moves accordingly.
Advice: wait for the change in structure as advised by The Inner Circle Trader (perfect Entry).

Taking A Look At The 1HRHey Humans!
As you can see, this "pump" has been riding on this last EMA 50 over EMA 200 crossover.
Clearly, that is about to wrap up in the next day or so which may lead to a sharp decline.
Liove long and profit <3

ETH/USD 1DAY UPDATE BY CRYPTO SANDERS !!Hello, welcome to this ETH/USDT update by CRYPTO SANDERS.
CHART ANALYSIS:- Ethereum (ETH) briefly rose above the 1,900 level in today’s session, after falling towards a support level of 1,830 on Monday.
Following a low of 1,840.22 to start the week, ETH/USD jumped to a peak at 1,905.36 earlier in the day.
with the world’s second-largest cryptocurrency once again falling below the 1,900 level.
ETH is trading at 1,881.79, with the RSI marginally below a resistance level of 58.00.
momentum is bullish, following a recent crossover between the 10-day (red) moving average, and its 25-day (blue) counterpart.
Should this cross mature, there is a good chance that ETH will not only move above 1,900 but closer to 2,000.
I have tried to bring the best possible outcome to this chart.
Hit the like button if you like it and share your charts in the comments section.
Thank you
