No bera till we do thisI know all our feeds are bearish, head and shoulders everywhere but IMO we don't need to get bearish till we start closing below this 3D breaker.
Ethshort

Ethereum 500 USD...in this year..#ETHUSDT You an buy #ETH at 400-500 $ in this year..I am Very Bearish on this on Daily Timeframe. There is 90 % chance #ETH will go down below 500$..

ETH/USD 1DAY UPDATE BY CRYPTO SANDERS !!Hello, welcome to this ETHEREUM /USDT update by CRYPTO SANDERS.
CHART ANALYSIS:- ethereum (ETH) also moved higher on Saturday, remaining above the 1,800 level.
Following a low of 1,810.37 on Friday, ETH/USD managed to hit an intraday high of 1,837.87 earlier in the day.
This surge led to the world’s second-largest cryptocurrency breaking out of its recent ceiling of 1,830.
as the day has progressed, earlier gains have somewhat fallen, with ETH now trading at 1,828.18.
It appears that market uncertainty has also risen, as the RSI neared a ceiling of its own at the 49.00 mark.
Price strength is now tracking at 48.75, and should it break out of this point, then there could be further highs from ETH this weekend.
Hit the like button if you like it and share your charts in the comments section.
Thank you

Can ETH skyrocket by breaching this level for an astounding 50% Guys, we're looking at a big move up ahead. Here's why it's likely to break this level:
>Notice the Green boxed candle. It often signals a change of character (here in the upward trend), suggesting this level will be surpassed soon.
>When a 10-day green candle closes above the level (R1), expect a 50% price increase. Set your stop loss at the light blue box.
>Even if the price temporarily drops, lower time frames confirm a potential move to the DARK blue level. Keep a tight stop loss (above the R1) and aim for a 31% decline.
Remember, your input is valuable in the comments. Let's discuss and share our thoughts.
Good luck!

$BTC $ETH MOTHER OF ALL BUBBLES BTC ~$11k & ETH ~$650#Bitcoin #Ethereum MOTHER OF ALL BUBBLES 😱
Crypto TVL may fall below $500 B ⚠️
60% market crash 💣
If so, BTC ~$11k ETH ~$650 👀
Pray to God that this doesn't happen 🙏

ETH/USD 1DAY UPDATE BY CRYPTO SANDERS !!Hello, welcome to this ETHEREUM /USDT update by CRYPTO SANDERS.
CHART ANALYSIS:- Ethereum (ETH) also declined for the second session in a row, falling below the 1,800 level in the process.
After hitting a high of 1,817.97 ETH/USD reached a low of 1,763.37 today.
The move dropped Ethereum from its own support point at 1,790, hitting a two-week low in the process.
the earlier decline has eased somewhat, as the floor at 43.00 on the RSI has helped stop the bleeding.
Despite the decline, the 10-day (red), and 25-day (blue) moving averages are now nearing a crossover, which could signal a price reversal.
Hit the like button if you like it and share your charts in the comments section.
Thank you

Short inboundHi
i am back with 4:1 ratio trade.
you can either wait for a pullback following the blue curve and then short to have a smaller SL or you can short it right here to secure your position incase a pullback does not happen.
Good luck, happy trading guys.

BTC ⛈️ ETH ⛈️ Will ADA Soar Despite the Storm? 🌩️🚀🤔Stormy weather ahead on the global crypto market. ⛈️ This translates into a very bearish market with some downside risk for cryptocurrencies like Bitcoin, Ethereum, Binance Coin, and Polkadot. The weather is, however, 🌴 tropical – very bullish with some upside potential – for Cardano today.
Over a one-week horizon, ☁️ cloudy weather with some ☀️ sun is likely for Bitcoin, signaling a slightly bearish market with downside risk. The outlook is a bit brighter for Ethereum, Ripple, Cardano, and Dogecoin, where ATTMO signals a slightly bullish mood with 🚀 upside potential.
Follow us to stay updated with more crypto weather insights and reports!🌩️⛅🌈

ETH SETUP"Support levels are indicated in green, from weakest to strongest at the bottom, and resistance levels are also indicated from weakest to strongest. You can enter buy and sell trades based on them."
Please note that support and resistance levels are commonly used in technical analysis to identify potential levels at which the price of a financial instrument may reverse or encounter obstacles. Traders and analysts use these levels to make informed decisions about entering or exiting trades.

ETHUSDTNobody Knows Where is Price Going.
Hey traders, here is the analysi.
If you guys like my analysis please hit like?? and follow.
Thanks.
DISCLAIMER- This is not financial advice.
SMART MONEY CONCEPT.
identify Liquidity Or Become Liquidity

ETH/USD 1DAY UPDATE BY CRYPTO SANDERS !!Hello, welcome to this ETHEREUM /USDT update by CRYPTO SANDERS.
CHART ANALYSIS:- ethereum (ETH) Ethereum (ETH) climbed slightly higher on Monday as it bounced off key support points once again.
After a low of 1,793.22 on Sunday, ETH/USD climbed to a peak of 1,820.25 at the start of the day.
The drop saw Ethereum near its recent price bottom at the the1,790 though bulls used this as a signal to re-enter the market.
Nevertheless, the earlier gains have been pared down to some extent, with the index currently trading near the all-time high of 46.00.
For the momentum to accelerate fully, this resistance would need to be broken, which is unlikely to happen until a debt ceiling agreement is reached.
I have tried to bring the best possible outcome to this chart.
Hit the like button if you like it and share your charts in the comments section.
Thank you

ETH DUMP TO 900 AND BEYONDETH COULD DUMP ALL THE WAY TO 1K AND BELOW. Stay alert as we may be heading into a dumping cycle from now BINANCE:ETHUSDT30M2023

EGTUSDT ARE you RDY 2023 Long👌❤🧨The upward trend for Ethereum will also start soon.
At first, Ethereum will have a downward trend for the range of 1696 dollars, from the point of view of Smart Money, then it will start its upward trend with strength and touch the three ranges of 2020 dollars, 2478 dollars and 2967 dollars.
In the meantime, the alt season will start and other cryptocurrencies can give good profits to its shareholders.

#ETH to follow Hiragana!Hello and welcome guys! here i am presenting you a simple way to analyse hiragana pattern. I have found it even and it works! Yes. atleast in crypto! The fall is eminent till 1772 retesting lows and a blasting momentum soon! just observe it.

eth usdt
This signal is seen in daily hours. As you know, the signal is not suitable for people who want to finish the transaction quickly.

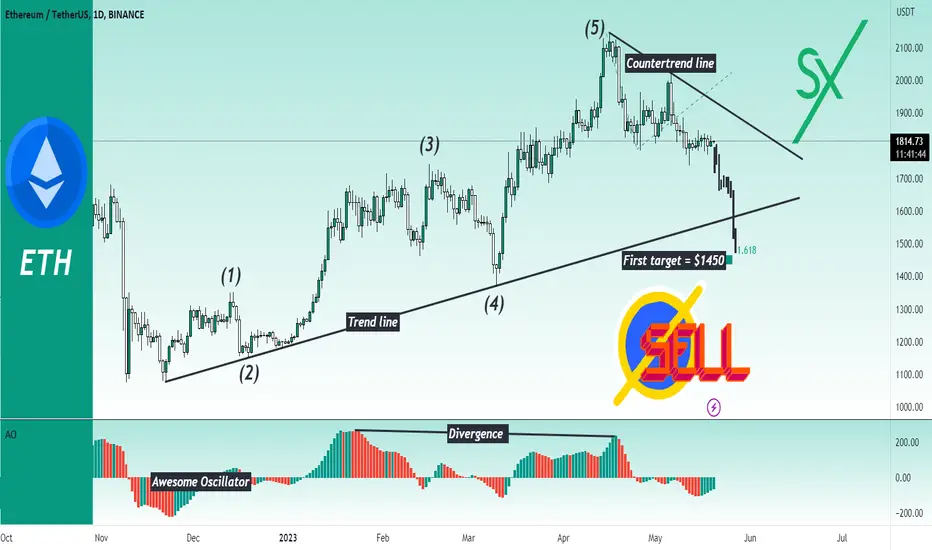
Ethereum (ETH) is on the edge of collapse!Hello, my dear friends!
As you know, I am bearish on the entire crypto market and Ethereum is not an exception. It's waves formation looks like we have seen on Bitcoin. Therefore, I expect the same outcome in the upcoming weeks.
During May 2023 BINANCE:ETHUSDT is stagnating very very slowly. It looks like annoying downward sloping sideways. Perfectly, I expect to see the huge dump next week, because bears have to confirm their intentions. I am sure that uptrend is over because we can see the clear 5 waves structure, the divergence on the Awesome Oscillator. If the first dump was the wave 1, it means that now asset is printing the wave 3. The wave 3 ordinary target is locatet at 1.61 Fibonacci extension, approximately at $1450😱.
If price will reach this target, we also see the key trend line breakdown. Last time price immediately bounced off this trend line, but this time I consider the bad time for ETH. We also should talk about the scenario invalidation. We have the countertrend line. If price will be able to break it my scenario is wrong and current dump is just a correction.
Best regards, Ivan
______________________________________
❤️Follow me and never miss the update❤️
Eth longEthereum following a rising channel. According to that eth may drop down on trend line. Then we will open quick long in it

Selling Ethereum at current resistance.Ethereum - 24h expiry - We look to Sell at 1829 (stop at 1879)
We look to trade the current range. Bespoke resistance is located at 1830.
1830 continues to hold back the bulls.
The preferred trade is to sell into rallies.
Our short-term bias remains negative.
Our profit targets will be 1709 and 1689
Resistance: 1810 / 1830 / 1850
Support: 1790 / 1770 / 1755
Please be advised that the information presented on TradingView is provided to Vantage (‘Vantage Global Limited’, ‘we’) by a third-party provider (‘Signal Centre’). Please be reminded that you are solely responsible for the trading decisions on your account. There is a very high degree of risk involved in trading. Any information and/or content is intended entirely for research, educational and informational purposes only and does not constitute investment or consultation advice or investment strategy. The information is not tailored to the investment needs of any specific person and therefore does not involve a consideration of any of the investment objectives, financial situation or needs of any viewer that may receive it. Kindly also note that past performance is not a reliable indicator of future results. Actual results may differ materially from those anticipated in forward-looking or past performance statements. We assume no liability as to the accuracy or completeness of any of the information and/or content provided herein and the Company cannot be held responsible for any omission, mistake nor for any loss or damage including without limitation to any loss of profit which may arise from reliance on any information supplied by Signal Centre.

ETHUSDT SHORT4H supply Zone has not been tested yet ,possible short scenario if it touches the mark zone and we get confirmations!

ETH/USD 1DAY UPDATE BY CRYPTO SANDERS !!Hello, welcome to this ETHEREUM /USDT update by CRYPTO SANDERS.
CHART ANALYSIS:- ethereum (ETH) also trended higher, racing back over the 1,800 level in today’s session.
ETH/USD hit a high of 1,834.27 earlier today, which comes less than 24 hours after falling to a bottom at 1,786.67.
This has resulted in the world’s second-largest cryptocurrency bouncing from a support point at the $1,790 mark
the RSI on ethereum has still yet to move which is at the 47.00 mark.
Price strength is currently at the 45.10 level, and should it cross the line of 47.00, more bulls will likely reenter the market.
I have tried to bring the best possible outcome to this chart.
Hit the like button if you like it and share your charts in the comments section.
Thank you


Ethereum to find sellers at previous resistance?Ethereum - 24h expiry - We look to Sell at 1876 (stop at 1926)
A sequence of daily lower lows and highs has been posted.
Previous resistance located at 1880.
The previous swing high is located at 1885.
1886 has been pivotal.
Preferred trade is to sell into rallies.
Our profit targets will be 1756 and 1736
Resistance: 1835 / 1860 / 1880
Support: 1800 / 1785 / 1755
Please be advised that the information presented on TradingView is provided to Vantage (‘Vantage Global Limited’, ‘we’) by a third-party provider (‘Signal Centre’). Please be reminded that you are solely responsible for the trading decisions on your account. There is a very high degree of risk involved in trading. Any information and/or content is intended entirely for research, educational and informational purposes only and does not constitute investment or consultation advice or investment strategy. The information is not tailored to the investment needs of any specific person and therefore does not involve a consideration of any of the investment objectives, financial situation or needs of any viewer that may receive it. Kindly also note that past performance is not a reliable indicator of future results. Actual results may differ materially from those anticipated in forward-looking or past performance statements. We assume no liability as to the accuracy or completeness of any of the information and/or content provided herein and the Company cannot be held responsible for any omission, mistake nor for any loss or damage including without limitation to any loss of profit which may arise from reliance on any information supplied by Signal Centre.

🐻 BTC, ETH - Bearish Signs, BNB Shines with Upside Potential ☀️Cloudy weather with some sun lies ahead for the global crypto market in the next 24 hours 🌥️, according to ATTMO, a weather-inspired crypto AI forecasting tool. The weather is tropical🌴– very bullish with some upside potential – for Binance Coin in the coming 24 hours.
Both Bitcoin and Ethereum face downside risks 📉 due to a slightly bearish market. Factors such as the possibility of US debt default and regulatory uncertainties in the US have dampened overall crypto sentiment.☔️
Over a one-week horizon, the forecasts remain unchanged for Bitcoin, while Ethereum has a slight upside potential.📈 Dogecoin faces stormy weather ahead, which signals a drawn-out bear market with an imminent market rebound possible.🚀
Follow us for more crypto weather reports!
