ETH/USD 1DAY UPDATE BY CRYPTO SANDERS !!Hello, welcome to this ETHEREUM /USD update by CRYPTO SANDERS.
CHART ANALYSIS:-Ethereum (ETH) also made a comeback on Hump Day as the bulls started re-entering the market.
ETH/USD reached a peak of 1,879.76 on Wednesday, having dropped below nearly 1,800 the day before.
This move allowed Ethereum bulls to briefly propel the price above the 1,875 ceiling before retreating as the session matured.
Earlier gains were pared down as price strength was unable to overcome a key point of resistance at 48.00, with the index now tracking at 46.99.
Despite this, there is still some optimism that Ethereum could move above 2000 later today,
ETH is trading at 1,900.
Hit the like button if you like it and share your charts in the comments section.
Thank you
Ethshort

The dramatic rise in Ethernet network costsSince the launch of the Shapella upgrade on April 12, transaction fees on the ethereum network have been trending strongly upward. From that day through April 22, the network processed more than 1 million transactions per day, excluding April 16. Next, Ether's transaction volume stayed below 1 million, averaging 800,000 to 900,000 transactions per day. Given these 30 days of rising fees, the cost of certain transactions on the Ethernet network is relatively high. For example, sales on Opensea charged $9.93 per transfer, while transactions on Uniswap charged $25.58 per transaction. On the other hand, depositing ERC20 tokens costs $7.50 per transaction.
Interestingly, since the implementation of the Shapella hard fork, the Ethernet Arbitrum Layer 2 (L2) extension solution has exceeded the network's transaction volume in the daily timeframe. Since April, Arbitrum has processed 1.1 to 1.5 million transactions per day, while L2 competitor Optimism has recorded 240,000 to 550,000 transactions per day during the same period. In addition, Arbitrum's average transaction fee is $0.368 per transfer, while Optimism's average transaction fee is slightly higher at $0.682 per transaction.
Over the past 14 days, ETH's market cap has fallen 12.7% against the U.S. dollar. However, the second largest digital asset by market cap is still 1.4% higher than it was in the previous 30 days. Currently, ETH has a market cap of $220.1 billion, or 18.97% of the total value of the crypto economy, compared to $1.16 trillion as of yesterday.

ETH/USD 1DAY UPDATE BY CRYPTO SANDERS !!Hello, welcome to this ETHEREUM /USD update by CRYPTO SANDERS.
CHART ANALYSIS:-Ethereum (ETH) After hitting a high of 1,851.19 to start the week, ETH/USD fell to a low of 1,809.19 at the start of the day. Yesterday's decline saw the world's second-largest cryptocurrency down from its long-term price bottom at 1,830.
ETH has rebounded from this floor, as the sentiment remained relatively stable despite the earlier decline.
This happened despite the RSI trading under its own support point at 45.00 with a current reading of 44.30.
More moves could follow after the Fed's decision, with a possible move above 1,900 still on the cards.
Hit the like button if you like it and share your charts in the comments section.
Thank you

Successfully upgraded to bring more value-added appearances, up Following the implementation of the Shapella upgrade on April 12, the cost of the ethereum network has risen significantly. Over the past 30 days, on-chain fees have increased by more than 153% from the previous $4.65 to the current average of $11.80 per transaction. This data highlights a significant increase in transaction-related costs on the ethereum network, indicating a significant increase in on-chain activity.
Over the past month, Ethernet network fees have increased significantly, with on-chain transfer fees increasing from $4.65 per transaction on April 1 to an average of $0.0064 ETH or $11.80. The data shows that the average cost of the ethereum network has increased by a staggering 153% in just 30 days. In addition, even the "medium protocol" fees are significantly higher, increasing 157% from $2.13 per transfer on the first day of April to the current level of $0.003 ETH or $5.49 per medium transaction.

ETH DownOn the monthly chart we are still bearish, on the weekly chart the attempt to extend the growth failed. Daily confirmed thoughts. Good opportunity to reload spot bags at the cheaper prices. BINANCE:ETHUSDT

Will Ethereum find sellers at market?Ethereum - 24h expiry - We look to Sell at 1876 (stop at 1926)
Previous resistance located at 1880.
Previous support at 1870 now becomes resistance.
Short term bias has turned negative.
Preferred trade is to sell into rallies.
We look for a temporary move higher.
Our profit targets will be 1756 and 1736
Resistance: 1830 / 1850 / 1880
Support: 1820 / 1805 / 1785
Please be advised that the information presented on TradingView is provided to Vantage (‘Vantage Global Limited’, ‘we’) by a third-party provider (‘Signal Centre’). Please be reminded that you are solely responsible for the trading decisions on your account. There is a very high degree of risk involved in trading. Any information and/or content is intended entirely for research, educational and informational purposes only and does not constitute investment or consultation advice or investment strategy. The information is not tailored to the investment needs of any specific person and therefore does not involve a consideration of any of the investment objectives, financial situation or needs of any viewer that may receive it. Kindly also note that past performance is not a reliable indicator of future results. Actual results may differ materially from those anticipated in forward-looking or past performance statements. We assume no liability as to the accuracy or completeness of any of the information and/or content provided herein and the Company cannot be held responsible for any omission, mistake nor for any loss or damage including without limitation to any loss of profit which may arise from reliance on any information supplied by Signal Centre.

ethusdteth is lokking bearish on weekly chart its on supply zone and we see a reaction and also on 4h chart become a petteren head and sholder that also bearish if its break its bearish confermation its my tought on ethusdt

Ethereum potential reversed price is 22002h time frame
-
Refer to the previous structure from Mar 27 to April 17
We can easily predict the next trend of ETH
Still have the potential to create harmonic pattern in near future.
With this analysis, timing to open short will be around 2200
Get ready for it!

ETH Upward Break Update ( 2 Scenarios )This is an update to my last Ethereum Post.
I was off a little on exactly when this was going to pop slightly but eventually did have an upward break!
Now we are faced with 2 scenarios that could happen.
Currently Ethereum is in an Upward Trending Channel on the 4hr chart and has recently tested the bottom of this channel.
Scenario 1:
Since price has already broken upward testing and failing at that key level I am looking for a strong retest and bounce back on the trend line.
This will determine whether it is going to break down or continue up and hopefully have enough power to go straight through this key level if the bulls really step in.
Looking back at Ethereum this key level seems to be a huge resistance level... If we can break this I am confident we will go to the Supply level or even the top of this channel!
Scenario 2:
Since we have already tested and failed this key level, price can go back down into this trend line failing a retest and is a clear bearish sign.
Once it does this it is possible for this to break below its support line and break down into the demand zone testing the bottom of this channel once again.
I will look for a retest on the support line once it has broken below then enter my trade.
As always trade safe and don't risk too much! Wait for confirmation!!!

1/ LeverFi weekly market summary 📰US economic growth slows sharply as interest rate hikes kick in with quarterly GDP growth down to 1.1%.
🎢 CRYPTOCAP:BTC had a rollercoaster week swinging between FWB:27K & $30K amidst bank struggles. Meanwhile, total locked ETH hit ATH this week.
2/ 🪙 6-week run of net inflows in digital assets ended as investors took profits last week following the rally. Most of the outflows were focused on Bitcoin.
That's a wrap!
Trade better now at 💻

ETH 1M candle The ETH monthly candle closes in 2 days and it looks like a pinbar will be formed,
what do you think? 🤔
I'm not sure about the 🟢 and I'm looking more for the 🔴 position

BTC/USDT 3DAY UPDATE BY CRYPTO SANDERS !!Hello, welcome to this ETHEREUM /USD update by CRYPTO SANDERS.
CHART ANALYSIS:-Ethereum (ETH) Ethereum is determined to not give up and has found good support at 1,800. Despite this show of force from buyers, ETH still lost 1.8% of its valuation this past week.
The current target and key resistance are at 2,000, which is a psychological level where the price was rejected in the past. Therefore, if buyers are successful in pushing this cryptocurrency higher, then they will likely face stiff resistance at that level
Looking ahead, Ethereum has managed to maintain its uptrend by making a higher high and a higher low. Market participants should only get concerned if the key support at 1,800 is lost. Unless that happens, ETH has a good chance to test the key resistance at 2,000.
Hit the like button if you like it and share your charts in the comments section.
Thank you

Current trend changes in ETH and where it is expected to goRational analysis: Generally speaking, it is still bearish. This wave of Bitcoin is not going to be done, and it is better to observe it. Before Bitcoin breaks through 30700, the real-name system is bearish. From the perspective of ETH, last night, it directly stepped back on 1780 points. This is a strong support band, similar to BTC's 26500 support band. Then it is bullish. But now it has risen to around 1900. Jumping up and down, long and short chips are chaotic. For the time being, ETH closed below 1920 today, and it will be bearish tomorrow. Take an inverted hammer. If it is above and does not exceed 1950 points, then there is a probability that there will be another wave of short-selling market. These days the risk is quite high, everyone pay attention to long and short risks. If there is profit, stop profit in time. Don't be greedy for space. Wait patiently for the main rhythm of the night. The current situation of retail investors is basically that there is no stop profit at high altitudes, and there is no stop profit at low long positions. Those who chase high and short will either be lost or quilt. This kind of chip structure can get out of the convergent state to wash the chips. The main force deliberately messed up the board to confuse technical players. In short, you are not losing money in this wave. After the market comes out, you will be the winner if you make a decision. It's just two days slower to win!

ETH/USD 1DAY UPDATE BY CRYPTO SANDERS !!Hello, welcome to this ETHEREUM /USD update by CRYPTO SANDERS.
CHART ANALYSIS:-Ethereum (ETH) was in the green as prices snapped a three-day losing streak.
After a low of 1,805.32 on Tuesday, ETH/USD rose to a peak of 1,919.72 at the start of the day.
As a result of this move, Ethereum has reached a five-day high, with the price now hovering around the 1,915 resistance.
The last time ETH bulls broke this ceiling was on April 13, and on this occasion, the price soared to an 11-month high above 2,100.
For something similar to happen in this round, the RSI would need to clear a barrier at the 53.00 level.
At the time of writing, the index is tracking at 51.64.
Hit the like button if you like it and share your charts in the comments section.
Thank you

Wait for the best time to buy and get the highest returnEth above pressure focus on 1940, 1950, 1980 can short waiting for entry tips ......
Btc61.8% rebound retracement level has been broken, focus on the starting point 30200, 30500 near the pressure, can short waiting for entry tips ......

ETH - Key Levels To Watch 👀What's up traders! In today's market breakdown, we're mapping out our latest levels to watch for on the ETH hourly chart.
No need to beat around the bush, let's dive right in...
Ticker: ETHUSDT
Date: 04/26/23
T imeframe: 1H
Key Levels:
Supply: 1935-1965 (1st red zone), 1990-2005 (2nd red zone)
Demand: 1800-1825 (green zone)
Other key levels: 1875-1890 (1st grey zone)
Commentary:
First Republic drama had cryptocurrency bulls gain back control of the market yesterday. However, Ethereum has come back to retest demand at 1800 today.
Ethereum pretty much satisfied the Bearish Scenario 2 from our last analysis on 04/23/23, except it found demand at 1800 rather than ~1770 - a big psychological level.
Currently, we are trading just under ~1875-1890 key zone and supply from the earlier this week that is being respected well. Here are a few trades we could target from here:
✅ Bullish Scenario 1: you want to see price pull back into the demand zone ~1800-1825 and buyers to emerge again for an upside move, possibly into ~1935-1965 supply or higher. Be cautious of the key zone around ~1875-1890 in this scenario. This is the safer upside play.
✅ Bullish Scenario 2: you want to see price trade above this ~1875-1890 zone, retest this zone and turn it into demand to catch a break and retest for an upside move, potentially into supply at ~1935-1965.
✅ Bullish Scenario 3: you want to see price rally and break supply at ~1935-1965, pull back into it to turn it into demand and find strength again for a move into next supply at ~1990-2005.
------
🟥 Bearish Scenario 1: you want to see price approach supply at ~1935-1965, sellers to regain control and possibly catch a break and retest of this supply zone into the key zone ~1875-1890 or demand at ~1800-1825. This will be the safer downside play.
🟥 Bearish Scenario 2: you want to see price reject here at ~1875-1890 for a move into ~1800-1825 demand.
🟥 Bearish Scenario 3: you want to see price break demand at ~1800-1825, retest and turn this zone into supply for a further downside move into ~1770.
That's all we got for you in this one.
So what do you think? Are you bullish or bearish on ETH?
Let us know in the comments below!
We'll see you in the next one.
-The AlgoBuddy Team

Dallas Fed manufacturing survey shows slowing US economic growthThe Dallas Fed's April manufacturing outlook survey indicated that the first quarter performance was in line with expectations, with all markets weakening except for the auto market. There are signs that inventories in the auto industry are rapidly increasing, so growth in the auto market is expected to weaken soon. There are no concerns about long-term demand, other than a significant macroeconomic slowdown. Excess inventories are expected and usually take three to six quarters to be depleted to meet end demand. Economic growth has slowed significantly and new orders have almost stopped.

ETH(based on NEo wave) long term2this is the second way that eth can choose, it will determin with the volume of this wave if its low this might be happen.

ETH-BTC - LONG SETUPIf you want to swap your btc into eth, just wait for a confirmation ( breakout of the trend )
You have in the chart wehere to enter with long , buy or swap.

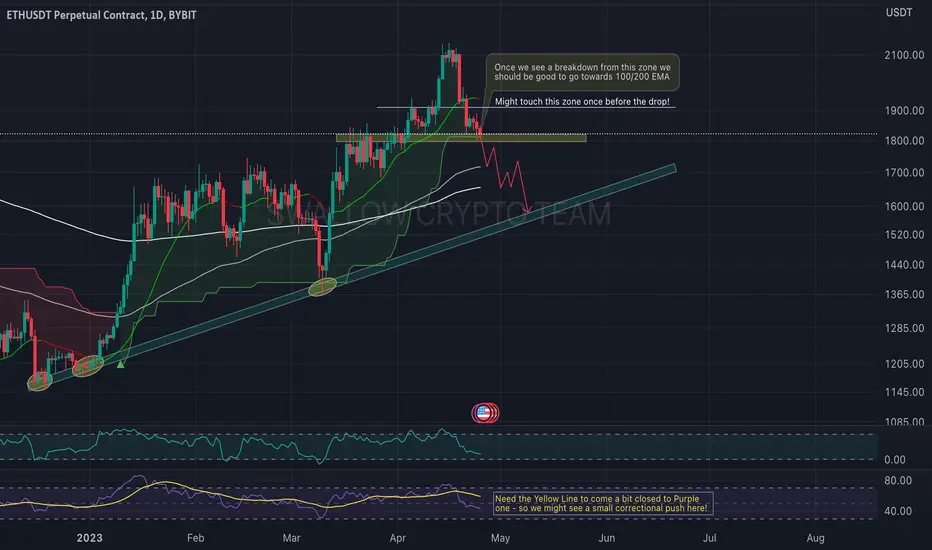
ETH/USDT currently looking weak Hey traders 👋
Let's start this day with ETH analysis here on daily chart. We witnessed a nice rejections which we have been talking about for some time now. Price broke our "supertrend" here and RSI had a nice turnover but we see a last push to happen here after what we might see a nice drop to lower trend line (Greenish zone).
What we will do here is to wait for that Yellow zone to be broken and secured from where we will be more certain that price will go for those EMAs!
If you like ideas provided by our team you can show us your support by liking and commenting.
Yours Sincerely,
Swallow Team 🔱
Disclamer:
We are not financial advisors. The content that we share on this website are for educational purposes and are our own personal opinions.
eth failed to break the resistanceETH failed to break the resistance, so it has two ways to go which I have shown on the chart with (1) and (2)

Do Engulfing Candles Work? 🤨Yes Engulfing Candles work but it depnds on the context. If are at either a Weekly, Daily or 4Hr level then I will have more confidence in my entry. If not then we may just be selling into momentum and getted rekt while price goes the other way and we weep as our ego suffers. We have a minor zone at 1880 but nothing more than that, at least considering what is relevant personally. However, we have had sustained bearish pressure on the higher TF's such as the Daily/Weekly and appear to be printing solid engulfing candles on those timeframes. 1 More day for the weekly candle to close. I can observe price potentially returning to the lows for more liquidity around 1840
and going into a range. If not then candlestick patterns dnt wrk and that's why we always stick to combining confluences, and considering context before entering after a candlestick pattern. Thinking more range before we see 1942 again.

