Short ETH/USDTAfter the weekend, institutions will be selling
Everyone knows the situation about USDC CIRCLE AND banks
Therefore, we can withdraw liquidity from the top and go down
Ethshort

ETH: Waiting for a rebound opportunity to go shortETH: Judging from the 4-hour chart, the market has shown a three-wave downward structure, of which the third wave has been extended, and the continuous strength of the bears is still continuing. In terms of operating ideas, the market continues to rebound and short.
ETH: 1480-1500 empty, near the target 1370
In order to facilitate everyone to continue to follow up on my analysis and sharing, you can like and follow me; in addition, I will share the daily real-time strategy in the channel. If you can't follow up in real time, you may make operational errors.You can use the following methods to enter my channel for free to follow the latest news and follow up on market trends in real time.

ETH/USD 1DAY UPDATE BY CRYPTO SANDERS !!Hello, welcome to this ETHEREUM /USD update by CRYPTO SANDERS.
CHART ANALYSIS:-Ethereum (ETH) was also significantly higher to start the weekend, as prices rose back above $1,400.
Following a two-month low at $1,378.53 yesterday, ETH/USD moved to a peak at the $1,481.32 level on Saturday.
The move comes as ethereum bulls bought yesterday’s dip, as price strength moved deep into oversold territory.
Friday saw Ethereum’s RSI fall to 28.30, which was its weakest point since last June, however, the index has since rallied.
As of writing, it is now tracking at 32.26 and appears to be heading towards a long-term floor at 34.00.
Should it reach this point, there is a strong possibility that ethereum will be back above $1,500.
I have tried to bring the best possible outcome to this chart.
Hit the like button if you like it and share your charts in the comments section.
Thank you

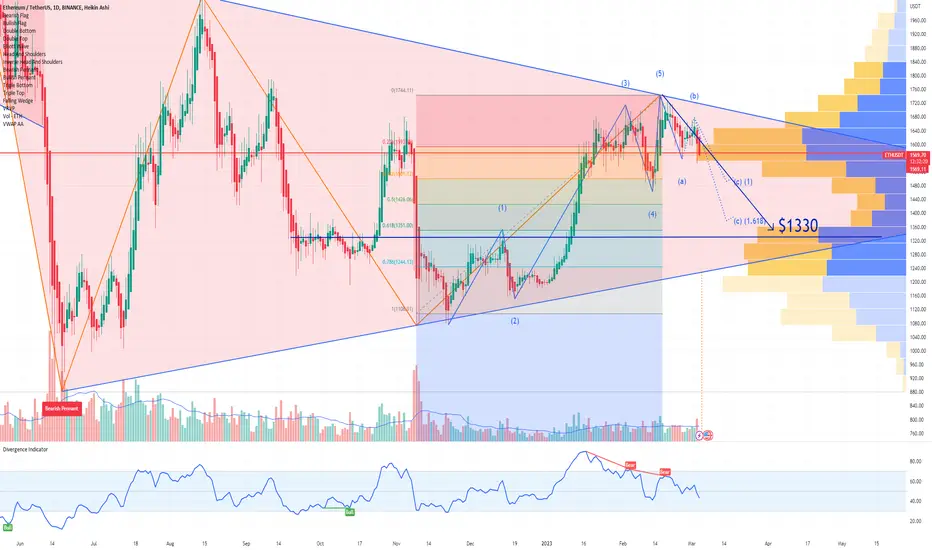
ETH Ethereum Bearish Chart PatternsEthereum Chart presents 2 bearish divergencies inside of a Bearish Pennant.
Considering also the Elliot Waves price target and the Fibonacci retracement tool, i assume Ethereum will reach $1330 soon.
Looking forward to read your opinion about it.
ETH MXN still in it's lowestWe are expecting an almost -10% drop with a little adjustment in for some 2-4 days in a 4h chart.
It's maximum drop will get eth to -20% in case it breaks all technical indicator's rules.
Recommendations: Since we are not even in half of the month (March) I suggest not
entering even in Spot, let's wait for Marubozu candlestick patters to check its volume with MCVR.

ETH/USD 1DAY UPDATE BY CRYPTO SANDERS !!Hello, welcome to this ETHEREUM /USD update by CRYPTO SANDERS.
CHART ANALYSIS:-Ethereum (ETH) Friday's session was also much lower, with market volatility also high due to the non-farm payrolls report this afternoon.
It is expected that 205,000 jobs were added to the US economy last month, down from January's total of 517,000.
The decline could act as an overall positive, as the Federal Reserve could raise rates less aggressively depending on the outcome.
ETH/USD fell to a low of $1,378.53 earlier in the session, which comes a day after trading at a peak of $1,543.69.
Overall, ETH is now down about 10% over the past week, with today's drop taking the price to its weakest point since mid-January.
As a result of this selloff, the RSI is now tracking at 28.30, which is its weakest point since last June.
I have tried to bring the best possible outcome to this chart.
Hit the like button if you like it and share your charts in the comments section.
Thank you

ETHUSDT Pennant Inverse head and shoulders.Ethereum is following our inverse head and shoulders scenario. We are still bullish on the crypto market, mid-term.

ETH is Going to Bearish sideETH/usdt is Bearish and good sell zone for shorting
every zone is marked on chart
please reasearch yourself and not trading advise

ETH/USD 1DAY UPDATE BY CRYPTO SANDERS !!Hello, welcome to this ETHEREUM /USD update by CRYPTO SANDERS.
CHART ANALYSIS:-Ethereum (ETH) also remained in the red in today’s session, registering a third consecutive drop in price.
ETH/USD moved to a low of $1,530.43 earlier in the day, which comes less than 24 hours after hitting a high of $1,563.41.
Similar to bitcoin, this drop resulted in the world’s second-largest cryptocurrency slipping to its weakest level since mid-February.
Overall, ethereum is down nearly 7% in the past seven days, and this comes as the 10-day (red) moving average extended a crossover of its 25-day (blue) counterpart.
the RSI is also tracking at a multi-month low at 40.57, which was last hit on December 19.
Should this trend continue, there is a strong possibility that ETH could fall to a floor of $1,500.
I have tried to bring the best possible outcome to this chart.
Hit the like button if you like it and share your charts in the comments section.
Thank you

ETH VS EMA 100ETH 1D
If price bellow ema 100, eth structure will full of bearish.
And a double top pattern will activate.
Just watching and wait n see for now!

ETH:The analysis of ETH's future market situation is as followsETH as a whole is still in a wide range of oscillations at the daily level. Technically, ETH failed to break through the 1590 position, and a new bearish reaction appeared after forming a high near 1583.It fell sharply below the levels of 1550 and 1540.The low formed near 1535.The daily chart is suppressed by the moving average of technical indicators, and the opening of the Bollinger band is downward, the overall market of Ethereum is still running short.
At the small level, the current small-level rebound market is under pressure near 1565. This position happens to be the intersection of the short-term moving average of the 20th and 30th moving average, which plays a role in the market. The market is under pressure, and with the current technology showing kinetic energy, it is difficult to support the rise of Ethereum and make a breakthrough, so the top is currently facing two suppression levels, one is near 1565, and the other is the high point 1590 that has not been effectively broken through recently. Therefore, from this point of view, Ethereum is still in a weak and volatile market. If it is delayed and cannot effectively break through the above two resistance levels, it will be difficult to support the rise of Ethereum and make a breakthrough. Therefore, the top is currently facing two suppression levels, one is near 1565, and the other is the high point 1590 that has not been effectively broken through recently. Therefore, From this point of view, Ethereum is still in a weak and volatile market. If it is delayed and cannot effectively break through the above two resistance levels, when If the kinetic energy is exhausted, a new round of falling markets may begin.
So in terms of operation, Ethereum can enter with empty orders near 1583-1590, below the target level of 1540.
In order to facilitate you to continue to follow up on my analysis and sharing, you can like and follow me. In addition, you can enter my channel for free in the following ways to follow real-time views and operational strategies.
BINANCE:BTCUSDT BINANCE:ETHUSDT BITSTAMP:BTCUSD BITSTAMP:ETHUSD COINBASE:BTCUSD COINBASE:ETHUSD

ETHUSDTPEthereum Price Prediction Tomorrow, Weak And Month
Shark Pattern on Ethereum
Ethereum (ETH) has been making banner in the cryptocurrency world with its recent surge in price attracting the attention of all traders and investors. While the market for ETH remains volatile there are some indications of that a Bearish trend may be on the horizon. In particular a potentially bullish shark pattern is developing on Ethereum with almost 4 legs confirming the pattern but D leg is not confirmed yet but we can see the D leg is developing nicely and its on the way.
The shark pattern is a lesser g known chart pattern in technical analysis but one that can be quite powerful when it does occur. It is a variation of the more well known harmonic patterns such as the butterfly and the bat. Like these patterns the shark pattern is based on Fibonacci ratios and can signal a potential reversal in the price trend.
In the case of Ethereum, the shark pattern is developing with almost 4 legs. If we calculate X - A for B leg is at the 0.382 Fibonacci retracement level and the C leg is precisely at the 1.13 Fibonacci extension level. The potential reversal zone for the pattern could be at the 0.886 Fibonacci retracement so potential target for the pattern expected at $1148.
For Analysis visit our website

eth short tp1 remains $1520similar to btc, short tp1 target remains 1520. expecting consolidation there and potential move up for swing wave b of wave 2.
wave 2 completion remains 1350 zone.

Financial Wave. ETHOur priority scenario in ETH is a decline in wave (ii) to $1487, possibly lower to $1408. In case of a rise above $1,600, this scenario will change.

ETH/USD 1DAY UPDATE BY CRYPTO SANDERS !!Hello, welcome to this ETHEREUM /USD update by CRYPTO SANDERS.
CHART ANALYSIS:-Ethereum (ETH) remained mostly volatile during Monday’s session, as prices remained largely unchanged.
ETH/USD fell to a bottom at the $1,557.36 mark to start the week, a day after trading at a peak of $1,574.23.
This drop sees ethereum trade in the red for a fifth consecutive session, with its market cap down 5% within that period.
The 10-day (red) moving average has also moved below its 25-day (blue) counterpart, with support at $1,560 preventing further falls.
Additionally, the RSI has collided with a floor at 44.00, and as of writing, the index is slightly above this mark, with a reading of 44.28.
Should this area eventually give way, there is a good chance that ETH could fall below $1,500 this week.
I have tried to bring the best possible outcome to this chart.
Hit the like button if you like it and share your charts in the comments section.
Thank you

ETH ATH after 80$ No one going to believe it, but it is what it is. To go higher price have to take out buyers that have they orders below equal lows, this is how market operate. Liquidity is the main reason why we will see ETH at 80$
Not a financial recommendation.

#ETHUSD - Swing Down to Recent Lows Before Moving Up Again?Looks like #ETHEREUM is about to to clear some smiles from the bulls as it descends around 30% to meet recent support levels.
There'll be a few swings in this descent where shorter term traders could bag multiple profits up and down, but our forecast for the next month or two most definitely red!
_________
What Do You Think?
If you enjoyed or agree with this idea - drop us a comment, like & follow! 😀
Ideas by theCrypster meet the guidance notes and disclaimer as mentioned below and within our website. See Signature for more info! ✌️
🔥🔥🔥
Crypto Tipster v2
theCrypster
🔥🔥🔥

ETH/USD 1DAY UPDATE BY CRYPTO SANDERS !!Hello, welcome to this ETHEREUM /USD update by CRYPTO SANDERS.
CHART ANALYSIS:-Ethereum (ETH) also significantly fell in today’s session, dropping below the $1,600 mark.
Following a high of $1,652.43 on Thursday, ETH/USD moved to a bottom at $1,553.85 earlier in the day.
Today’s drop has pushed the world’s second-largest cryptocurrency to its weakest level since February 15.
As projected earlier in the week, a move towards $1,550 was already on the cards, as the 10-day (red) moving average neared a downward cross with the 25-day (blue) moving average.
The RSI has also contributed to the sell-off, with the index falling below a recent support point of 49.00.
Currently, the price strength on ETH is at 44.51, which is marginally above the next support at 44.00.
I have tried to bring the best possible outcome to this chart.
Hit the like button if you like it and share your charts in the comments section.
Thank you

ETHThinking ETH will keep grinding higher while BTC corrects. If you watch ETH longs on Bitfinex you can clearly see that longs are at very low levels. While watching BTC longs on Bitfinex we can see that the trend is parabolic and bitcoin longs are just full ape mode.
Would make sense as well since many alts are lagging the huge BTC move off the $15K lows. Unless you altcion bag has the words AI in their coin summary bio , well then you likely missed most of the Jan- Feb pump.

ETH/USD 1DAY UPDATE BY CRYPTO SANDERS !!Hello, welcome to this ETHEREUM /USD update by CRYPTO SANDERS.
CHART ANALYSIS:-Ethereum (ETH) also erased Wednesday’s gains, with the world’s second-largest cryptocurrency failing to break a ceiling of its own.
Following a high of $1,672.05 on hump day, ETH/USD dropped to a bottom of $1,635.85 earlier in Thursday’s session.
The move occurred as ethereum buyers were not able to push the price above resistance at $1,675 during yesterday’s rally.
As a result, bears reentered the market, further intensifying the downward momentum of the 10-day (red) moving average.
Currently, the trend line is fast approaching its 25-day (blue) counterpart, with a downward cross inevitable.
In addition to this, the RSI, which is tracking at 51.82, appears to be en route to a floor at 49.00, which could push ETH below $1,600.
I have tried to bring the best possible outcome to this chart.
Hit the like button if you like it and share your charts in the comments section.
Thank you

ETH Bearish 15MinuteWe just witnessed a significant sweep out of liquidations from yesterday's area, but we failed to reach a new high with a full body candle, indicating that it was likely only a stop loss hunt. My short position's interest area is marked.

ETH/USD 1DAY UPDATE BY CRYPTO SANDERS !!Hello, welcome to this ETHEREUM /USD update by CRYPTO SANDERS.
CHART ANALYSIS:-Ethereum (ETH) also raced higher on hump-day, as prices once again moved above $1,650.
ETH/USD raced to a high of $1,658.69 earlier today, less than 24 hours after nearly falling below $1,600.
As a result of this surge, the world’s second-largest cryptocurrency climbed to its strongest point since last Thursday.
Additionally, price strength has also risen past a ceiling at the 53.00 mark, with the index tracking at 54.68 as of writing.
Despite this, the 10-day (red) moving average still seems set to crossover its 25-day (blue) counterpart, which could prompt an upcoming sell-off.
Should this cross occur, there is a possibility that ETH could fall toward a floor at the $1,550 mark.
I have tried to bring the best possible outcome to this chart.
Hit the like button if you like it and share your charts in the comments section.
Thank you

2023_03_01 ETH 1H Retracement or Reversal ?we saw tday a big push upwards on ETH, is it all about to collapse intermediate term ? BIAS on higher timeframe showing me a retracement back to $1540 area first in the next few days.
What do you guys think ?
