ETH to $3700 Before a Major Bounce?Ethereum has been showing signs of exhaustion after its recent rally. I'm watching the $3700 level closely — it's a key support zone that has acted as both resistance and support in the past.
🟦 If ETH pulls back to this area, I expect it to find strong buying interest, potentially leading to a significant bounce and continuation of the bullish trend.
📌 Scenario I'm Watching:
🔻 Pullback to the $3700 support zone
📉 Shakeout or stop hunt below previous lows
💚 Followed by a strong bullish reversal — possible move toward $4000+
Why $3700?
Confluence of previous highs/lows
Psychological round number
Potential liquidity pocket
Not Financial Advice!
This is a scenario I'm tracking, not a guarantee. As always, wait for confirmation (e.g. bullish engulfing, RSI divergence, volume spike) before jumping in.
📉 If $3700 fails decisively, I'll reassess — next support likely around $3550–3600.
Ethshortsetup

ETH Just Lost Key Support — Next Stop: $2,879?Ethereum (ETH) appears to be losing steam on the 4-hour chart as it fails to sustain above the critical $3,860 resistance level. After a strong rally, the price structure has started showing signs of exhaustion — the previous bullish momentum has clearly stalled, and ETH is now forming lower highs and lower lows. This breakdown marks a potential shift in trend, especially considering the clean rejection from $3,860 with several upper-wick rejections signaling aggressive selling pressure.
The green ascending trendline, which supported ETH throughout its recent rally, has been breached. Price has broken below the trendline and is now moving in a declining structure highlighted by the recent bearish wave. Sellers have stepped in, and the most recent candles indicate a bearish continuation setup forming just below a failed support-turned-resistance near $3,533.
There’s a visible trade setup taking shape:
• Entry: $3,530–$3,550 (post-retest of broken trend support)
• Stop-loss: $3,650 (above recent local highs)
• Target 1: $3,200 (key support level)
• Target 2: $2,879
• Target 3 (extended): $2,635 if downside pressure intensifies
This short setup offers a solid risk-reward ratio, especially if momentum accelerates below $3,500. The sell signal seen earlier aligns with this potential reversal zone, and unless ETH reclaims $3,650 with volume, the bears look likely to stay in control.
In summary, ETH on the 4H timeframe is now trading below major support, with a bearish structure, trendline breakdown, and rejection at resistance — all aligning for a short-biased move in the coming sessions. Any bullish invalidation would require ETH to push and close above $3,650 convincingly. Until then, the path of least resistance appears downward.

ETHEREUM AT A CRUCIAL INFLECTION POINT:CRYPTOCAP:ETH has been grinding just below a major resistance zone (~$2,850) after breaking out of a long-term descending channel.
This is the final barrier before a potential rally towards $4,000.
What to Watch:
Resistance: ~$2,850
Break above = momentum likely to accelerate
Rejection = possible pullback to retest breakout zone (~$2,400–$2,200)
Structure is strong, but confirmation is key. Bulls must clear this ceiling with volume.
Patience. React to a breakout or rejection — don’t front-run.

"ETH Breakout Watch: Holding Support for a Push Toward $1900+"ETH 4H chart par price apne key support (purple box) ke upar consolidate kar raha hai. Jab tak yeh support hold karta hai, $1900 - $1920 ka target active rahega.
Agar support toot jata hai to next major demand zone 1660-1680 ke aas paas hai. Tab tak structure bullish hai.
Trading plan simple hai:
✅ Support hold = Buy dips for $1900+
❌ Support breakdown = Wait for lower entries.
Chart clear path dikhata hai, risk manage karte raho! 🚀

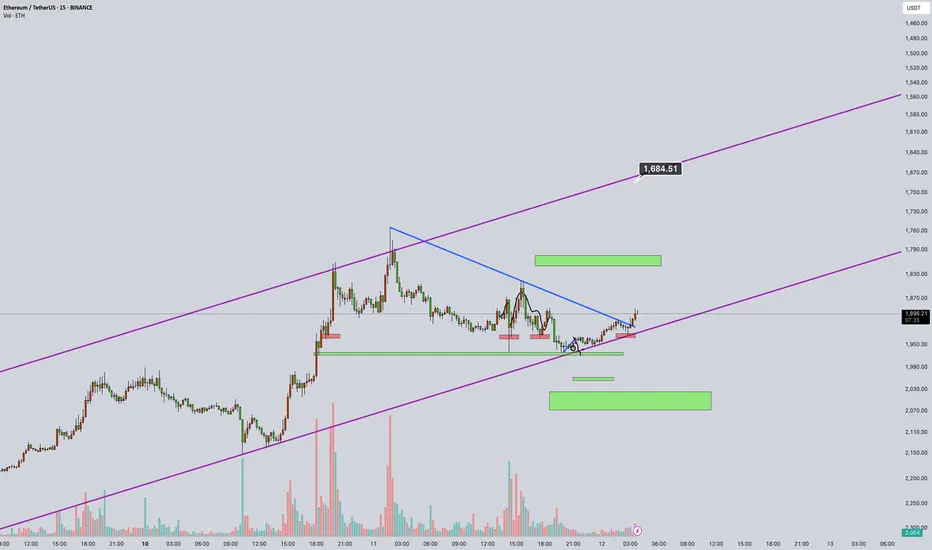
ETHEREUM ( SHORT TERM )Hello crypto community!
In this analysis, I’ve examined the Ethereum (ETH/USDT) 15M chart by inverting it.
It’s 12 March 2025, exactly 5 years since 12 March 2020, when Bitcoin crashed 55% in a single day, marking the “Black Thursday” that shook the market.
Now, the ETH chart shows the purple trendline as resistance (inverted to 1,684 USD) and green zones as support (inverted to 1,500-1,600 USD).
The pattern suggests a potential downturn; a break below the blue line could trigger a sharp pullback. Volume has risen by ~20% in the last hour, supporting this move.
Potential Scenario:
If resistance at 1,684 holds, the price may test support at 1,500-1,600, with a possible drop to 1,400. While not as severe as the 12 March 2020 crash, this week calls for caution. As a spot trader, I’m planning positions around the 1,600-1,500 range.
What do you think? Will ETH drop, or will the bull run continue? Share your thoughts below! 📉📈
ETHUSDT Buy 📢 ETHUSDT Buy Signal 📢
🟢 Buy: After a pullback to the trendline ✅
🔹 Entry Level: 2,663.53 USDT
🔹 Target 1: 2,973.46 USDT 🎯
🔹 Target 2: 3,368.06 USDT 🚀
🔻 Stop Loss: 2,434.30 USDT ⛔
⚠ Risk management is essential! 📊
💡 Analysis is based on the breakout of the downtrend line and a potential bullish move.

#ETH/USDT#ETH
The price is moving in a descending channel on the 1-hour frame and is expected to continue upwards
We have a trend to stabilize above the moving average 100 again
We have a descending trend on the RSI indicator that supports the rise by breaking it upwards
We have a support area at the lower limit of the channel at a price of 3300
Entry price 3340
First target 3387
Second target 3464
Third target 3556

ETH IdeaEth pair has formed a double top pattern and broke the neckline
Retested and got rejected
so we're in a short (sell) position
our take profit will be the 0.76 fib retracement which will be our support zone
once it get reject we can enter a long position with targeting a new high
Follow us for more updates on pairs

eth ethereum"🌟 Welcome to Golden Candle! 🌟
We're a team of 📈 passionate traders 📉 who love sharing our 🔍 technical analysis insights 🔎 with the TradingView community. 🌎
Our goal is to provide 💡 valuable perspectives 💡 on market trends and patterns, but 🚫 please note that our analyses are not intended as buy or sell recommendations. 🚫
Instead, they reflect our own 💭 personal attitudes and thoughts. 💭
Follow along and 📚 learn 📚 from our analyses! 📊💡"

EthUSD update Daily Ethereum update DYOR!!
Hey guys lonf time no see!!
I think it's ETH price drop will not finished.

#ETH/USDT#ETH
The price is moving in a descending channel on the 1-hour frame and sticking to it well
We have a bounce from the lower limit of the descending channel and we are now touching this support at a price of 2452
We have a downtrend on the RSI indicator that is about to be broken, which supports the rise
We have a trend to stabilize above the moving average 100
Entry price 2525
First target 2613
Second target 2686
Third target 2771

ETH (Crypto ETHEREUM) SELL TF H4 TP = 2286.86On the H4 chart the trend started on Sept. 27. (linear regression channel).
There is a high probability of profit taking. Possible take profit level is 2286.86
This level, which I have outlined above, is certainly not a “finish” level. But it is the level that has the “highest percentage of hits on target.”
Using a trailing stop is also a good idea!
Please leave your feedback, your opinion. I am very interested in it. Thank you!
Good luck!
Regards, WeBelievelnTrading

Ethereum - Looking To Sell Pullbacks In The Short TermH1 - Bearish trend pattern
Currently it looks like a pullback is happening.
Until the two strong resistance zones hold I expect the price to move lower further after pullbacks.

ETHUSDTEthereum analysis
Weekly and daily time frame
Ethereum was bearish on the weekly supply area and bearish on the daily time frame. I expect the price to correct to the daily demand area and the weekly Medline trading range and then start to grow again.

ETHUSD Pair : ETHUSD ( Ethereum / U.S Dollar )
Description :
Break of Structure
Consolidation Phase in Short Time Frame
RSI - Divergence
Completed " 12345 " Impulsive Waves and " ABC " Corrective Waves
Demand Zone

Ethereum downside or breakout?Watching Ethereum (ETH) closely after it reached a high of $3,040 on a 4-hour timeframe chart today.
If support at $2,923 crumbles. A break below this level could send ETH down to $2,874.
However, there's also a chance for a breakout on the upside. If Ethereum can overcome resistance at $3,100, it could surge towards $3,160 or even $3,200.

ETHUSD IDEARisk warning, disclaimer: the above is a personal market judgment based on published information and historical chart data on Tradingview, all analysis is only subjective. Hope investors consider, I am not responsible for your investment decision. Thank you.
Good luck!

ETHUSD #ETH / #ETHUSD #ETHUSDT Gartley Pattern 🦇 - Daily Frame
ETHUSD #ETH / #ETHUSD #ETHUSDT
Gartley Pattern 🦇
- Daily Frame
#This is my technical opinion and not a recommendation to buy or sell

ETH: sell in best level📊Analysis by AhmadArz:
🔍Entry: 3137
🛑Stop Loss: 3182
🎯Take Profit: 3110 - 3086 - 3041 - 2986
🔗"Uncover new opportunities in the world of cryptocurrencies with AhmadArz.
💡Join us on TradingView and expand your investment knowledge with our five years of experience in financial markets."
🚀Please boost and💬 comment to share your thoughts with us!

ETHEREUM / ETHUSDTLet's see...
Good Luck >>
• Warning •
Any deal I share does not mean that I am forcing you to enter into it, you enter in with your full risk, because I'll not gain any profits with you in the end.
The risk management of the position must comply with the stop loss.
(I am not sharing financial or investment advice, you should do your own research for your money.)

ETHUSDPair : ETHUSD ( Ethereum / U.S Dollar )
Description :
Completed " 12345 " Impulsive Waves and " A " Corrective Waves
Break of Structure
RSI - Divergence
Bullish Channel as an Corrective Pattern in Short Time Frame with Breakout of Lower Trend Line and Retracement
Impulse Correction

Daily Ethereum Update - March 5, 2024Since yesterday CRYPTOCAP:ETH has been showing more strength relative to Bitcoin, which is interesting since the spot ETH ETF was delayed yesterday and should have been bearish for ETH's price action. I think ETH is making some upward progress to the $3,944.66 price target discussed in previous updates.

ETH → Ethereum Falling to $2,200!? A Prime Short Opportunity!Ethereum has reached the Resistance Zone at $2,850 and has shown the first signs of resistance. Should we enter a short?
How do we trade this? 🤔
The conditions are such that we should be looking for a short entry. We have three pushes up since the start of the last bull leg from $2,200, a strong Resistance Zone at the current price, and an RSI that is overbought at 78.00. We are in the potential short territory but need the sell signal and confirmation prior to entering a short.
Wait for the price to fall sharply and watch the candles after. It's likely we'll get a re-test of the $2,850 area before another sell bar occurs. Once that sell bar occurs, a 1:2 Risk/Reward Ratio is available to us if we enter the market at around $2,825. Set your stop loss into the Resistance Zone above the previous high and target 1:2 R/R for a take profit in the $2,350.
💡 Trade Idea 💡
Long Entry: $2,825
🟥 Stop Loss: $3,025
✅ Take Profit: $2,350
⚖️ Risk/Reward Ratio: 1:2
🔑 Key Takeaways 🔑
1. We have three pushes up since the start of the last bull leg from $2,200
2. Early signs of resistance at the current level
3. Strong Resistance Zone at the current level
4. Gap to the Support Zone
5. RSI is overbought at 78.00 and above the Moving Average, supporting the drop in price
💰 Trading Tip 💰
The longer a trend continues after 3 legs, the probability of that trend continuing lessens. Because of this decreased probability, we ought to reduce our risk when entering trades.
⚠️ Risk Warning! ⚠️
Past performance is not necessarily indicative of future results. You are solely responsible for your trades. Trade at your own risk!
Like 👍 and Follow to learn more about:
1. Reading Price Action
2. Chart Analysis
3. Trade Management
4. Trading Psychology
