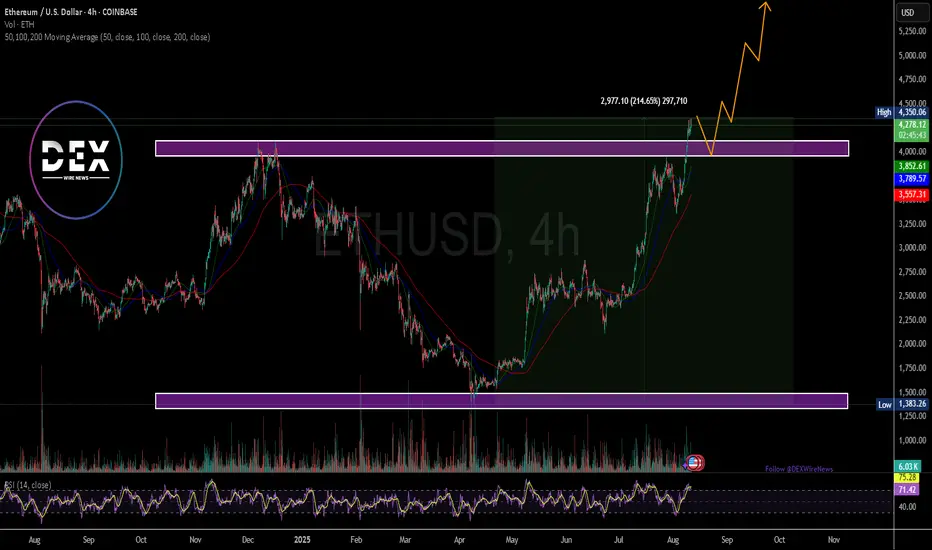
Breaking: Ethereum Is Set To Reclaim the $5k Price Pivot The price of the notable Altcoin- Ethereum ( CRYPTOCAP:ETH ) is set to reclaim the $5k resistance amidst growing interest and buying momentum.
For the past 3 months Ethereum ( CRYPTOCAP:ETH ) spiked 200+% breaking out from a cup and handle pattern amidst growing interest ikn the Ethereum chain.
Crypto Pundits on X, LinkedIn and Discord envisage the influx of memecoins on the Ethereum ( CRYPTOCAP:ETH ) chain- while most skeptics think the layer 1 blockchain is dead, Ethereum's sojourn to the $5k pivot is just days away as popular folks like Eric Trump the son of the present president of USA hints on investor's to buy Ethereum's dip.
As of the time of writing, CRYPTOCAP:ETH is up 0.58% already breaking the $4k resistance trading at $4276. With the Relative strength Index (RSI) at 71, CRYPTOCAP:ETH is on the verge of reaching overbought region. CRYPTOCAP:ETH might experience a respite before picking momentum up.
Ethsignals

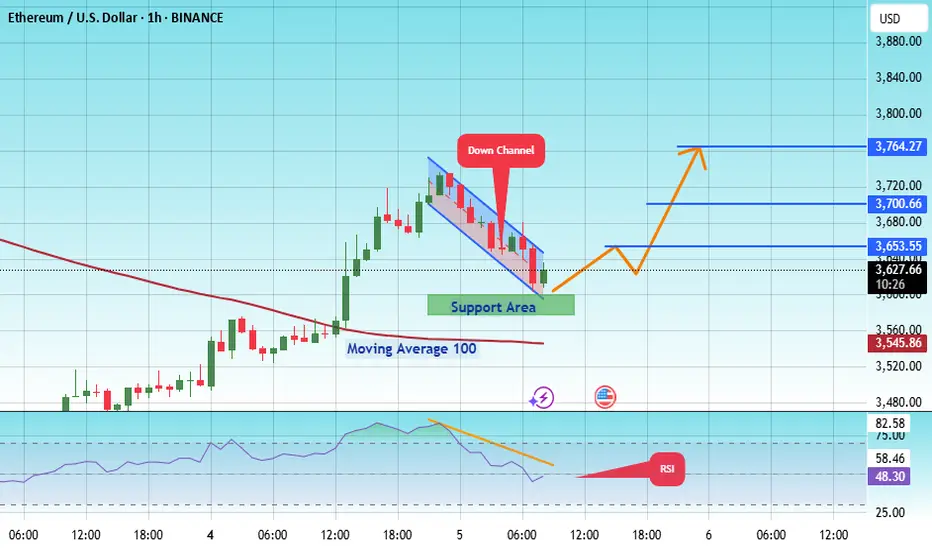
#ETH/USDT : Price is going as expected in previous ideas on eth#ETH
The price is moving within an ascending channel on the 1-hour frame, adhering well to it, and is on track to break it strongly upwards and retest it.
We have support from the lower boundary of the ascending channel, at 3593.
We have a downtrend on the RSI indicator that is about to break and retest, supporting the upside.
There is a major support area in green at 3582, which represents a strong basis for the upside.
Don't forget a simple thing: ease and capital.
When you reach the first target, save some money and then change your stop-loss order to an entry order.
For inquiries, please leave a comment.
We have a trend to hold above the 100 Moving Average.
Entry price: 3626.
First target: 3653.
Second target: 3700.
Third target: 3764.
Don't forget a simple thing: ease and capital.
When you reach your first target, save some money and then change your stop-loss order to an entry order.
For inquiries, please leave a comment.
Thank you.
Ethereum (ETH) Price Hits 3.5 Year High; Nears ATH Of $4,891BINANCE:ETHUSDT is approaching a significant milestone in August, trading at $4,182, a 3.5-year high . The altcoin breached the $4,000 mark over the weekend, setting its sights on the next target of $4,891. This strong upward momentum suggests Ethereum could make history if it sustains its growth.
At $4,303, BINANCE:ETHUSDT is 17% away from its all-time high (ATH) of $4,891 . To reach this ATH, ETH must first secure $4,500 as a stable support level. A successful consolidation above this threshold could set the stage for ETH to continue its bullish ascent towards the ATH.
However, if investor sentiment shifts and selling pressure increases, BINANCE:ETHUSDT could struggle to maintain its position above $4,000 . A decline below this level would invalidate the bullish outlook, potentially reversing the recent gains and sending ETH lower.

buy signal for eth I'm completely sure CRYPTOCAP:ETH will hit 9500 $
Same chart with CRYPTOCAP:BTC
I'm just waiting for the confirmation " source break " on eth, and u will see .. easiest 100% investment
#eth #btc #bitcoin #Ethereum #crypto

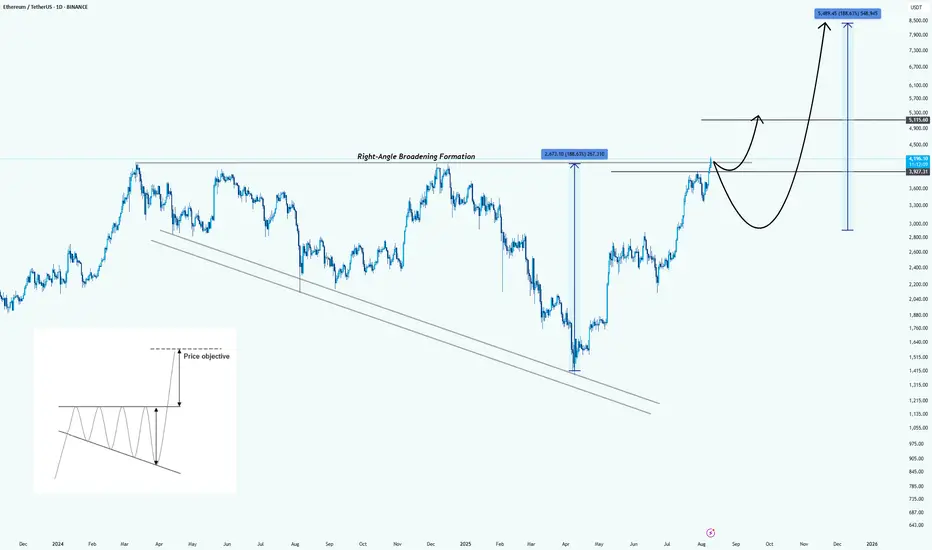
Ethereum: Formed a Right-Angle Broadening FormationHello guys!
Pattern Identified:
This is a Right-Angle Broadening Formation (characterized by a flat resistance level at the top (around $4,200 – $4,300) and a rising lower trendline). It shows increasingly volatile swings upward while repeatedly testing the same ceiling.
Technical Implication:
RABFs are typically bullish continuation patterns. The flat top acts as a breakout trigger, while the rising base indicates consistently higher lows and aggressive buyer support.
Price Objective:
According to the pattern’s measured move principle, the breakout target is projected by the vertical height of the formation, added to the breakout point:
Height : $2,070
Breakout point : $4,300
Target : $6,370 (first objective)
Extended bullish run could reach $8,500 if momentum sustains.
Key Levels:
Resistance: $4,200 – $4,300 (breakout trigger)
Support: $3,700, then $3,200
First measured target: $6,370
Extended target: $8,500
Bullish Scenario:
Strong daily close above $4,300 with volume could kickstart a rapid move toward the first target, possibly with only a brief consolidation at $5,100 before continuation.
ETH Continues Bullish Momentum Above Broken TrendlineHello guys!
Ethereum has shown a strong bullish rally, breaking through a long-standing descending trendline with significant momentum. Currently, price action is consolidating above the broken trendline, which may now act as a support zone.
🔹 Scenario 1 (Bullish Continuation): If ETH holds above the current range and confirms the broken trendline as support, we could see a continuation toward higher resistance levels around $3,500 and beyond.
🔹 Scenario 2 (Deeper Retest): Alternatively, a pullback toward the $2,200–$2,300 area (highlighted zone) could offer a better accumulation point before the next bullish leg resumes.
This setup suggests that as long as ETH remains above the key support levels, the bullish structure remains intact.

ETHUSDTBINANCE:ETHUSDT is overall trend in the 4-hour timeframe is bullish, with strong buying momentum. The price is currently at the 4200 USD resistance, and if this level breaks, the next target will be around 4500 USD.
Supports:3950 USD, 3730 USD, 3350 USD
Resistances: 4200 USD, 4500 USD
⚠️Always apply proper risk management.

ETH Don’t Miss Out!!!
**🚀 ETH WEEKLY TRADE IDEA — \$4K BREAKOUT WATCH**
📈 **Market Bias:** Bullish (Long-term uptrend intact, ETH above key MAs)
⚠ **Short-Term Risk:** MACD bearish crossover + RSI overbought → possible pullback before breakout
📊 **Key Level:** Testing **\$4,000** psychological resistance
**🛠 Setup:**
* **Direction:** LONG
* **Entry:** \$3,966.12
* **Stop Loss:** \$3,900 (below key support)
* **Take Profit:** \$4,050 (first target)
* **Size:** 0.5 (volatility-adjusted)
* **Confidence:** 75%
* **Entry Timing:** Market open
📌 **Why Long?**
* Strong uptrend + above key moving averages
* Positive funding rates and recent momentum support bullish case
* Risk-reward favorable for a potential \$4K+ breakout
💡 *Watch for volume confirmation — failure to break \$4K with strong buy-side pressure could trigger a pullback to \$3,900.*
---
**#ETH #Ethereum #Crypto #Cryptocurrency #CryptoTrading #ETHUSD #Altcoins #Bitcoin #BTC #CryptoSignals #CryptoSetup #TechnicalAnalysis #SwingTrade #DayTrade #PriceAction #BreakoutTrading #CryptoMarket #CryptoInvesting #MACD #RSI #TradingStrategy #BullishSetup #SupportAndResistance #VolumeAnalysis**

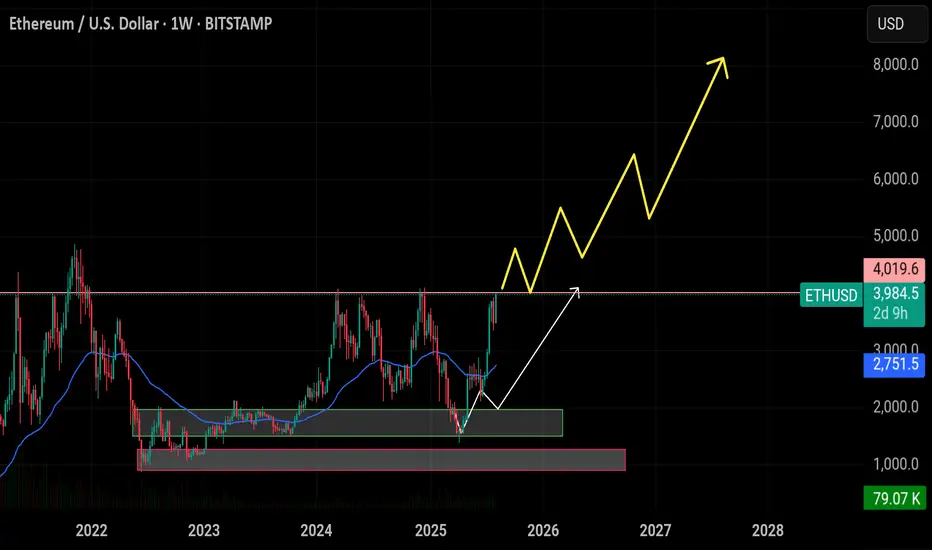
$ETH/USDT Breakout Analysis 1W Chart: Ethereum $ETH/USDT Breakout Analysis 1W Chart:
ETH has successfully reached the $4,000 breakout level, completing our first major target from the accumulation zone ($1,500–$1,900). Price is currently testing the critical $4,000 resistance. If ETH can close a weekly candle above this level and hold, it will confirm a strong continuation structure — potentially targeting $5,000, $7,000, and up to $8,000 in the coming months.
🔸 Support LEVEL: $3,500 is now the key weekly support zone. This level aligns with previous resistance and structure, offering a strong base for bullish continuation. If ETH holds $4,000+ weekly, $3,500 becomes a high-conviction re-entry zone.
🔸 Upside Target: Upon confirmation above $4,000, ETH could rally toward $5,000 short-term, with extended targets at $7,000 and $8,000 if momentum continues.
🔸 Risk Level at $3,500: A weekly close below $4,000 followed by a drop under $3,500 would invalidate the breakout. This could signal a failed breakout and return to range. High risk zone opens below $3,200.
🔸 Watch for Retest ZONE: Look for a healthy retest of the $3,900–$4,000 zone. If ETH pulls back and holds this zone on weekly, it offers a strong entry with targets toward $5,000 and above.
ETH-----Sell around 3905, target 3850 areaAugust 8th ETH Contract Technical Analysis:
Today, the long-term daily chart closed with a small bullish candlestick pattern, with consecutive bullish candlestick patterns and a single bearish candlestick pattern. The price is above the moving average, and the accompanying indicator shows a death cross with shrinking volume. The overall upward trend is very clear, but the current price is deviating from the moving average, so traders should be aware of the risk of a large pullback. There are also news and data stimuli. The short-term hourly chart shows a pattern of oscillating upward movement, with prices continuing to break higher. The more such a trend is, the more we need to pay attention to the support level of the pullback. This is crucial. Many friends want to sell, and that's fine, but you must not be greedy. Only short-term trading is necessary. If you can't do it, don't do it. Currently, the price is under pressure, with consecutive bearish candlestick patterns and the accompanying indicator showing a downward death cross. A pullback is also important for the day.
Today's ETH Short-Term Contract Trading Strategy:
Sell at the current price of 3905, with a stop loss at 3935 and a target of 3850.

eth swing buy / long setup eth well bounced from weekly fvg, now it's heading towards 4.1k double top liquidity. wait for the entry and must use SL, If candle closes below sl on 1hr tf then close on entry, otherwise wick doesn't matter. Maybe eth take 3750 liquidity first then fly high.

ETH: LIVE TRADEHello friends🙌
✅Given the good rise we had, we had a small correction that was a buying opportunity and there is another support area where we can buy the second step in case of further correction.
We have also specified targets for you, be careful and do not act emotionally and observe capital and risk management.
🔥Follow us for more signals🔥
*Trade safely with us*

Ethereum ETH at Key Resistance: Here's My Trade PlanEthereum (ETH) has maintained a fairly bullish structure overall 🟢, but price is now trading into a significant resistance level 🧱📈. I’m closely monitoring for a reaction at this zone — ideally a rejection that leads to a pullback into a key support area 🔄📉.
If ETH finds support and we get a clean bullish break in market structure from there 📊🚀, that could present a high-probability setup to the long side — contingent on price action confirming the bias. 🔍 Not financial advice ⚠️.

ETH(20250806) market analysis and operationAugust 6th ETH Contract Technical Analysis:
Today, the daily chart showed a small bullish candlestick pattern yesterday, with prices rising continuously. However, the accompanying indicator formed a death cross. Monday's gains were not followed by a significant pullback on Tuesday. Therefore, it is difficult for both upside and downside to continue, and the trend remains range-bound. Until a breakout occurs, maintain a short-term strategy of selling high and buying low. On the hourly chart, yesterday's US session continued the downward trend of the European session, correcting the current bearish candlestick pattern. The accompanying indicator formed a death cross with shrinking volume, suggesting a high probability of a pullback during the day. Focus on the upward pressure around the 3700 high.
Today's ETH Short-Term Contract Trading Strategy:
Buy on pullbacks to the 3590 area, with a stop loss at the 3560 area, and a target of the 3650 area. Sell on pullbacks to the 3670 area, with a stop loss at the 3701 area, and a target of the 3605 area.

ETH-----Sell around 3670, target 3600 areaAugust 5th ETH Contract Technical Analysis:
Today, the daily chart closed with a small bullish candlestick pattern, with consecutive bullish candlesticks and prices consolidating at high levels. The accompanying indicator formed a death cross. The price did not break through the previous high on the pullback, so the overall downtrend is still favorable. However, it should be noted that yesterday's pullback interrupted the ongoing downward trend, so this is important to note. The hourly chart showed continued gains during the European and American sessions, while prices came under downward pressure during the Asian morning session. The current candlestick pattern is a series of bearish candlesticks, with the accompanying indicator forming a downward death cross. This suggests a continued upward trend within the next few days, but the strength and impact of the European session remain important to monitor.
Today's ETH Short-Term Contract Trading Strategy:
Sell on pullbacks to the 3670 area, with a stop loss at 3700 and a target at 3600.

Testing $3,500 Support, Rebound Ahead?Instrument: ETHUSD
Timeframe: Daily
Date: August 4, 2025
Analysis:
ETH fell 7.9% to $3,500 from $3,800, testing support after failing to break its high. The hawkish FOMC and rising BTC.D (62%) pressured altcoins. I entered the dip on $3,500, as shared on X and my previous report
Chart Setup:
Support: $3,500
Resistance: $3,600, $3,800

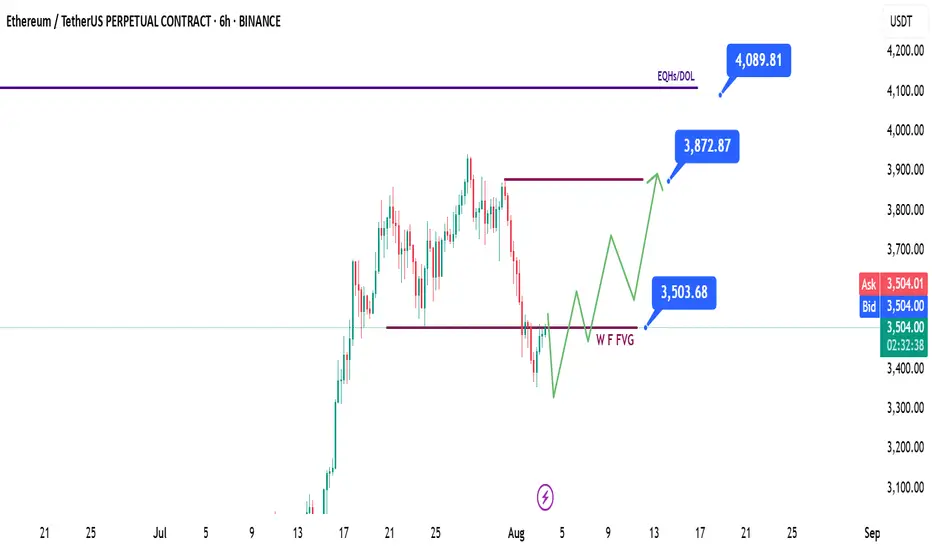
ETH | Ethereum - Weekly Recap & Gameplan - 03/08/25📈 Market Context:
Traders are currently anticipating a potential 0.25% rate cut at the September FOMC meeting, which continues to support the broader bullish outlook.
While the market pulled back following weaker-than-expected Non-Farm Payroll data, overall sentiment remains optimistic.
Greed has cooled off into a more neutral stance. Historically, August often brings some consolidation or pullbacks — but the structural bias for crypto market remains bullish.
🧾 Weekly Recap:
ETH started the retracement movement after building a bullish trend over the past couple of weeks.
It’s mainly being affected by Bitcoin's bearishness, so we’re closely following BTC’s price action.
ETH has tapped into the Weekly Fair Value Gap, which is a key level for me.
We may see a bounce from here.
📌 Technical Outlook & Game Plan:
I expect to see another low on ETH before we go up — as I’m also anticipating one more leg down on Bitcoin.
So I’ll wait for a final bearish expansion and a trap for late sellers before positioning for longs.
After that, I want to see price closing above the purple line at $3500.
🎯 Setup Trigger:
A candle close above the $3500 level will be my signal to look for long setups.
📋 Trade Management:
Stoploss: Below the swing low that breaks above $3500
Take Profit: Targeting $3870, but will trail and lock in aggressively in case of deeper downside expansion.
💬 Like, follow, and comment if this breakdown supports your trading! More setups and market insights coming soon — stay connected!
ETH/USD – Critical Reversal Zone?
### 🚀 ETH/USD – Critical Reversal Zone?
**🔍 ETH Futures Multi-Model Signal | Consensus: LONG | Confidence: 77%**
---
**🧠 Key Highlights (DS + OA Model Consensus):**
* **Price:** \$3,375 → Trading *below* EMA9/SMA20 = short-term bearish, but hitting strong **support zone**
* **Support:** \$3,248 (Bollinger Lower) & \$2,987 (SMA50)
* **Resistance:** \$3,487 (EMA21), \$3,620 (SMA20)
* **Volume:** -10.3% (5D) → Selling **weakening**
* **RSI:** 49.5 → Neutral but oversold on short-term
* **MACD:** Bearish crossover, but showing **divergence**
* **Volatility:** Bollinger width 9.18% = **Breakout Setup**
---
### 📈 Trade Setup – Conditional LONG
| Entry | Stop Loss | Target | R/R | Confidence |
| ------- | --------- | ------- | ------ | ---------- |
| \$3,375 | \$3,229 | \$3,690 | 1:3.24 | 77% ✅ |
🪙 **Trade Type:** Scale-in (50% @ \$3,375, 50% @ \$3,275)
📊 **Take Profits:**
* TP1: \$3,485 (EMA21)
* TP2: \$3,590 (SMA20)
* TP3: \$3,690 (Weekly VWAP Anchor)
---
### ⚠️ Risk Dashboard
* 🚨 BTC < \$58K → Setup invalid
* 📉 No Open Interest Data – monitor liquidation triggers
* 🧠 Max Position Risk: **1.25%** | Use hard stop-loss
* ⏰ Entry Timing: **London Open (8:00 GMT)**
---
### 💬 TL;DR
ETH is sitting in a **high-confluence reversal zone**. Weak sell volume, macro bullish trend, and volatility contraction signal a potential bounce. 📊 **Risk-defined long** setup favored by both models.
🧠 “Smart money doesn’t chase — it positions early.”
---
📌 **#ETH #CryptoTrading #ETHUSDT #Futures #BreakoutSetup #BollingerBands #MACD #RSI #DeFi #Ethereum #CryptoSignals #TradingView**

ETH Approaching Major Resistance – Expecting Pullback Hello guys!
Ethereum has been rallying strongly within a well-respected ascending channel, pushing past key levels and now approaching a major resistance zone around $3,900–$4,000.
According to the chart structure, it looks like price could soon react from this resistance, leading to a pullback into the $3,000–$3,200 demand zone, which aligns with the midline of the channel.
This would be a healthy correction before potentially continuing the bullish trend and attempting a clean breakout toward new highs.
ETH is still bullish, but it may need to retest support before continuation.
Watch for a bounce from the $3,000–$3,200 zone for a high-probability long opportunity.

Ethereum: Smart Money Reversal After Stop Hunt?In the previous update, we warned that Ethereum might drop lower before any meaningful bounce — especially if it failed to hold the midline of the ascending channel. That scenario played out exactly as anticipated.
🟡 Price action summary:
ETH broke below the midline of the weak ascending channel, hunted the liquidity below recent lows, and tapped into the key bullish order block near $3,490 – $3,520. Price is now reacting to this zone with early signs of a reversal.
📌 Key observation:
Midlines of weak or low-momentum channels often act as liquidity traps in smart money models. Buying at these levels can be extremely risky — especially during corrective or distribution phases.
⸻
📚 Educational Note:
Never enter long positions solely at the midline of a weak ascending channel, especially when there’s a high probability of liquidity sweep below. Smart entries usually occur at order blocks formed after stop hunts.
⸻
🎯 Next steps:
Wait for confirmation (such as internal BOS or FVG closure) before entering longs. The structure suggests a potential move back toward the upper boundary of the channel if this OB holds.
⸻
🔗 Save this analysis and share it with fellow traders.
💬 Thoughts? Drop your view in the comments.

ETHUSDT.PIf you look at the chart, you will notice an uptrend that has somewhat lost its strength and we may not be able to hit higher highs like the next strength in the next move.
Support: 3.660 - 3.590 - 3.160
Resistance: 3.900 - 4.260
Entry: 3.700
SL: 3.500
TP: 4.240
Please control risk management.⚠️

ENA / USDT#ENA / USDT
Iam expecting big returns from ETH and its related coins in this season
This chart is also looking good
Another Potential round bottom pattern under formation
Keep an eye
