ETH Struggles at $1900 - A Cautious Approach is AdvisedToday, I wanted to bring your attention to the recent struggles faced by Ethereum (ETH), which currently stands at a price of $1900. While the crypto market remains highly volatile, it is crucial to approach such situations with caution and prudence.
ETH has been facing significant challenges in maintaining its price at the $1900 level. This recent turbulence raises concerns about the short-term stability and potential downward pressure on Ethereum's value. As responsible traders, it is essential to evaluate the current market conditions and make informed decisions regarding our investment strategies.
In light of these developments, I would like to encourage you to consider holding off on any immediate ETH investments or further purchases until we witness a clearer trend. By exercising patience and closely monitoring the market, we can mitigate potential risks and make more informed decisions about our crypto portfolios.
As crypto traders, we understand the importance of staying updated and navigating the market wisely. Here are a few factors to consider before making any decisions regarding ETH:
1. Market Sentiment: Observe the sentiment of the crypto community, paying attention to expert opinions and market analysis. This will provide valuable insights into the overall market sentiment towards ETH.
2. Technical Analysis: Conduct thorough technical analysis, including examining key support and resistance levels, chart patterns, and indicators. This will help identify potential price movements and trends.
3. Fundamental Factors: Stay informed about any significant developments or news related to Ethereum, such as protocol upgrades, partnerships, or regulatory changes. These factors can significantly impact the price and future prospects of ETH.
Remember, in times of uncertainty, it is crucial to prioritize risk management and protect our investments. By taking a cautious approach and carefully evaluating the market conditions, we can position ourselves for potential opportunities while minimizing potential losses.
Collaboration and knowledge sharing can help us make more informed decisions and navigate the crypto market effectively.
Hold off on ETH investments for now and closely monitor the market conditions before making any further decisions. Let's exercise patience, evaluate the market sentiment, conduct technical analysis, and stay informed about fundamental factors. By doing so, we can make more informed choices and protect our investments in the volatile crypto market.
Ethtrading

Is RSI over 50 something to be concerned about ETH?
I am writing to express my concern about the current state of Ethereum (ETH). As you may know, ETH's Relative Strength Index (RSI) has recently gone over 50, indicating that the asset is in trouble.
This is a worrying sign for anyone who has invested in ETH, as it suggests that the asset is losing momentum and may be headed for a downturn. As traders, we must pay attention to these signals and take action to protect our investments.
I urge you to take this warning seriously and consider your options carefully. Whether you hold on to your ETH or sell it off, you must stay informed and ahead of the market.
In these uncertain times, being vigilant and proactive in our trading strategies is more critical than ever. I encourage you to closely monitor ETH and take any necessary steps to protect your investments.

50d 200d moving cross for ETH as new support level I wanted to share some exciting news: ETHER has just had a popular 50d 200d moving average cross, establishing a new support level. This is great news for us as traders, as it clearly indicates a bullish trend.
What's more, the RSI (Relative Strength Index) is currently at an optimal time for entry. This means that now is the perfect time to consider opening a position in ETHER.
I know some of you may be hesitant to jump in, but I encourage you to consider taking a position in ETHER. With the recent upward trend and establishing a new support level, there's never been a better time to invest.
So, what are you waiting for? Don't miss out on this opportunity to profit from the current market conditions. Take a look at ETHER and consider opening a position today.

Ether RSI shows short term pop up I wanted to update you on the recent price movements of ETH/USD. Yesterday, the cryptocurrency reached a high of $1,761.96, but today it slipped to an intraday low of $1,727.75. Currently, it moved below a floor at $1,730.
However, bulls have stabilized this support zone, with the RSI finding its floor at 38.00. Currently, the price strength is at 38.81, which is within the oversold region. This could potentially be a positive sign for those looking to buy low.
Please let me know if you have any further questions in the comments.

ETH volatility could start to spike but RSI is lowI am bringing to your attention the current state of Ethereum's price trend. As of now, Ethereum has been experiencing a notable downward trend in price when observed on a daily timeframe chart. It is currently trading at approximately $1,740, which reflects a decline of over 5%.
It’s becoming increasingly evident that Ethereum is experiencing a bearish trend in the market, as indicated by its RSI dropping below 40. To add fuel to the fire, the current volatility level of Ethereum is at a measly 0.01%. If you're a Bitcoin trader, it's time to pay attention and make informed decisions accordingly. Check out Furthermore for more insights.
Additionally, the Bollinger Band analysis indicates that ETH is currently experiencing a certain level of volatility. However, the band's elasticity suggests that the current volatility is relatively minimal.
I hope this information is helpful to you. Please let me know if you have any questions or concerns in the comments.

ETH life time buy setup Hello Traders, here is the full analysis for this pair, let me know in the comment section below if you have any questions, the entry will be taken only if all rules of the strategies will be satisfied. I suggest you keep this pair on your watchlist and see if the rules of your strategy are satisfied. Please also refer to the Important Risk Notice linked below.

Will you believe the upcoming short term strength of ETHGreetings fellow crypto traders! Are you ready for some good news? Well, hold on to your hats because we've got some exciting developments in the world of Ethereum's technical analysis outlook! After months of uncertainty, Ethereum's price is finally showing signs of a bullish trend. So, if you're looking to invest in a promising cryptocurrency, look no further than Ethereum.

ETH Continues to Soar so It is Time to Trade Short Term!
I hope you have been enjoying the positive momentum ETH has been experiencing lately. It's been an exciting time for all of us, and I'm thrilled to see our favorite cryptocurrency continuing to soar!
As you all know, ETH has steadily risen, breaking new records and reaching new heights. It indicates that the market is bullish on ETH, and we expect to see more growth in the coming days.
So, what does this mean for us traders? First, it means that there's a fantastic opportunity to capitalize on the current trend and make some profits in the short term. The market is showing strong support for ETH, and this is the perfect time to enter a short-term trade.
I encourage you to take advantage of this opportunity and start trading ETH in the short term. With the positive momentum, we can expect to see some quick gains, and it's an excellent chance to maximize our returns.
Let's not miss out on this chance to make some profits and continue to ride the wave of success with ETH. So, prepare to trade and make the most of this bullish market.
Thank you for being a part of this community, and I wish you all happy trading!

Can ETH skyrocket by breaching this level for an astounding 50% Guys, we're looking at a big move up ahead. Here's why it's likely to break this level:
>Notice the Green boxed candle. It often signals a change of character (here in the upward trend), suggesting this level will be surpassed soon.
>When a 10-day green candle closes above the level (R1), expect a 50% price increase. Set your stop loss at the light blue box.
>Even if the price temporarily drops, lower time frames confirm a potential move to the DARK blue level. Keep a tight stop loss (above the R1) and aim for a 31% decline.
Remember, your input is valuable in the comments. Let's discuss and share our thoughts.
Good luck!

Short inboundHi
i am back with 4:1 ratio trade.
you can either wait for a pullback following the blue curve and then short to have a smaller SL or you can short it right here to secure your position incase a pullback does not happen.
Good luck, happy trading guys.

ETHUSD Next MovePair : ETHUSD ( Ethereum / U.S Dollar )
Description :
Bearish Channel as an Corrective Pattern in Long Time Frame
Divergence - RSI
Break of Structure
Completed " ABC " Corrective Wave
Rising Wedge as an Corrective Pattern in Short Time Frame with the Breakout of the Lower Trend Line

ETHUSD most likely it is still in a bullish trend, but now it may enter into a correction period, where this correction period can run quite deep.

ETH/USD outperforms with support and triangle patterns ETH/USD continue to break out with 3 support level established at $1823. Most recent triangle patterns confirm an upward direction of TSE:1808 and a lower bound at $1715. Momentum should continue to drive up.

📈Ethereum prediction during FOMC decision📉BINANCE:ETHUSDT
BITSTAMP:ETHUSD
Hey everyone, first take a look at my previous analysis and positions.
2 scenarios for the Ethereum
Price targets ----> 1-2-3 are on the chart.
For long targets ----> checkout previous idea.
Don't forget to risk-free your position.
Please share ideas and leave a comment,
let me know what's your idea.
CrazyS✌

Good Opportunity:ETH price hits a new high during the yearEthereum, from a technical point of view, the ETH short-term 4-hour market is under pressure below 1850. The market is currently falling below the MA20 moving average to stop the decline, and the low point of the decline is slowly rising. In the short-term, the market has not fallen below the 1740 first-line support. There are signs of successful top-bottom conversion. The daily market closed on March 18th with a long shadow line of negative K, the market is rising again today, currently showing a barefoot positive K, the current daily market has a slight adjustment signal, the daily line pays attention to the support of the 1740 range below, and the market If the entity falls below the high probability, it will drop down to the 1680 line. Overall, the current short-term market is supported by the strong pressure level of the 1740 line before stepping back, the market has formed a top-to-bottom conversion, and the daily line has a slight downward signal. At the same time, the market has already touched the 1800-1900 range. Strong selling pressure level, so the current operating idea is to wait for the market to adjust, mainly to go long at low levels.
In addition, if buyers can keep interest rates above US 1700, Ethereum (ETH) may continue to grow in the medium term.In this regard, the rise may continue to the key area of about US 2000.
In order to facilitate everyone to continue to follow up on my analysis and sharing, you can like and follow me; in addition, I will share the daily real-time strategy in the channel. If you can't follow up in real time, you may make operational errors.You can use the following methods to enter my channel for free to follow the latest news and follow up on market trends in real time.

ETH:The analysis of ETH's future market situation is as followsETH as a whole is still in a wide range of oscillations at the daily level. Technically, ETH failed to break through the 1590 position, and a new bearish reaction appeared after forming a high near 1583.It fell sharply below the levels of 1550 and 1540.The low formed near 1535.The daily chart is suppressed by the moving average of technical indicators, and the opening of the Bollinger band is downward, the overall market of Ethereum is still running short.
At the small level, the current small-level rebound market is under pressure near 1565. This position happens to be the intersection of the short-term moving average of the 20th and 30th moving average, which plays a role in the market. The market is under pressure, and with the current technology showing kinetic energy, it is difficult to support the rise of Ethereum and make a breakthrough, so the top is currently facing two suppression levels, one is near 1565, and the other is the high point 1590 that has not been effectively broken through recently. Therefore, from this point of view, Ethereum is still in a weak and volatile market. If it is delayed and cannot effectively break through the above two resistance levels, it will be difficult to support the rise of Ethereum and make a breakthrough. Therefore, the top is currently facing two suppression levels, one is near 1565, and the other is the high point 1590 that has not been effectively broken through recently. Therefore, From this point of view, Ethereum is still in a weak and volatile market. If it is delayed and cannot effectively break through the above two resistance levels, when If the kinetic energy is exhausted, a new round of falling markets may begin.
So in terms of operation, Ethereum can enter with empty orders near 1583-1590, below the target level of 1540.
In order to facilitate you to continue to follow up on my analysis and sharing, you can like and follow me. In addition, you can enter my channel for free in the following ways to follow real-time views and operational strategies.
BINANCE:BTCUSDT BINANCE:ETHUSDT BITSTAMP:BTCUSD BITSTAMP:ETHUSD COINBASE:BTCUSD COINBASE:ETHUSD

ETH target 1750 above
Looking back at the market, after Ethereum tested the 1560 support on the weekend, confirming that the support was effective and quickly rebounded, it is now stabilized above 1600. As we mentioned previously, each round of decline is for a better rising, so we laid out long positions between 1560-1580, and now the profits are quite good.
However, from the current market, there is a lack of upward momentum, and the market needs to be adjusted again before a new round of attack can be launched. Therefore, friends with smaller capital can take profits at 1650 first and wait for the market to give them another chance to enter the long positions, so that they can better magnify the profit space.
The first target of the long-term layout is 1700, the second is the previous high point 1750, and the stop-loss point pays attention to the breaking of 1560. If the market falls to 1580-1600, it can enter the layout again. In the short term, we look at the adjustment of the market, and in the long term, there is only one direction, that is, bullish.
Once again remind, although the long-term layout has a fairly good profit, but at the same time it needs a large amount of capital and a good investment mentality, short-term volatility adjustments should not be too concerned, we only pay attention to whether there has been a change in the overall direction, and at the same time I will continue to update my views on the plate, give the most secure strategy, thank you friends for their attention and likes, if you have any questions, please leave me a message.

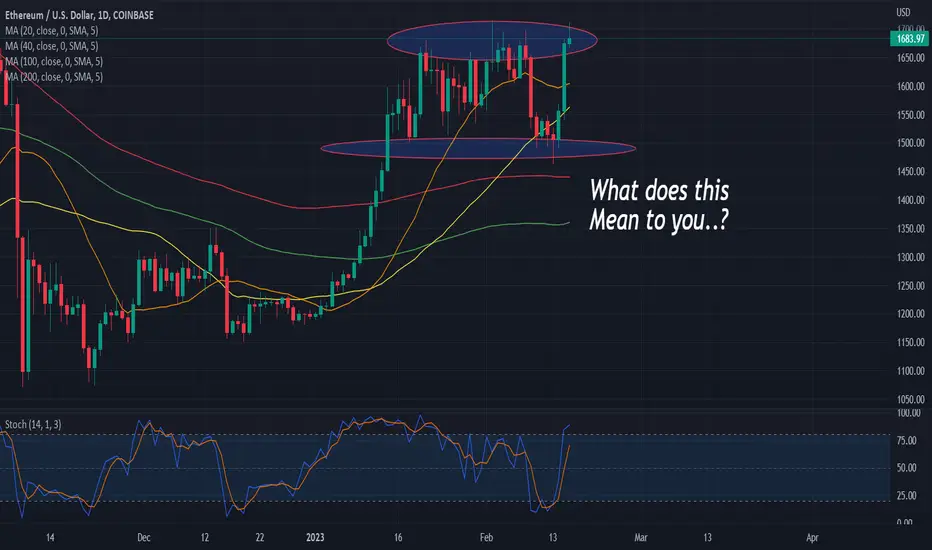
Crypto Decision Time..In every Traders lifetime there comes a time where Markets look like they are going to fly and fly. Markets push up quickly and they return to former levels seen along side former PA. The question arises... Will the level break and should I hold my longs against my will?....
And so the serotonin is released, the excitement begins and the FOMOer floods into the market AFTER the first move. The drop we saw recently rebounded on sustained market sentiment to the upside but you will notice the stall at very recent highs. The hype that arrives around crypto markets will often come around the time that the market mood looks more optimistic and other coins like BTC start to move.
But how should you handle it? Where do you buy? Where do you sell? Where do you exit? These are all things that are best known before markets move because if you are trading unnaturally (against the normal flow of the markets) then you are going to find things end badly, especially with such assets.
These are all questions Traders inherently face on such assets.
If you are a buyer and you want to get things right, naturally you'll have to buy on dips... And by dips we mean significant moves to comfortable areas of support with aligned risk. We are not house sellers looking to load into one move. We trade many dips and we exit many pushes up to key resistance for gains.
Selling HVA's gets dangerous as you can be roasted on hype moves. If you are selling you will also need to be a scalper with very, very light trading sizes. Your goal is to kill of moves up on gains and re-buy substantial dips.
Do not get caught in a rut and buy dips that are not far pushes. You will end up getting poor market value repeatedly and over time the worse deals stack up and losses begin to rise. Keep sizes small and smart and do not let your emotion push you to take trades you are not comfortable with.
It's advisable to have a MAXIMUM trade size and MAXIMUM Drawdown limit so you do not exceed what is comfortable for your capital. It is also wise to have separate ones for any crypto or indeed anything you are trading. The emotion aspect you will find is removed if you consistently take gains and have sufficient risk plans monitoring your overall risk constantly.
Financial Wave. ETHWe have slightly corrected our priority scenario in ETH. After breaking through the level of $1330, the next ascending wave (v) the target is at the level of $1368. We allow a correction in wave (iv) if it is not completed, but the price shouldn’t t fall below $1277. A price drop below this level will cancel our scenario.

Ethereum 30m Chart Analysis Idea (Short)An idea before ETH makes a lower low to $1205.
Entry for a short here with good risk management, NFA.

Financial Wave. ETHETH.
The $1300 target that we discussed in previous reviews has been reached. Our priority scenario for Etherium is continued growth in the $1380-1450 range. A price drop below $1150, as well as a long flat cancel this scenario.

Financial Wave. ETHEtherium
In previous reviews, we showed our priority scenario for ETH with a target of $1300, in fact it can be considered fulfilled and we have introduced updated growth targets, the wave structure is moving ETH to the next targets of $1380 and $1450. A price drop below $1150 will change our view.

ETH/USDT - Writing On The Wall? 📉Looking at the $ETH daily chart, things are looking quite bearish.🐻
$700-800 remains our target "bottom" in this range as $ETH just bounced off the downward channel as illustrated.
We pointed out a potential crypto dip the other day looking at the $BTC charts, and it seems to be playing out. 🔮
Do you think we get a small relief bounce here on $ETH? Or is it "look out below" until $700-800? 🤔
Either way, we're big HODL buyers at those levels long term.
-TucciNomics
Chief Overlord, AlgoBuddy
