ETHUSD potential reversal!
ETHUSD expected to rise up to 1st resistance at 183.69 where it could potentially react off and drop down to 1st support at 169.28.
Trading CFDs on margin carries high risk.
Losses can exceed the initial investment so please ensure you fully
understand the risks.
Ethusdanalysis

ETHUSD falling wedge ."In the name of Allah, the Most Gracious, the Most Merciful".
ETHUSD falling wedge
Note: This is only for Educational Purpose this is not Investment advice.
Please support the setup with your likes, comments and by following on Trading View.
Thanks
Adil Khan.

ETHUSD bounced from support, potential for a further rise!
ETHUSD bounced off 186.03 where it could potentially rise further to 371.18.
Trading CFDs on margin carries high risk.
Losses can exceed the initial investment so please ensure you fully
understand the risks.

ETHUSD bounced from support, potential for a further rise!
ETHUSD bounced off 191.11 where it could potentially rise further to 371.18.
Trading CFDs on margin carries high risk.
Losses can exceed the initial investment so please ensure you fully
understand the risks.

ETHUSD bounced from support, potential for a further rise!
ETHUSD bounced off 184.75 where it could potentially rise further to 371.18.
Trading CFDs on margin carries high risk.
Losses can exceed the initial investment so please ensure you fully
understand the risks.

ETHUSD bounced from support, potential for a further rise!
ETHUSD bounced off 201.42 where it could potentially rise further to 371.18.
Trading CFDs on margin carries high risk.
Losses can exceed the initial investment so please ensure you fully
understand the risks.

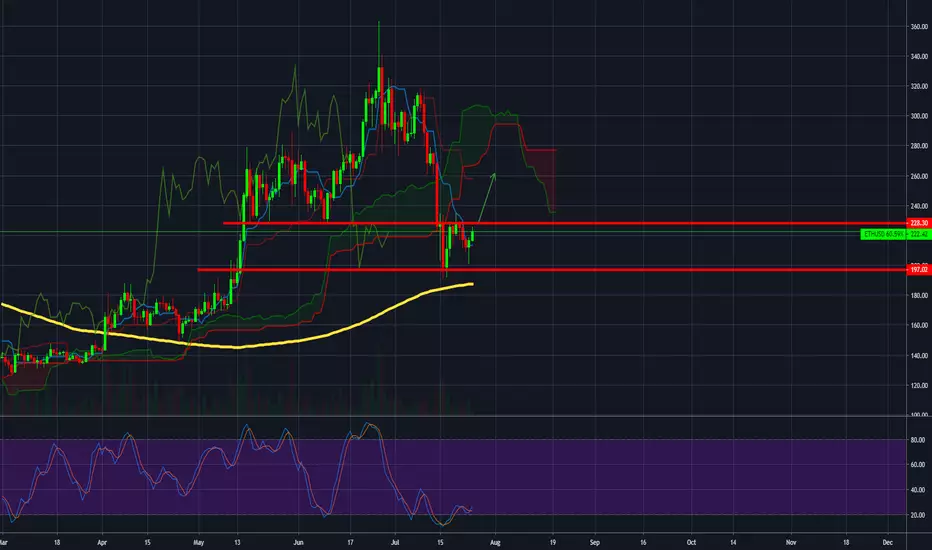
#ETHUSD#Ethereum, Already going back to business?The trend in the daily graph is still bearish.
The support that broke in last week became resistance, basically the line we added in the above graph at $ 197 is used today as important resistance and currently, Ethereum is in the breaking stages of this resistance line.
The Stochastic lines are positioned at 20 which is a level that could signal a potential increase
Target: $ 233

ETHUSD to reverse from downside confirmation, potential drop!
ETHUSD to reverse from its downside confirmation at 187.32 where it could potentially drop further to 142.33.
Trading CFDs on margin carries high risk.
Losses can exceed the initial investment so please ensure you fully
understand the risks.

#ETHEREUM#ETHUSD, We're on the way down!After a month of stuck with Ethereum rising and dropping between $ 233 and $ 197 the breaking happened, the Ether broke support at $ 197.
A very bearish trend.
Target: $ 142

ETHUSD bounced from support, potential for a further rise!
ETHUSD bounced off its support at 189.21 where it could potentially rise further to 371.18.
Trading CFDs on margin carries high risk.
Losses can exceed the initial investment so please ensure you fully
understand the risks.

#ETHUSD#Ethereum, Operating instructions for AugustWe have been stuck for a month between $ 197 and $ 233 and we expect it to continue for another month.
So what can be done by then? Buy as close as possible to support $ 197 and sell as close to resistance as $ 233.
If you are a trader who wants to trade only with the trend then wait for the price to approach $ 233 and then sell.

ETHUSD bounced from support, potential for a further rise!
ETHUSD bounced off its support at 189.21 where it could potentially rise further to 371.18.
Trading CFDs on margin carries high risk.
Losses can exceed the initial investment so please ensure you fully
understand the risks.

ETHUSD approaching resistance, look out for potential reversal!
ETHUSD is approaching its resistance at 371.18 where it is could reverse down to its support at 189.21.
Trading CFDs on margin carries high risk.
Losses can exceed the initial investment so please ensure you fully
understand the risks.

ETHUSD bounced from support, potential for a further rise!
ETHUSD bounced off its support at 220.49 where it could potentially rise further to 371.18.
Trading CFDs on margin carries high risk.
Losses can exceed the initial investment so please ensure you fully
understand the risks.

ETHUSD bounced from support, potential for a further rise!
ETHUSD bounced off its support at 214.03 where it could potentially rise further to 371.18.
Trading CFDs on margin carries high risk.
Losses can exceed the initial investment so please ensure you fully
understand the risks.

#Ethereum#ethusd, Signal until ...Ether is stuck in the range of $ 197 to $ 228.
A green candle after a star-shaped red candle is a bullish sign.
We recommend buying near $ 197 and selling close to $ 228 until Ethereum selects a trend
Target: $ 228

ETHUSD bounced from support, potential for a further rise!
ETHUSD bounced off its support at 206.44 where it could potentially rise further to 371.18.
Trading CFDs on margin carries high risk.
Losses can exceed the initial investment so please ensure you fully
understand the risks.

ETHUSD Still Holing ETHUSD is still in a lower low lower high pattern on the daily and will be looking for a breakout soon if it breaks above 226 we will be looking at a bull run if it breaks below 200 a bear run will be in place.

ETHUSD bounced from support, potential for a further rise!
ETHUSD bounced off its support at 189.21 where it could potentially rise further to 371.18.
Trading CFDs on margin carries high risk.
Losses can exceed the initial investment so please ensure you fully
understand the risks.

#ETHUSD#Ethereum, A second round of rising is going to beginYesterday's green candle with its long wick means trend reversal possible.
the Ether is facing resistance and as long as it has not crossed the risk remains high.
Stochastic crosses at this level indicate a potential rise.
target: $ 270
ETHUSD bounced from support, potential for a further rise!
ETHUSD bounced off its support at 205.16 where it could potentially rise further to 371.18.
Trading CFDs on margin carries high risk.
Losses can exceed the initial investment so please ensure you fully
understand the risks.

ETHUSD approaching support, potential for a bounce!
ETHUSD is expected to drop to 1st support at 189.21 where it could potentially react off and up to 1st resistance at 371.18.
Trading CFDs on margin carries high risk.
Losses can exceed the initial investment so please ensure you fully
understand the risks.

ETHUSD bounced from support, potential for a further rise!
ETHUSD bounced off its support at 189.21 where it could potentially rise further to 371.18.
Trading CFDs on margin carries high risk.
Losses can exceed the initial investment so please ensure you fully
understand the risks.
