Ethusdforecast


ETH/USD Boring until a breakout 🙄Waiting on a breakout to either below or above market structure. So we can get some proper meat out of this trade. Alerts have been set ⏰⏰

ETHUSD 4H-TIMEFRAME ANALYSISETHUSD 4H-TIMEFRAME ANALYSIS
Hello ladies and gentlemen
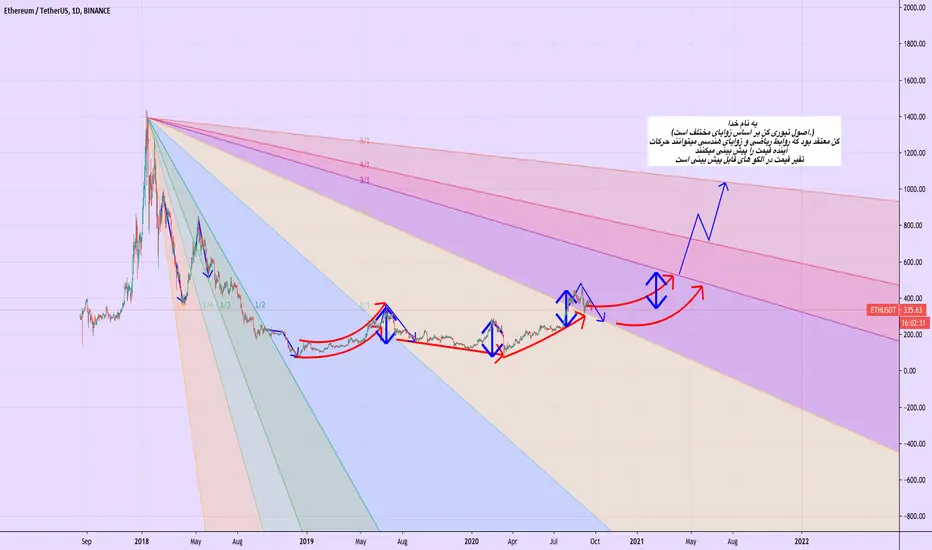
This is my new idea for Etherum
My idea is that ETH In the short term, it will continue to decline
Real support is between 250 and 240 It would be good to test it (the goal of breaking the wedge)
I hope my idea is clear
Support me by like and share
Good luck

ETHUSD double bottom and break of trend line + Bullish engulfingETHUSD
Around 309.00 area price got rejected twice and formed a Double bottom and bounced back from this level
Currently the price is above .236 Fibonacci retracement level. In 4 hour timeframe we are expecting a bullish engulfing candle. And its also reached a price action level and previous lows may turn support for the bear
Series of Higher high Higher low and Higher high was forming which is a bullish sign. In Elliot wave principal the 2nd wave is completed and the 3rd way is underway. We are expecting this 3rd wave will end at .50 Fibonacci retracement level and resistance zone and a key psychological 400.00 level
.50 Fibonacci is coordinated with the Lower high of Previous lower side impulse wave. And this level will act as resistance for the bull. If this level broken then the next target would be 450.00 which is a .786 Fibonacci level and swing area
The 50,100,200 Exponential moving average is acting as resistance for ethereum. RSI managed to move above 50 mark
If the USD will remain weaken we can expect this crypto will visit the 2020 high level which is around 490.00. On downside 310.00 will remain act as a major resistance level
Please give us a thumbs up if u like our work and do follow us so that you can get a regular update about upcoming setups and ideas

ETHUSD 4H-TIMEFRAME ANALYSISETHUSD 4H-TIMEFRAME ANALYSIS
ETH broke the support at 355 with high liquidity
Now it is back to test the area that is now resistance
It needs high liquidity to overcome the resistance
My analysis is that ETH will fail
He will have to return to test the temporary resistance at 310
I will update and share other ideas with the upcoming CRYPTO MARKETS movements
Good luck


ETHEREUM has broke the previous year July high levelETHEREUM COINBASE:ETHUSD
On month starting this cryptocurrency has briefly reached the 490$ per one ETH.
As the bitcoin tumbles ethereum has also giving back some of this yearly gain. And the price is currently trading below the July-2019 high which is previously acted as support for the bullish run.
In daily chart strong bearish engulfing pattern is underway. If the price close below the 364$ mark in daily timeframe. More sellers will get in to the action.
The next target will be around 300$ level which is the next major resistance zone. Stop lose may place above 400$ level. In Elliott wave analysis the 5th major wave is completed and the minor correction waves are forming and will update about the wave formation in coming days
Please give us a thumbs up if u like our work and do follow us so that you can get a regular update about upcoming setups and ideas
Disclaimer
It’s not a financial advice. Do the analyze and take a decision.

Ethusdt targets and cmeEth hitting and testing the outside of channel plotted before,targets posted plus Eth target to the downside, is Btc closing the gap? if it is, just wicks to cme gap targets in play

ETHUSD to see a downtrend further4hr)| Bearish MomentumMarket in last 24hrs
ETHUSD saw an uptrend and got rejected from the upper Bollinger band
Price volatility was very high. The market moved ~6.13%, between $486.00 and $457.95
Today’s Trend analysis
ETHUSD expected to see a downtrend as the price got rejected from the upper band after riding the band
Price at time of publishing: $472
ETH’s market cap: $53 Billion
Oscillator indicators are mostly neutral. RSI at 73
Moving average indicators are suggesting an uptrend. Ichimoku Cloud is neutral
Volume indicators observed a decrease as the price rides the band and rejects
Price expected to see a downtrend as the price got rejected from the upper band after riding the band. Most of the Oscillator indicators are neutral. MACD line moving above the signal line, signal line approaching the MACD line from below with histogram size decreasing in positive direction. RSI at 73, in the overbought region decreasing, suggesting a trend reversal soon. CCI with a value of around 167 in the overbought region with a down move indicating a downtrend. Another interesting point to notice here is that the Bollinger band expansion takes place with a decrease in volume as price falls.
----------------------------------------------------------------------------------------
The analysis is based on signals from 28 technical indicators, out of which 17 are moving averages and the remaining 11 are oscillators. These indicator values are calculated using 4 Hr candles.
DM to get details of the above analysis and list of indicator & their values used to arrive at the above conclusion.
Note: Above analysis would hold true if we do not encounter sudden jump in trade volume .
----------------------------------------------------------------------------------------
If you find the analysis useful, please like and share our ideas with the community!
- Mudrex

ETH/USD Rockets To 2-Year Highs Technical Analysis (09/01/2020)Technical Analysis 1 September 2020
Ethereum (ETH/USD) extended recent gains early in today’s North American session as the pair appreciated to the 473.53 area after trading as low as the 428.65 area during the Asian session. Stops were elected above the 474.59 area, an upside price objective that represents the 50% retracement of the historical depreciation from 828.97 to 80.60. Additional upside price objectives include the 487.55, 498.68, 516.03, 517.38, 531.80, and 543.09 areas. The pair’s ongoing upward momentum was confirmed yesterday when buying pressure emerged around the 418.79 area during a pullback, representing the 61.8% retracement of the historical depreciation from 627.83 to 80.60. Stops were elected below the 398.91, 397.08, 396.37, 392.67, 386.63, 384.29, and 382.47 areas during the pair’s recent depreciation from the 447.50 area, and traders are curious to see if these levels provide any technical support during pullbacks.
The 396.69 area remains an important technical level, representing the 23.6% retracement of the historical depreciation from 1419.96 to 80.60. Following the pair’s recent appreciation, important technical levels include the 416.00, 409.64, 389.91, 383.02, 374.83, and 360.04 areas. Traders are observing that the 50-bar MA (4-hourly) is bearishly indicating below the 100-bar MA (4-hourly) and above the 200-bar MA (4-hourly). Also, the 50-bar MA (hourly) is bullishly indicating above the 100-bar MA (hourly) and above the 200-bar MA (hourly).
Price activity is nearest the 100-bar MA (4-hourly) at 407.83 and the 50-bar MA (Hourly) at 433.80.
Technical Support is expected around 349.75/ 331.95/ 315.08 with Stops expected below.
Technical Resistance is expected around 487.55/ 498.68/ 516.03 with Stops expected above.
On 4-Hourly chart, SlowK is Bearishly below SlowD while MACD is Bullishly above MACDAverage.
On 60-minute chart, SlowK is Bearishly below SlowD while MACD is Bullishly above MACDAverage.
Yesterdays Technical Analysis 31 August 2020 ETH
Ethereum (ETH/USD) added to recent gains early in today’s North American session as the pair appreciated to the 439.00 area after trading as low as the 418.16 area during the European session. Some Stops were elected above the 438.40 area during the ascent higher, representing the 78.6% retracement of the recent depreciation from 445.45 to 412.51. Traders had earlier pushed the pair as high as the 439.00 area during the Asian session before profit-taking knocked ETH/USD lower. Recently, bids emerged above the 377.44 area, representing a test of the 61.8% retracement of a recent appreciating range from 362.88 to 401.00. Stops were elected below the 398.91, 397.08, 396.37, 392.67, 386.63, 384.29, and 382.47 areas during the pair’s recent depreciation from the 447.50 area. Following the pair’s recent depreciation from the 447.50 level to the 379.53 area, traders are eyeing upside retracement levels around the 395.57, 405.49, 413.52, 421.54, and 431.46 areas. The 396.69 area remains an important technical level, representing the 23.6% retracement of the historical depreciation from 1419.96 to 80.60. Following the pair’s prior run-up, important technical levels include the 414.17, 396.12, 392.67, 383.53, 376.90, 363.13, and 358.75 areas. Recently, the pair has encountered buying pressure around the 23.6% retracement of the appreciating range from 268.39 to 415.00, and downside retracement levels in this appreciating range include the 373.89, 364.70, 355.50, 344.13, and 342.42 areas.
Afte recently taking out the 445.45 level, one upside price objective is the 454.79 areas. Stops were recently elected above the 336.10, 337.33, 342.29, 350.44, 354.22, 366.48, and 369.26 areas during the move higher. Recently, bids emerged just above the 314.07 area, a level that represents the 50% retracement of the broad historical depreciation from the 547.54 to 80.60. A couple of interesting levels that traders will observe during retracements lower include the 301.20 and 301.40 areas, and they are related to buying pressure that emerged around the 241.62 and 319.86 areas. Likewise, the 312.82, 316.32, and 322.16 levels are areas with important technical significance. Chartists are observing that the 50-bar MA (4-hourly) is bearishly indicating below the 100-bar MA (4-hourly) and above the 200-bar MA (4-hourly). Also, the 50-bar MA (hourly) is bullishly indicating above the 100-bar MA (hourly) and above the 200-bar MA (hourly).
Price activity is nearest the 100-bar MA (4-hourly) at 406.75 and the 50-bar MA (Hourly) at 418.57.
Technical Support is expected around 349.75/ 331.95/ 315.08 with Stops expected below.
Technical Resistance is expected around 454.79/ 487.55/ 498.68 with Stops expected above.
On 4-Hourly chart, SlowK is Bullishly above SlowD while MACD is Bullishly above MACDAverage.
On 60-minute chart, SlowK is Bearishly below SlowD while MACD is Bearishly below MACDAverage.

Eth usdt targets still the same Eth usdt triple bullish divergence on macd and bullish divergence on rsi, broadening falling wedge targets still the same. Bouncing off the 200ema but this only happens if btc plays ball

ETH/USD - up trust The world does not give this pattern.
Only after its cancellation will go long.
And now I do not believe in growth.
There was no Aptrast yet.
I trade only on futures.

ETHUSD to see downtrend(4hr)| Lower highs observedMarket in last 24hrs
-ETHUSD consolidated with price rejecting from midline Bollinger band
-Price volatility was high. The market moved ~4.22%, between $393.5 and $377.56
Today’s Trend analysis
-ETHUSD expected to see a slight downtrend as price rejected from midline with lower highs
-Price at time of publishing: $385
-ETH’s market cap: $43.4 Billion
-Oscillator indicators are mostly neutral. RSI at 48
-Moving average indicators are suggesting a downtrend. Ichimoku Cloud is neutral
-Volume indicators observed a decrease in volume as red candles were observed suggesting a weakening selling pressure
Price expected to see a slight downtrend as price rejected from midline with lower highs. Most of the Oscillator indicators are neutral. MACD line touching the signal line, histogram size decreasing in the negative direction with about to cross zero. RSI at 48, below to the midline in the neutral region. CCI with a value of around -61 in the neutral region. Another interesting point to notice here is that the volume observed a decrease in volume with red candles observed suggesting a weak selling pressure.
----------------------------------------------------------------------------------------
The analysis is based on signals from 28 technical indicators, out of which 17 are moving averages and the remaining 11 are oscillators. These indicator values are calculated using 4 Hr candles.
DM to get details of the above analysis and list of indicator & their values used to arrive at the above conclusion.
Note: Above analysis would hold true if we do not encounter sudden jump in trade volume .
----------------------------------------------------------------------------------------
If you find the analysis useful, please like and share our ideas with the community!
- Mudrex

ETH/USD Thwarted By 200-Hour Simple Moving AverageEthereum (ETH/USD) found a small bid early in today’s North American session as the pair appreciated to the 412.04 area after trading as low as the 393.75 area earlier in the Asian session. Stops were reached below the 401.57 area during the pair’s move lower, a relative low from earlier this week, with further Stops elected below the 398.91 and 397.08 areas. Buying pressure emerged above the 392.67 area, representing the 38.2% retracement of the recent appreciation from 215.16 to 447.50. Chartists are noting that the pair has recently been capped around or below the 100-bar simple moving average on 4-hourly charts. Following the pair’s recent depreciation from the 447.50 level to the 393.75 area, traders are eyeing upside retracement levels around the 413.05, 419.63, 426.20, 434.34, and 435.57 areas. The 396.69 area remains an important technical level, representing the 23.6% retracement of the historical depreciation from 1419.96 to 80.60. Following the pair’s recent run-up, important technical levels include the 414.17, 396.12, 392.67, 383.53, 376.90, 363.13, and 358.75 areas. Recently, the pair has encountered buying pressure around the 23.6% retracement of the appreciating range from 268.39 to 415.00. Downside retracement levels in this appreciating range include the 373.89, 364.70, 355.50, 344.13, and 342.42 areas.
After recently taking out the 445.45 level, one upside price objective is the 454.79 areas. Stops were recently elected above the 336.10, 337.33, 342.29, 350.44, 354.22, 366.48, and 369.26 areas during the move higher. Recently, bids emerged just above the 314.07 area, a level that represents the 50% retracement of the broad historical depreciation from the 547.54 to 80.60. A couple of interesting levels that traders will observe during retracements lower include the 301.20 and 301.40 areas, and they are related to buying pressure that emerged around the 241.62 and 319.86 areas. Likewise, the 312.82, 316.32, and 322.16 levels are areas with important technical significance. Chartists are observing that the 50-bar MA (4-hourly) is bullishly indicating above the 100-bar MA (4-hourly) and above the 200-bar MA (4-hourly). Also, the 50-bar MA (hourly) is bearishly indicating below the 100-bar MA (hourly) and below the 200-bar MA (hourly).
Price activity is nearest the 100-bar MA (4-hourly) at 404.78 and the 50-bar MA (Hourly) at 413.54.
Technical Support is expected around 349.75/ 331.95/ 315.08 with Stops expected below.
Technical Resistance is expected around 454.79/ 487.55/ 498.68 with Stops expected above.
On 4-Hourly chart, SlowK is Bullishly above SlowD while MACD is Bearishly below MACDAverage.
On 60-minute chart, SlowK is Bearishy below SlowD while MACD is Bullishly above MACDAverage.
Title :ETH/USD BUY LIMIT ORDER
Asset : Crypto
Symbol : ETH/USD
Type : Limit Order
Time Frame : 4hr
Entry Price 1 : $331.00
Entry Price 2 : $306.00
Stop Loss : $296.00
Take Profit 1: $371.00
Take Profit 2 : $406.00
Take Profit 3: $451.00
Trail your stop loss
Take profit 4 $487.00
Take profit 4 $506.00

ETHUSD to see downtrend further(4hr) |MACD suggests bearish biasMarket in last 24hrs
-ETHUSD saw a downtrend, riding the lower band
-Price volatility was high. The market moved ~7.52%, between $431.75 and $401.57
Today’s Trend analysis
-ETHUSD expected to see a further downtrend as lower highs are observed
-Price at time of publishing: $410
-ETH’s market cap: $46.3 Billion
-Oscillator indicators are mostly neutral. RSI at 35
-Moving average indicators are suggesting an downtrend. Ichimoku Cloud is neutral
-Volume indicators saw an increase in volume in the last few candles as red candles were observed suggesting a strong selling pressure
Price expected to see a further downtrend as lower highs were observed. Most of the Oscillator indicators are neutral. MACD line below the signal line, histogram size increasing in the negative direction. RSI at 35, below the midline in the neutral region. CCI with a value of around -212 in the oversold region with a downmove. Another interesting point to notice here is that the volume was increasing despite the red candles were observed suggesting a strong selling pressure.
----------------------------------------------------------------------------------------
The analysis is based on signals from 28 technical indicators, out of which 17 are moving averages and the remaining 11 are oscillators. These indicator values are calculated using 1 D candles.
DM to get details of the above analysis and list of indicator & their values used to arrive at the above conclusion.
Note: Above analysis would hold true if we do not encounter sudden jump in trade volume .
----------------------------------------------------------------------------------------
If you find the analysis useful, please like and share our ideas with the community!
- Mudrex

ETHUSD 4H Double top patternETh is close to a resistance and a fall is anticipated to at least the $400 region support before a long

ETHUSD to see a slight downtrend(4hr) | Lower highs observedMarket in last 24hrs
-ETHUSD moved sideways with rejection from upper Bollinger band
-Price volatility was high. The market moved ~5.71%, between $447.5 and $423.31
Today’s Trend analysis
-ETHUSD expected to see a slight downtrend as lower highs observed
-Price at time of publishing: $428
-ETH’s market cap: $48.2 Billion
-Oscillator indicators are mostly neutral. RSI at 53
-Moving average indicators are suggesting an uptrend. Ichimoku Cloud is neutral
-Volume indicators saw a decrease in volume in the last few candles as red candles were observed
Price expected to see a slight downtrend as Bollinger band continue to be squeezed and lower highs were observed. Most of the Oscillator indicators are neutral. MACD line below the signal line, histogram size increasing in the negative direction. RSI at 53, above the midline in the neutral region. CCI came back to the neutral region from the overbought region with a value of around -19. Another interesting point to notice here is that the volume was decreasing as the red candles were observed.
----------------------------------------------------------------------------------------
The analysis is based on signals from 28 technical indicators, out of which 17 are moving averages and the remaining 11 are oscillators. These indicator values are calculated using 1 D candles.
DM to get details of the above analysis and list of indicator & their values used to arrive at the above conclusion.
Note: Above analysis would hold true if we do not encounter sudden jump in trade volume .
----------------------------------------------------------------------------------------
If you find the analysis useful, please like and share our ideas with the community!
- Mudrex

ETHUSD to move sideways (4hr) | Trade inside Bollinger BandMarket in last 24hrs
-E THUSD moved sideways above the midline Bollinger Band
-Price volatility was relatively low. The market moved ~3.94%, between $400 and $385
Today’s Trend analysis
-ETHUSD expected to move sideways as the price is trading inside the band with relatively low volatility.
-Price at time of publishing: $391
-ETH’s market cap: $43.7 Billion
-Oscillator indicators are mostly neutral. RSI at 49
-Moving average indicators are biased towards a downtrend. Ichimoku Cloud is neutral
-Volume indicators saw a sudden decrease in volume in the red candle when the price fell suggesting a shift from sellers to buyers implying weak selling pressure.
Price expected to consolidate as it is trading inside the Bollinger band with relatively low volatility. Most of the Oscillator indicators are neutral. MACD histogram is changing it’s direction frequently, with the MACD and signal line are moving together. RSI at 49, around the midline in the neutral region with a downmove. CCI drastically decreased from 101 to -8, in the neutral region decreasing downwards. Another interesting point to notice here is that there was decrease in volume in the red candles indicating a weak selling pressure.
----------------------------------------------------------------------------------------
The analysis is based on signals from 28 technical indicators, out of which 17 are moving averages and the remaining 11 are oscillators. These indicator values are calculated using 1 D candles.
DM to get details of the above analysis and list of indicator & their values used to arrive at the above conclusion.
Note: Above analysis would hold true if we do not encounter sudden jump in trade volume.
----------------------------------------------------------------------------------------
If you find the analysis useful, please like and share our ideas with the community!
- Mudrex

ETHUSD to consolidate (4hr) | BB expands with higher lowsMarket in last 24hrs
-ETHUSD saw a sudden down move from $398
-Price volatility was very high. The market moved ~9.94%, between $398 and $362
Today’s Trend analysis
-ETHUSD expected to consolidate further after reaching a low along with that higher lows were observed
-Price at time of publishing: $390
-ETH’s market cap: $44 Billion
-Oscillator indicators are mostly neutral. RSI at 51
-Moving average indicators are biased towards an uptrend. Ichimoku Cloud is neutral
-Volume indicators saw a sudden increase in volume in the red candle when the price fell suggesting strong selling pressure.
Price expected to consolidate as Bollinger Band expands and higher lows were observed. Most of the Oscillator indicators are neutral. MACD histogram is negative, size decreasing in the negative region. RSI at 51, around the midline in the neutral region with a strong upmove. CCI drastically increased from -262 to -8, in the neutral region increasing upwards. Another interesting point to notice here is that there were higher lows observed with Bollinger Band expansion.
----------------------------------------------------------------------------------------
The analysis is based on signals from 28 technical indicators, out of which 17 are moving averages and remaining 11 are oscillators. These indicator values are calculated using 1 D candles.
DM to get details of the above analysis and list of indicator & their values used to arrive at the above conclusion.
Note: Above analysis would hold true if we do not encounter sudden jump in trade volume .
----------------------------------------------------------------------------------------
If you find the analysis useful, please like and share our ideas with the community!
- Mudrex
