ETHUSD Are they similar? Comparison to a prior price point for ETHUSD
Last time was a rocket to the moon
Curious to see what is awaiting us this time
Comment below what you think about my suggested similarities
Ethusdlong

ETH Hello every one this is a idea for ETH chart I Explained two scenario in this chart. but in my opinion scenario 1 more likely.
good luck.........

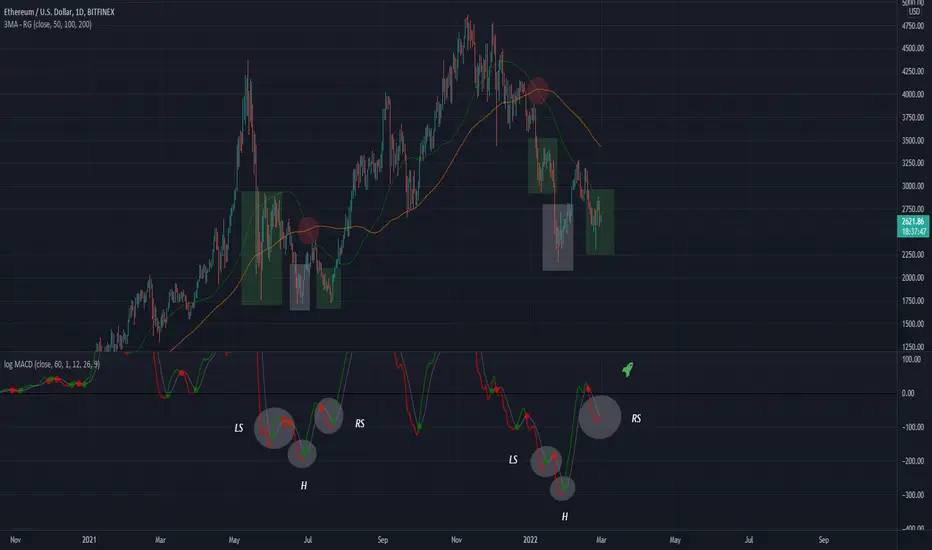
ETHUSD Critical AreaETHUSD Is at a critical price point, this has been seen as a line of support using this indicator in the past
If it repeats and bounces off bullishly, we will be seeing some big moves coming up
The MACD shows similar inverse H&S structures, in the rectangles are the seen and expected move for the MACD's future.

ETHUSD Chart H1Here is my view for ETHUSD on H1. The price should go down, you can put a pending order on the Order block or find an entry on LTF within OB Zone. Trade Safe!

ETHUSD Backwards Falling WedgeEthereum can be seen to be forming a large wedge structure, in which looked at in a reverse fashion a sharp breakout can be seen upon the ending of the 'falling wedge'
This breakout was a 134% increase from its bottom
This bottom is a crucial point in the evolution in price, providing the first bottom for the double bottom structure
I say price must be higher for this backwards falling wedge to exist because a falling wedge like this would only occur if price was in a descending fashion (when looked at backwards)
There is still room for ETHUSD to go way higher
Check out my God Candle idea above

ETHUSD I FULL LIVE ANALYSIS:If you Want to See More Daily Detailed Analysis, go ahead and click on the follow button. Please do feel free to like and comment with any questions should you have them!
In this video we are going to look through our ETHUSD Charts. We previously looked short at key sell zones on impulsive upmoves in the market. The current market sentiment with ongoing tensions has meant CRYPTO assets have fallen inline with global equities again..
On these falls we arrive at key zones for LONGS. This is because we expect buyers like ourselves to move into the market at KEY zones, reliant on Price action rules and core understanding of indicators and their correct use.
We can look long Lightly and manage our risk well as we accumulate our positions. Do not overtrade.

Ethereum God Candle March An idea for ETHUSD , with the previous extension to 4K and then retrace, this creates a massive zone for price to rise
The current March candle is positioned perfectly above the support level (dotted line)
I have reason to believe we will see a big run, for both Bitcoin and Ethereum . This isn't the end of the run.

Ethereum Break Ahead?Ethereum - Intraday - We look to Buy a break of 3051 (stop at 2978)
Trend line resistance is located at 3000. Trading close to the psychological 3000 level. A break of the recent high at 3050 should result in a further move higher. Short term momentum is bullish.
Our profit targets will be 3248 and 3298
Resistance: 3000 / 3050 / 3200
Support: 2880 / 2830 / 2750
Disclaimer – Saxo Bank Group. Please be reminded – you alone are responsible for your trading – both gains and losses. There is a very high degree of risk involved in trading. The technical analysis, like any and all indicators, strategies, columns, articles and other features accessible on/though this site (including those from Signal Centre) are for informational purposes only and should not be construed as investment advice by you. Such technical analysis are believed to be obtained from sources believed to be reliable, but not warrant their respective completeness or accuracy, or warrant any results from the use of the information. Your use of the technical analysis, as would also your use of any and all mentioned indicators, strategies, columns, articles and all other features, is entirely at your own risk and it is your sole responsibility to evaluate the accuracy, completeness and usefulness (including suitability) of the information. You should assess the risk of any trade with your financial adviser and make your own independent decision(s) regarding any tradable products which may be the subject matter of the technical analysis or any of the said indicators, strategies, columns, articles and all other features.
Please also be reminded that if despite the above, any of the said technical analysis (or any of the said indicators, strategies, columns, articles and other features accessible on/through this site) is found to be advisory or a recommendation; and not merely informational in nature, the same is in any event provided with the intention of being for general circulation and availability only. As such it is not intended to and does not form part of any offer or recommendation directed at you specifically, or have any regard to the investment objectives, financial situation or needs of yourself or any other specific person. Before committing to a trade or investment therefore, please seek advice from a financial or other professional adviser regarding the suitability of the product for you and (where available) read the relevant product offer/description documents, including the risk disclosures. If you do not wish to seek such financial advice, please still exercise your mind and consider carefully whether the product is suitable for you because you alone remain responsible for your trading – both gains and losses.

ETHUSD UPDATED ANALYSISClick here for More Daily Detailed Analysis.
Here we have our ETHUSD chart.
Yesterday we started to get short and took initial gains at a strong resistance zone. The price action at the areas mentioned coupled with our full analysis allowed us to form a short bias.
We can now look ahead to where we will get long. We previously saw a larger dip and a continued uptrend. We like to trade WITH the Trend so we can get LONG at the current fall towards an early support area.
Trade LIGHTLY at this area as we are dealing with HVA assets.

ETH Beautiful We can see higher high , higher low. If it confirms higher low i think we will see beautiful pump ! FIB correct

ETH two ways- STOCH RSI crossover
- Large bullish candle
- Broke 21 & 50 EMA
- EMA's bullish crossover
Crucial that we break the .618 FIB & resistance zone in order to gain momentum for continuation

ETHUSD Final Pump IdeaThe final pump of the earlier run for ETH pushed it through 0.618
Perhaps this is suggesting that the final pump for this run will push price through 1.618
I have drawn the circle to include the last cycle aswell as this bull cycle

ETH Dominance Pivot Point0.618 can be seen as a pivot point, prior rejection at this level, even though a bounce was seen at the 50MA
Now price is at the 50MA and above this pivot point level, the dominance is likely going to bounce again (as seen previously) off the 50MA and push Ethereum's dominance higher.
This aligns with my current stance on ETHUSD

Using another indicator ETHUSD Using this indicator called "McDonalds" We can see how ETH has touched for the second time along this curved "parabolic" trend
It is a nice buy signal.
Points labelled 1,2 are comparable points to what we are seeing now except on a much larger scale
Last leg of bull for ETH imo

Using the MACD - ETHUSDTwo distinct inverted head and shoulder patterns have formed on the MACD
Last one played out bullishly for price with the right shoulder allowing price to move upwards with the MACD
We will see how this recent ones right shoulder plays out
Ethereum Price Targets and Stop LossEntry Range: $2730 - 2840
Price target 1: $2990
Price Target 2: $3170
Price Target 3: $3500
Stop Loss: $2600

ETHUSD, can we make another Swing High at the top?Hi Traders,
Looking at the Daily time frame we can see that price is moving within a reversal structure which has room to climb to the top before it makes a reversal downwards. Looking at the current price action we near the bottom boundary which may be tested again before getting breakout of the respected trendline.
In my view, I am short term bearish and long term bullish. Look for LTF opportunities on this pair.
Comment below and share your view, click the like button if you agree!
Trade Safe!

ETH Ethereum Price TargetAfter ETH hit the support level and bounced from it:
Now I see the $3300 resistance as a possible price target for Ethereum in the war context right now.
People will also consider digital currencies to preserve capital especially in Russia, where the national currency is at all time low against the US dollar.
In case of a sell-off, the 1800-2200 area is a buy opportunity in my opinion.

ETH Weekly AnalysisEthereum did get below significant zone a couple of weeks back, which turned from support to resistance. Although we saw a second strong rejection to the downside, we're still below the zone, which needs strong power from bulls to get through.
Although bulls would be right by saying there is some positive development (rejection of move to the downside, outflow of crypto from exchanges, bids from whales), I think we will see ETH moving towards the 2k area, which will act as the significant support and we may see trend reversal.

ETHUSD Formation identificationIdentifying this formation on ETHUSD
It can be seen on the second one a lower lower was produced that is the only major difference between the three
We could be seeing a leg up and completion of the formation that is currently being produced

ETHUSDT - Trend Breakout!!ETHUSDT (2h Chart) Technical analysis
ETHUSDT (2h Chart) Currently trading at $2630
Buy level: Above $2670 ( Buy After Breakout)
Stop loss: Below $2490
Target 1: $2750
Target 2: $2865
Target 3: $3040
Target 4: $3190
Max Leverage 3x
Always keep Stop loss
Follow Our Tradingview Account for More Technical Analysis Updates, | Like, Share and Comment Your thoughts

ETHUSD BID ZONEPress the Follow button for more Daily Detailed Analysis.
Market Sentiment over the weekend proved to be hard hitting across various different assets, especially Crypto. Often this asset class will follow equity markets as negative sentiment Travels.
At times like this it is important to control your risk appetite. Times of huge uncertainty and pending news events can cause FAST moves and therefore we must change our approach. This means spacing out positions to avoid any clumping and lowering your size.
On this fall we can look to get lightly long at the approaching price action level. This is in line with the LONG term trend.
Use the eclipse symbols as a guide.

ETHUSD - ProjectionsThis post is likely to get a lot of hate but I am simply providing 2 scenarios for ETH.
Scenario 1 - Blue arrow.
BTC remains dominant overall crypto pairs even ETH although it's proving itself by having gained interest in blue chip companies like Microsoft. I am a HUGE fan of ETH and believe in the future it will be a major leader in the crypto space (more than it already is). If BTC continues it's bull cycle and reaches ATH and goes further then ETH will do exactly the same.
Scenario 2 - Orange arrow.
Should BTC turn bearish then it has capacity to easily drop another 25-27k in price! Now take a look at the damage done by the shallow pull backs we have seen already. A BTC sell off (which is very possibly) would be catastrophic to the ETH and all other ALTS. Should the crash come ETH will see $280 which I will be buying until I can't buy anymore.
Now it's important to remember before I flooded with hate comments that either of these scenarios can happen but it wont be an over night move. It will be over the course of many months of a bearish or bullish cycle.
