ETH weekend predictionAfter being rejected by the resistance:
a correction to the $2550 support is possible this weekend.
Looking forward to read your opinion about it.
Ethusdlong

ETHUSD Bearish Breakout! Sell!
ETHUSD trading in a strong downtrend
recently broke through a massive key support level 2850
who turned into a resistance level
So I expect to retest the resistance
Then a downward movement!

ETHUSD LONG ZONE ANALYSISPress the Follow Button after watching to see more Daily Detailed analysis. If you have any questions please ask them in the comments section!
Here we have our ETHUSD charts..
We recently looked short as we touched key price action levels. Lots of traders are now growing in popularity and their impetus on this asset. Longer Term timeframes illustrate a clear Uptrend which we can continue to follow. Remember, look at what you can actually see on your chart... It really does help a LOT..
Market Memory and understanding price action is imperative to trading success. This becomes ever more notable when viewing ETHUSD, because we can accurately take our entries and exits based on what Traders are doing. Again, this is all on the chart. Fundamentally, recent news comments has improved the upside bias of STABLE cryptocurrencies. Trade HVA's safely and lightly as they can move fast. It also helps Trading in stages rather than Trying ONCE with one trade..
Thanks for watching and See you in the next analysis!

ETHUSD Targeting The Equality ObjectiveIn this update we review the recent price action in ETHUSD and identify the next high probability trading pattern and price objectives to target.

Eth Bullish Ranging ChannelETH is looking quit bullish to me. i make 5 success trades using this channel. and I hope it will continue in this channel for coming months or weeks

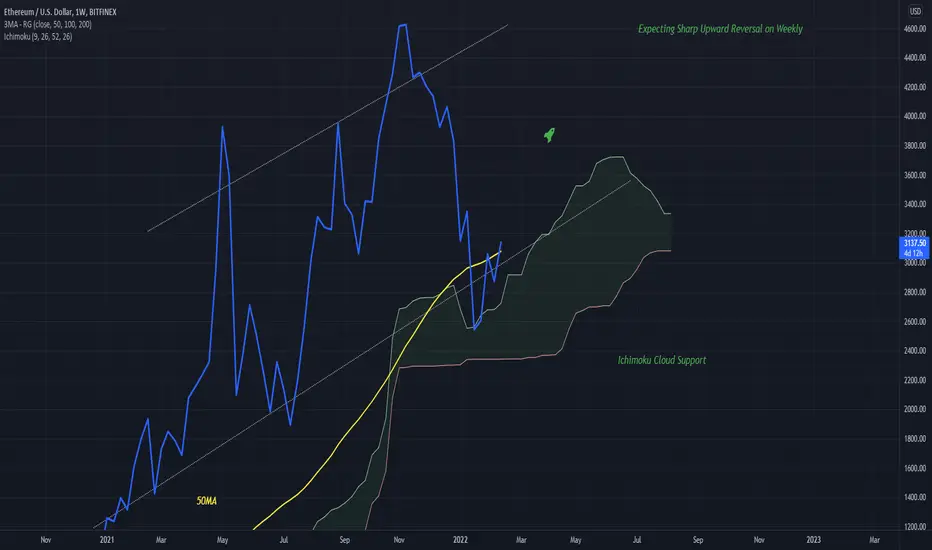
ETHUSD Weekly StatusViewing this you can see the cloud and 50MA both acting as a support for price on this chart for ETH weekly
I view a move upwards coming, continuing this little channel (or structure) that has formed
Still bullish on ETH, the signs are there
ETHUSD Chart H1Here is my view for ETHUSD on H1. The price should go up, you can put a pending order on the Order block or find an entry on LTF within OB Zone. Trade Safe!

ETH/USD BULLISHEthereum has unfortunately broken through several resistance levels in the last weeks. We have now seen a strong trend upwards from support at 2508 . and support at 3310 . Eth has a potential to continue rising.
A note however: The market is currently not very stable, the resistance level at 3310 might not be broken through.
Entry price: 3100
Take profit at resistance levels at your will-
Target: 4200 and above
Not financial advice.

ETHUSD PRICE ACTION..Don't forget to Click on the follow button for more Daily Detailed Analysis. Please do ask any questions in the comments section should you have them!
Here we have our ETHUSD on the 4H Chart..
Rip Roaring movement yesterday saw most assets fluctuate between support and resistance levels. Most gains were Re-recovered partly after these moves. Nonethless we exited at targets and have a newly formed plan..
If you are looking to the longside on the current new uptrend, it is ideal to get long on a fall to some comfortable support. NOTE that is if we can get there. There is no point in entering any longs too late.
Look to exit at the eclipse symbol area.

#ETHUSDT 100% Accuracy so far, What's next?Welcome to this quick update, everyone.
As per my last chart, ETH dropped to our buy zone and we bought both on spot and leverage.
The average entry is around $2885.
The next resistance is around $3200.
A break and close above this level will trigger a rally towards $4000.
The pattern is playing out perfectly.
So this is my plan:- I'll be holding positions with SL around $2936 with a target of $3860 to $4000.
What's your plan?
Let me know in the comment section.
Also, If you like this chart, do hit the like button and share your views in the comment section.
Thank you
#PEACE

ETH Price ETHUSD H1Here is my view for ETHUSD on H1. The price should go up, you can put a pending order on the Order block or find an entry on LTF within OB Zone. Trade Safe!

ETH Price ETHUSD W1Here is my view for ETH Price ETHUSD on W1. The price should go up in long-term, you can put a pending order on the Order block or find an entry on LTF within OB Zone. Trade Safe!

ETHUSDThe Inverted Head and Shoulders pattern mentioned on Bitcoin, can be also detected on Ethereum daily chart with a neckline around 3250

ETHUSD, 15m - Long Trade Idea - 2990TETHUSD, 15m Buy
Entry - 2890.00
Stop Loss - 2860.00 (30 pips)
Take Profit - 2990.00 (100 pips)
it looks as if it continues to hold this support.. lets see if it happens this.. the price its possible to bounce back on 3000$ area

ETHUSD Weekly MA PlacementThe price has placed a candle beautifully on the 50MA
this is a very bullish weekly placement
10K + ?

ETHI think the wave D has started and probably has wave E. The dark blue line in top is the most important line and if it breakup, the price can also increase the width of the dark blue channel. This chart and ETHBTC chart are most important charts for altcoins.

ETHUSD Bounce as expected ETH has bounced off the middle band as expected, from here we are probably going to go up really fast
This weekend may be significant
RSI also aligns with an expected pivot point

$ETH critical Area! BEWARE!!!!!!!!!!!$ETH has broken the monthly trendline, so it should make a HL that's the point you must caught the best LONG opportunity. For Now, it is making a CUP & Handle pattern but I usually don't like these kind of patterns because they mostly get failed so the situation I'm thinking about "if the brown line which is daily trendline if that breaks short with 3x-5x and stop loss above the top wick!
1st Scenario (only if you like patterns): CUP & Handle breakout retest - LONG
2nd Scenario (if you are using STEEL STEPS which I prefer the most): Daily trendline break - SHORT with 3x if you dont want to wait for LH. If you can wait for LH short with 5x - 10x

ETHUSD Chart H1Here is my view for ETHUSD on H1. The price should go up, you can put a pending order on the Order block or find an entry on LTF within OB Zone. Trade Safe!

ETHERIUM 4HOURLY NEAR FUTURE PREDICIONSTechnical Analysis Summary
ETH/USDT
TREND ANALYSIS
We have 2 Uptrend in green color (Internal Uptrend and long term uptrend)
Be careful trends need to be modified when broken to the new peaks(Downtrend) and lows (Uptrend).
FUTURE PREDICTIONS
We have many resistance and support levels that I have mentioned above.
I use thickness as an indicator of strength of levels (ONLY FOR VISUALS).
Good luck everyone, stay safe!
If you need help don't hesitate to send me a message or comment
If you find this content beneficial please don't forget to LIKE and FOLLOW
Trading Involves High Risk
Not Financial Advice
Exercise Proper Risk Management

ETHUSD - Long Trade Idea - go to 3200ETHUSD, 15m Buy
Entry - 3095.00
Stop Loss - 3070.00 (25 pips)
Take Profit - 3195.00 (100 pips)

ETHUSD: Positive outlook for ETH: Possible top at 10k to 14k! 🚀Hello my friends!
If we analyze Ethereum with the Trend Based Fibs Extension, a pretty clear picture appears.
On the last up, the correction to the 4 was in the Fib 0.5/0.38 area. This time we also corrected into this area. If we now apply the Trend Based Fibs Extension, we get a pretty clear target picture at minimum 1.618 (8,000 USD).
If ETH were to go to Fib 3.272 like last time, we would be at around 14,400 USD this time. If we calculate conservatively and we reach 2.272, the target point would be slightly above 10k. Lets cross our fingers! 😀
BTW: My Bollinger Band is here 350 Daily (StdDev 0.618, 1 and 2).
--
Let's see what happens.
Happy trading. 😀
BTCINVESTING
--

ETHUSD Chart H1Here is my view for ETHUSD on H1. The price should go up, you can put a pending order on the Order block or find an entry on LTF within OB Zone. Trade Safe!
