ETHUSD LONGEthereum has been seen a resistance of 3987 in recent times, until a downtrend on the asset to 2649 striking as it's new support. The recent uptrends is seen to be elevating past the resistance
Ethusdlong

ETH Buy a break setup.Ethereum - Intraday - We look to Buy a break of 3681 (stop at 3609)
Daily signals are mildly bullish.
Pivot resistance is at 3677.
A break of bespoke resistance at 3680, and the move higher is already underway.
We are trading within a Bullish Ascending Triangle formation.
Our profit targets will be 3881 and 3941
Resistance: 3680 / 3800 / 4000
Support: 3500 / 3400 / 3300

ETH strong position3.516$ to 3.463$ a sharp drop in the ETH price but this is a healthy situation and we currently see how strong ETH is, the behavior of BTC will be of great importance as it always decides the direction ultimately

ETHUSD Chart PredictionHey folks, making my first public post today. Been watching ETHUSD for a while and decided to share my checklist for ETH's next big breakout. Hope you find some value here and I'm totally open to constructive criticism and feedback. Thanks, Stefan

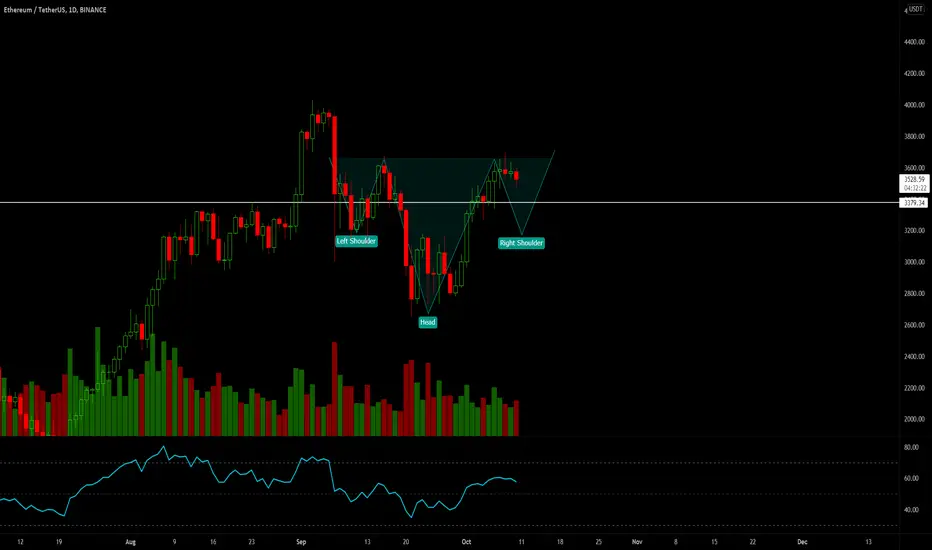
ETH Bullish 📈Ethereum looks to be quite bullish for now in the macro stages.
We are currently in the looks of it in this inverted head and shoulders pattern which is bullish.
If we dip I will be picking up some more eth.
However we may not dip more as we are lagging behind btc and btc looks like it can rise some more!
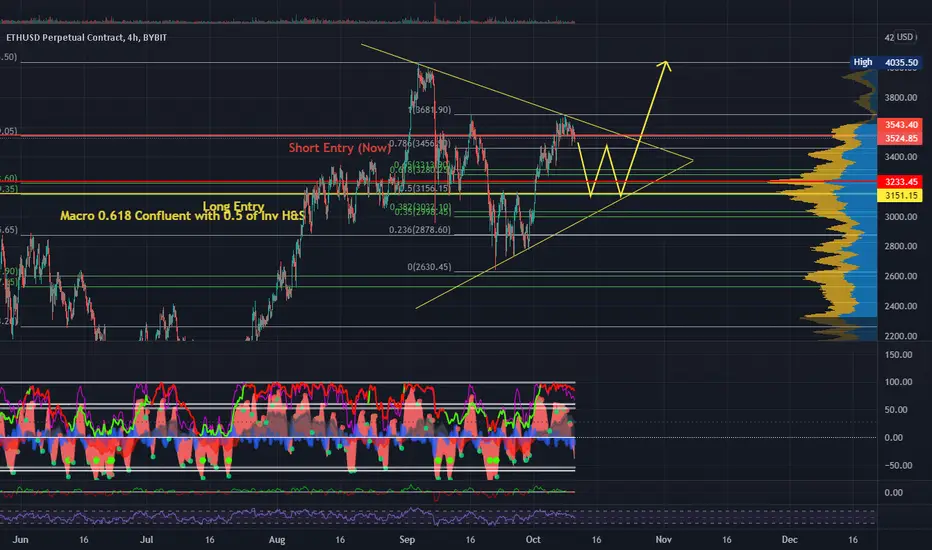
My ETH/USD Plan - Short Now, Long LaterWe are currently rolling over after hitting the neckline of this inverse head and shoulders. We will create the right shoulder and reverse to the upside when price hits the macro 0.618 which is perfectly confluent with the 0.5 level of the inverse head & shoulders. Any proper inverse head and shoulders should never pass the 0.5 line with the shoulders and the macro 0.618 reinforces the heavy support in that area along with the lower trendline. I'm currently short from the 0.786 line (marked in red) and I will take profits and enter a long at the yellow line. I'm expecting a mirror image from the other side, so the right shoulder should look something like a W/double bottom.
The ETH Scenario *I* Am Looking forHey y'all! I wanted show you in this post the scenario in which I'm looking to enter an ethereum trade. Remember, it's about finding 'the' trade, not 'a' trade. What I mean by this is that if this scenario doesn't play out, then I will simply look for my next opportunity, rather than force a trade that i am ill-prepared for. No need to force an entry, better to prepare for a scenario and if it strikes, we strike.
Nonetheless, here we are looking at eth on a higher time frame. Ultimately, I am looking for ETH to have a small pull back, and form the right shoulder for a massive inverse head and shoulders pattern. The green region is where I will look for entry, and the yellow line is around where I'd set my stop loss. Let me know if you have any questions, and react to this if you're going to ride this trade with me.
As Always, this is not financial advice, and I am not recommending this to anyone for their own use. This is merely how I am approaching the market. If you gained value from this analysis, be sure to like and follow the page. All followers may feel free to reach out through message to ask me any questions or concerns they may have!

ETHUSD Very strong bull caseEthereum has just landed above a massive major trendline
It has also recovered from a pullback to .786, as it did in its first bull run
If its anything similar to the first bullrun move, the bars pattern I have placed is what we should be looking for
I want 8k
Still not sure whether I should jump out or just hodl through another bear cycle

ETH Risks Pullback To $3,400 Before Final Approach To $4,000
Ethereum price rejected from $3,600, forcing bulls to seek refuge above $3,500 or risk declines to $3,400.
Short-term technical indicators gradually flip bearish, implying that the path with the least resistance is downward.
Ethereum rally to $3,600 has not been without struggle and delays. Bulls have been putting up an aggressive fight since the gigantic smart contracts token tumbled under $3,000 in September and tested support at $2,650.
For several times, Ethereum failed to clear the resistance at $3,200, resulting in pullbacks below $3,000. Nonetheless, bulls took complete control of the market in October and subsequently triggered gains that have recently brushed shoulders with $3,600.
The uptrend to $4,000 is still a pipedream, especially with Ethereum facing intense selling pressure in the supply area around $3,600. If Ether fails to close the day above this zone, investors can expect a rundown to $3,400 or $3,200 in the coming sessions and on the weekend, where ETH will become more attractive to the bulls.
Ethereum Fights To Keep Uptrend To $4,000 Intact But Is Immediate Recovery Viable?
Ethereum has been rejected from the supply zone in the red, delaying the move to $4,000. The pioneer smart contracts token trades at $3,565 at writing amidst an intense tug of war between bulls and bears.
A daily close below $3,600 could see overhead pressure rise, while a break under the ascending trend line support will add weight to the potential breakdown targeting $3,400 and $3,200, respectively.
It is worth remembering that the Moving Average Convergence Divergence (MACD) could soon send a sell signal, compelling more traders to dispose of Ether. As long as the MACD keeps dropping toward the mean line, the pulldown on Ethereum will carry on.
At the same time, the Relative Strength Index (RSI) shows that sellers are gradually gaining strength. The odds favor the bears as the MACD nears the midline, while a continued drop to the oversold could trigger a selloff.
Ethereum Price Intraday Levels
Spot rate: $3,573
Trend: Bearish
Volatility: Expanding
Support: $3,500 and $3,400
Resistance: $3,600 and $3,800


ETHUSD Looks really bullishEthereum looks really bullish
I want to see how high we can go this time
Consistently bouncing off the 50MA and the curved channel that has formed

ETHUSD - Long Trade Idea - 3500 targetETHUSD - Buy, 15m
Entry - 3400.05
Stop Loss - 3470.05 (30 pips)
Take Profit - 3500.05 (100 pips)
ethusd hold 3470.05 support today.. and a descending triangle pattern seems to be broken.. im entering a long position.. and will go to test next resistance 3470.00 and lets see!!

ETHUSD $4,000 ?If price breaks last lower high wait for retest and candlestick confirmation to enter long position to $4,000. I think ETH will have a major sell off at $4,100. If so wait for price to hit the blue area for possible long positions.

5 Oct: ETHUSD to see further downsidePrices are testing a key resistance level on the daily and H4 time frame in line with the 78.6% retracement, we could see a further downside to our support level at 3156 in line with the H1 support area.

Long ETH 28.09.21I'm going to open LONG arround 2803, stop 2775. Take 1-2850, take 2-2900, take 3-2950. Good luck!

Good weekly close for Ethereum. What's next?Bulls lost control last time when 3450 failed to hold. Now, must reclaim and stay above 3450 to continue to 3950, ATH and then 5k.
Must hold 3370 or 3275 to keep this momentum going. At last hold 3055 avoid reversal

Ethereum Analysis, the way to 4kHello everyone, as we all know the market action discounts everything :)
_________________________________Make sure to Like and Follow if you like the idea_________________________________
The September dip is now being bought by investors. Ether surged over 9% on Friday, the first day of October.
The ETH market has been having a good couple of days after the trend turned Bearish back in the 6th of September where the price dropped from 3981.54 to 3004.99 in 1 day, That's almost a 25% decrease in value in a 24h period...
In the last 5 days, we did notice a good increase in the price with a good amount of volume in the market. the price jumped from the 2789.23 range back to the 34411.59 today.
The Bulls are trying to reverse the Bearish trend in hopes to hit the 4000 range again.
Different Scenarios for the market :
Scenario 1 :
The market is trending near the first resistance level located at 3484.94 with a strong upper momentum movement that could push the price to the 3657.85 level where we will see a battle over control between the Bears and the Bulls, And the Bulls will try to breakout that level which would show how much power they have and people will buy in even more gaining more strengths that could lead the ETH price back to the 4000 zone.
Scenario 2 :
The bears are still holding some power over the trend and they might push back and drive the price back to the support level at 3274.92 or even the 2929.14 level.
That's where the Bulls will gather most of their forces and bring the price back up to the range of 3420.70.
Technical indicators show :
1) The market is above the 5 10 20 50 100 and 200 MA and EMA (Strong Bullish Sign)
2) The ADX is at 32.37 showing that the market is trending with a positive crossover between DI+(23.48) and DI-(23.31)
3) The RSI is at 56.28 showing good strength in the market, with no divergence found between the market and the indicator
Daily Support & Resistance points :
support Resistance
1) 3274.92 1) 3484.94
2) 3161.59 2) 3581.63
3) 3064.90 3) 3694.96
Weekly Support & Resistance points :
support Resistance
1) 2929.14 1) 3657.85
2) 2470.01 2) 3927.43
3) 2200.43 3) 4386.56
Fundamental point of view :
Ethereum is certainly making strides towards the Ethereum 2.0 completion. Just a few days ago, the project announced the arrival of its Ethereum Altair upgrade. To specify, the upgrade will be taking place sometime this month.
The purpose of Ethereum 2.0’s launch is to fully deploy a Proof-of-Stake consensus onto its platform. This model should eliminate the platform’s long-striving issues of high gas fees, congestion, and limited scalability.
"It seems like Ethereum is losing Steam. As a result, companies are looking into platforms like Cardano, which is used to build dApps, and Solana, which has seen a nearly 4,800% growth since September 2020." According to FXempire
This is my personal opinion done with technical analysis of the market price and research online from Fundamental Analysts and News for The Fundamental point of view, not financial advice.
If you have any questions please ask and have a great day !!
Thank you for reading.

ETHUSD Where will the Bull go?/Bullish PerspectiveBYBIT:ETHUSD
Notice in chart---Red: rise; Green: fall
1D trend chart
-
1. Pattern is forming
Since 2020 Dec., ETH takes around 10 months to build a beautiful Cup and Handle .
We just confirm the handle formed while the orange downtrend line was broken out recently.
From the period this pattern took, we presume that a surge will happen before 31 Dec '21
*Cup and handle is a strong bullish signal that extending an uptrend.
-
2. What should we notice?
Considering the pattern may not form directly, should presume that price might retest the downtrend(orange line) again.
Also, all previous highs are resistance for price, so remember to be cautious when 4035.5 and 4383.5 coming, consolidation easily occur while approaching them.
Furthermore, nothing ever get 100% chance, so we shall setup stop loss.
-
3. How can we use it?
For Aggressive traders, you could buy immediately while the handle downtrend(orange line) was broken, once this pattern completed, your risk is low as the price go high.
For Conservative traders, you could wait the downtrend(shallow blue line) or previous high(4383.5) are taken out, this Cup and Handle pattern will be completed at that time.
-
4. Bullish Target?
With Fibonacci levels, there are some long-term targets we expect.
a) 5422.30~5842.40----Fib(1.272~1.382)
b) 8202.55----Fib(2)
Anyway, never forget to control your risk
Stop loss: 2642.2
-
Let's see where ETH can bring us to!
Trading is a reflection of yourself, sometimes you need to take a step back to see more.
Learn more daily and Be ready for any opportunities daily.
Have a nice trading!

great setup ETH/USDT 2H for going Longafter breaking our price level you can go for it..everything is on chart

ETHEREUM , Full Analysis (short-term to long-term)hey guys , the whole analysis is here in the description. make sure you read it all . so let's get it started !
we start with longer terms :
this pic is for the ones who are looking for a LONG-TERM analysis , so it'll probably take 1 and half to 2 years for ETH to get there. as you see , Ethereum could be repeating the cycle . I marked two red zones for y'all . both have descending channel and ETH seems to be repeating that pattern again . alrighty , let's move on to the next pic !
so here's our elliott waves ,we had the first two waves . the second wave which is a correction wave is completed and the third wave is already started . so what is our TARGET here ? it's easy to find out the target , just by Fibonacci Extension . and well , 10774 $ is our target and that is when the third wave is probably gonna end . "so 1 question , Armin . when should we buy it ?!" -----> next pic !
as yall see Ethereum broke outta the descending channel and price has gone up a bit . so price is in a triangle . bearish or bullish ? I say bullish due to all of these analysis , but those who wanna buy for the long-term , it's better for the price to break the red line and that's when it's confirmed that it will rise the way I told in the previous pics. so WHEN TO BUY ? after the red line breakout. "Armin , no short-term analysis ?!" , dude wait , check the rest .
alright , in this pic the price has met the MA50 , and I'm guessing it'll have a little correction and then go back up ! what are the targets for short-term ? the red zone and then the red line that we talked about earlier.
and at the end , here we are with 1H timeframe. there are two waves that I drew , it's simple . either it will break the top of that little triangle and rise after it OR as I said in the previous pic , it will break the bottom and rest a bit and then go back up.
So guys this was the full analysis of ETHEREUM , if you liked it , hit the like . and if you wanna see some more , follow !
GoOoOod LuUuUucK !

ETHUSDT Beginning of the bull run?ETHUSDT (4H Chart) Technical analysis
ETH/USDT Currently trading at $3250
Descending Channel
Long Entry: $3200 -$3250
TP 1 : $3450
TP 2 : $3650
TP 3 : $3840
TP 4: $4000
Stop Loss : $2800
Max leverage : 3x
Always keep stop loss

#ETHUSDT Looks ready for another rally after the retest!!Welcome to this quick Update, everyone.
If you are reading my updates for the first time do follow me to get more complex charts in a very simplified way.
I also post altcoin setups on Spot, Margin, and Futures.
ETHUSDT Looks promosing here,
Broke out of the channel .
I personally accumulated ETH around $2900 and holding on low leverage.
I expect some retracement here $3045 to $3185 and then continuation.
Upper resistance levels are:-
$3333
$3325
$3615
$3900
IF ETH IS ABLE TO BREAK THE 4K AREA AGAIN, IT'S HIGHLY LIKELY WE WILL SEE A NEW ATH!!
What's your thought on this?
Do you think this correction is over?
Do you think ETH could easily pump from here?
Do hit the like button if you like this update and share your views in the comment section.
Thank you
#PEACE

Ethereum Price Remains Drab Under $3,000 Risking Major Dip
Ethereum aggressively fights to step above $3,000 a cloud of doubt reigns at its ability to overcome congestion at $3,200.
A dwindling on-chain activity is a bearish sign for Ethereum, implying that bulls may not have the power to sustain an uptrend.
Ethereum bulls have been pushing for action above $3,000, but all attempts made toward $3,200 have resulted in futility. The flagship smart contracts cryptocurrency token had retreated to a September low of $2,650 more than a week, but collectively, little progress has been made since then.
Meanwhile, some selected altcoins seem to be ignoring the mundane price action across the crypto market. Binance Coin leads the recovery in the top ten with an 11.6% gain over the last 24 hours, with Avalanche coming second with a 6.1% upswing. The market is mixed red and green across the board, whereby bulls will likely emerge intraday winners throughout the trading on Thursday.
Ethereum Could Fallback Before Heading For A Significant Swing To $4,000
The gigantic smart contract token is experiencing a lot of trouble gaining traction above $3,000. Although the short-term technical outlook appears ripe for a breakout above this level, it is not guaranteed that Ether will make it past $3,200 and sustain an uptrend at least to the supply zone in red around $3,600.
According to the 12-hour chart, Ethereum is locked within the confines of a descending parallel channel. Its key downside is supported by the 200 Simple Moving Average (SMA), which rests in the demand zone highlighted in green. The channels’ middle boundary also contributes to securing this anchor zone.
A break above the upper boundary would boost Ether above the $3,000, but the token needs to push past $3,200 to affirm the uptrend to $3,600. However, the 50 SMA has recently crossed below the 100 SMA; an index considered bearish despite not being as strong as a death cross pattern. The last time this technical outlook occurred was on June 4, and Ether subsequently dropped by 41%. Hence the magnitude of its effect on the price cannot be overemphasized.
Meanwhile, Ethereum’s on-chain activity has been dwindling over the last 30 days, and this is taking a toll on the price performance. Data by Santiment shows the network growth at roughly 80,000 new addresses per day, down from a 30-day high of nearly 110,000.
Suppose this metric continues to drop in the coming days, investors should anticipate a difficult recovery phase and perhaps the possibility of Ether sinking to $2,400, where it is likely to be attractive to more bulls.
Ethereum Key Intraday Levels
Spot rate:
Trend: Short-term bullish bias
Volatility: Low
Support: The 200 SMA and $2,650
Resistance: $3,200 and $3,600
