ETHUSD SHORTBEARISH PATTERN
LH, LL formation
breakout is given after breaking LH, but
There are 2 confluences here:
1) Trendline as Resistance
2) Fibonacci 78.60 % may act as Resistance as well
Ethusdshort

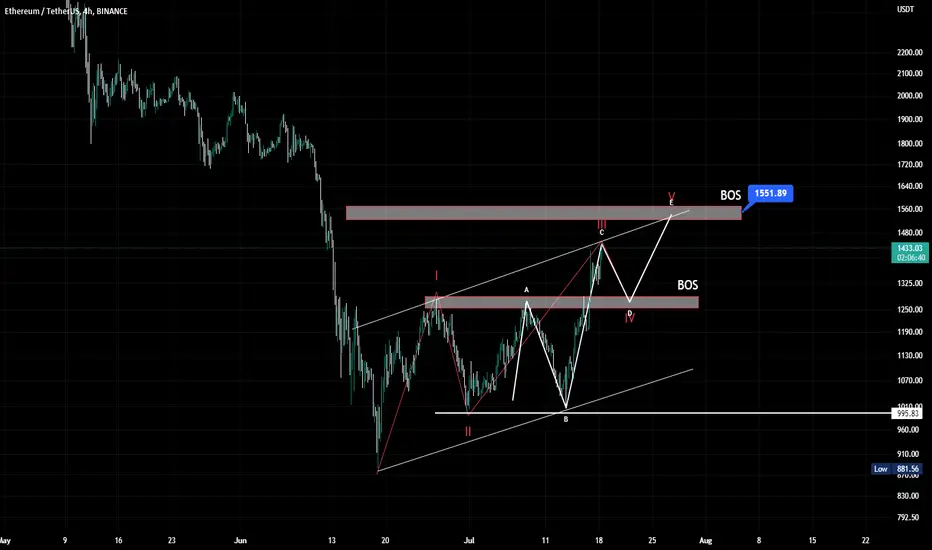
ETHUSDT: Medium Term Wave LevelsIn today's review, I present to you my trading plan for Ethereum.
I don't like WXY models and truncations in corrective waves, but it's almost impossible to work and trace the possible logic of price behavior otherwise.
Criticism from the outside is almost inappropriate, because. I am not trying to prove anything, but simply sharing my plans for the near future, which may help to understand my actions.
In general, the structure of Ethereum wave levels is similar to the wave structure on bitcoin. In both cases, I am considering the formation of a large wave 4, after which the price may, with a high probability, go to new historical lows.
What drivers can serve for such dynamics?
So far, it's hard to predict.
However, they may appear later, when the price will be already in a downward momentum.
Do I consider a scenario with continued growth in the current market structure?
Definitely - Yes.
But, this can be determined by the fact of the formation of bullish patterns of continuation of the trend.
Now I am guided by dry facts, price dynamics, trading volume and the general structure of prices in the crypto derivatives market.
I will consider going short Ethereum at the end of wave 5 of wave C (in wave 4).
Good luck planning good trades)
Best Regards,
CEO Tornado Capital

Ethereum Sell into the resistance.Ethereum - Intraday - We look to Sell at 1259 (stop at 1311)
Daily signals are bearish.
A lower correction is expected.
Early optimism is likely to lead to gains although extended attempts higher are expected to fail.
1281 has been pivotal.
1275 has been pivotal.
The trend of lower highs is located at 1269.
Our profit targets will be 1135 and 1105
Resistance: 1280 / 1400 / 1500
Support: 1200 / 1150 / 1100

ETHUSD Idea H1Here is my view for ETHUSD on H1. The price could go down, you can put a pending order on the Order block or find an entry on LTF within OB Zone. Trade Safe!

What if?I'd start selling my Kidney at this point. haha Kinda look possible for some reason but I do really HOPE not.
Looks double top, heavy order block..really bearish so far.

ETH: Mildy bearish!Ethereum
Intraday - We look to Sell at 1175 (stop at 1211)
Expect trading to remain mixed and volatile. 20 4hour EMA is at 1175. Short term bias has turned negative. We look for a temporary move higher. 1193 has been pivotal.
Our profit targets will be 1086 and 1066
Resistance: 1150 / 1200 / 1280
Support: 1100 / 1050 / 1000
Please be advised that the information presented on TradingView is provided to Vantage (‘Vantage Global Limited’, ‘we’) by a third-party provider (‘Signal Centre’). Please be reminded that you are solely responsible for the trading decisions on your account. There is a very high degree of risk involved in trading. Any information and/or content is intended entirely for research, educational and informational purposes only and does not constitute investment or consultation advice or investment strategy. The information is not tailored to the investment needs of any specific person and therefore does not involve a consideration of any of the investment objectives, financial situation or needs of any viewer that may receive it. Kindly also note that past performance is not a reliable indicator of future results. Actual results may differ materially from those anticipated in forward-looking or past performance statements. We assume no liability as to the accuracy or completeness of any of the information and/or content provided herein and the Company cannot be held responsible for any omission, mistake nor for any loss or damage including without limitation to any loss of profit which may arise from reliance on any information supplied by Signal Centre.

ETHUSD Idea H1Here is my view for ETHUSD on H1. The price could go down, you can put a pending order on the Order block or find an entry on LTF within OB Zone. Trade Safe!

False break out. Hi guys! As seen on the daily chart, Eth approached is trying to break through the diagonal channel. It is also clearly seen that such slight false break-outs happened in recent past. So the price may still come back to the channel and we will see 700. Considering bearish market in general it is still very possible scenario. But lets see a little for confirmation of break out.

ETH SHORT 50% of consolidationWe are about to hit the 50% level of the consolidation while the downfall, in many times this is a good entry

ETHUSD Prediction H1Here is my view for ETHUSD on H1. The price could go down, you can put a pending order on the Order block or find an entry on LTF within OB Zone. Trade Safe!

ETHUSDWeekly Timeframe
This timeframe indicates a corrective pattern in the overall trend, Drilling down to the daily timeframe for end of trend confirmation in order to get in with the trend.
Daily Timeframe
From this timeframe a reverse symmetrical triangle is spotted and a sub wave for wave A of the corrective pattern, 3 WAVE B is also completed now a 5 WAVE down hourly is to be completed in order for a trend continuation to considered.
HOURLY TIMEFRAME
5 wave move down with a 3 wave internal structure.
Currently in a sub wave B of the final move down.

ETH Sell a break of $1700.Ethereum - Intraday - We look to Sell a break of 1698 (stop at 1751)
Daily signals are bearish.
1700 has been pivotal.
Price action continues to gravitate towards crucial support levels with aggressive selling interest.
A break of bespoke support at 1700, and the move lower is already underway.
Our profit targets will be 1572 and 1552
Resistance: 1800 / 1900 / 2000
Support: 1700 / 1600 / 1500


ETH Will Rebound - 2400$ IS the NEXT TargetI usually make long-term predictions with solid technical analysis. I have posted after a long time. Sorry for that.
This is just a short analysis chart for ETH. Try to understand the chart with the help of Swing high candles. I will post more.
If you have any questions, then ask in the comments section.

ETHUSDT : 1 HOUR CHART : UPDATEStop loss was hit at 1134
After that formation of LH LL completed
Can be short when HL is formed

ETHVery simple ... Very clear
A downtrend in the new step will start soon.
This is my personal opinion. Please do not trade based on my analysis and data.

ETH Bottom probably not in yetHi everyone,
Looking at the previous bear market I don't believe the bottom is in yet for Ethereum. We are short of a full correction and we need one more deep push down. I am rather surprised because of the bullish sentiment recently on tradingview calling possible bottoms. If you are long enough in crypto you will know that it will go higher than expected in bullmarkets and it will go lower than expected in bear markets. As a matter of fact I think that 1k USD per ETH is a realistic probability while prices are around 1,8k USD per Ethereum. That being said, I don't think we will face a full blown correction lower than that. Overall I think we all will get a fantastic buying oppurtunity when we reach these prices.
In the larger timeframe we will go one more wave higher to complete the structure and eventualy break the previous top of around 4.7k USD per Ethereum. My target is around 10k per Ethereum on the larger timeframe. If we reach these prices it will probably be a gigantic 12 1 elliot wave count. The correction after that will be sudden, horrible and fast. Possible targets are around 0,3k USD per Ethereum.... Stay safe and trade carefully.
The chart speaks for itself, I base my idea on the previous trend lines combined with fibonacci and elliot wave count.
As always this is no financial advise.


ETHUSD: Dont Buy Just Sell#ETHUSD Analysis
Crystal Clear Sell, Dont Buy For Your Money Sake, + Dont Forget To Match With Your Strategy.
Like + Comments Will Be A Big Support.
Disclaimer:
Buying OR Selling is your own decesion. This is just my personal view of the market for educational purposes.

ETHUSD Chart H4Here is my view for ETHUSD on H4. The price could go down, you can put a pending order on the Order block or find an entry on LTF within OB Zone. Trade Safe!

Ethereum Idea H4This is my view for ETHUSD on H4. The price could go down, you can put a pending order on the Order block or find an entry on LTF within OB Zone. Trade Safe!

ETH Short-Term Scalp off Strong SupportHere's a short-term scalp opportunity I'm taking on ETH. This is a terrible looking chart, but ETH is down over 50% since its April high without a single bounce. It's hitting a pretty strong support area around $1800. I think we have at least a short-term rally before the Fed's announce in June which will likely be to raise rates again. This will probably lead to further selling off of all the markets, which is why this is a short-term scalp.
However, if this occurs, I think it will be an unbelievable opportunity to scoop up so very cheap ETH before the Merge upgrade in August. Let's not forget that ETH is one of the only deflationary cryptos out there. It has burned 2.3mil ETH (or $4.2bil) since the EIP-1559 launch last August! Looking at the Fib retracement, it may be wishful thinking to hit $2400 but I'm aiming for the .382 level before the announcement. At least this is my game plan.
