Where will Ethereum stop? Nov 15Ethereum has a long-term resistance and I expect a correction when the price reaches it next time (5000 - 5200)
Also there is a divergence on daily chart
You can see my whole idea about ETH path on chart
Ethusdshort

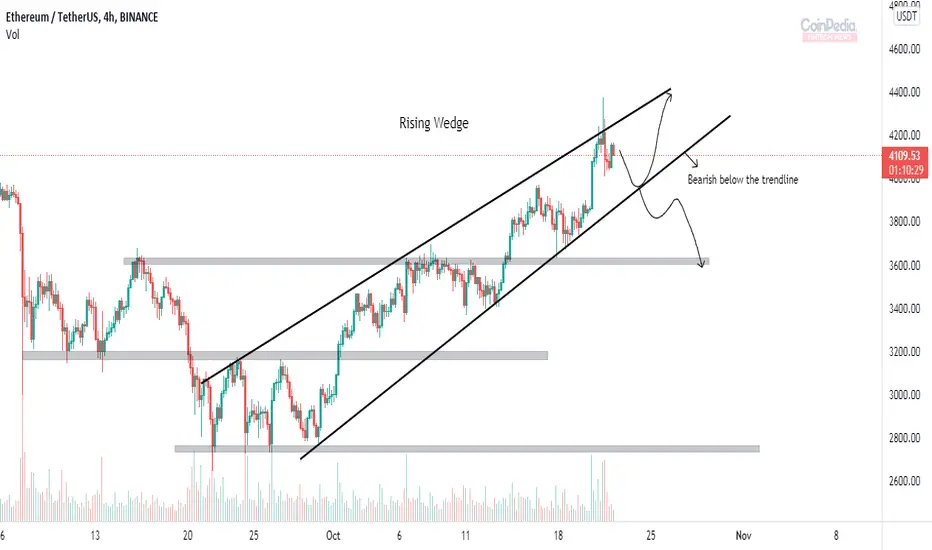
ETHUSD - SELL strategyETHUSD seems destined to correct downwards, is my personal view.
we are near the channel top and line-break shows we may be starting a downward trend within the channel. the objective is now somewhat $ 3,600.00
I suggest stop-loss to be more higher above $ 5,250 in case we have brief spill-over.

ETH/USD Upcoming MoveThis head and shoulders is about to play out and we're going to go down and re-test the breakout of the macro triangle. I can tell because of the bearish divergence on the 4 hour on Market Cipher B - bearish head and shoulders always have this kind of divergence between the left shoulder and head. Here are the places that we will bounce on the way down

EURUSD Wait For The Trigger 🔥🔥Hello Traders , Welcome to this analysis, we are looking at the ETHUSD, the 30M timeframe.
My trading strategy is based on the simplicity .
Please don't forget to FOLLOW , LIKE and COMMENT .
If you like my analysis.
Thank you and Good Luck!

ethusdt 30 min scale bearishwe can expect to blockage the price by the line above and star the very short term downtrend till the signs.... but if the price can be stabled below the 4k for days. downtrend can be boosted

Ethusd retrace before going bullish again ?This is just a thought but i think eth will make a double top then break trend line then become short. only will trade the break of trend or wait for confirmation. Hope you guys enjoy this wild thought.

ETH next movesseems that ETH moves are closely calculates to complete Wyckoff's cycle and also MACD indicator in different time frames shows thea next moves eill be somethink like that


ETHUSD - Ethereum is going down!My TA on 1D shows that:
1. Price came out from the ascending wedge at its peak.
2. Vertical volume decreased while price went up.
3. RSI shows divergence against price.
4. MACD confirms RSI's divergence.
5. Based on horizontal volumes liquidity for MM is concentrated on given level on the chart.
Correction for the last impulse is logical. Correction can fly down Fib starting from 38.2% to 50% and 61.8%. That would be your TP.
It is common for ETH to lag behind BTC, but in the end it follows BTC's trend. There is more fundamental analysis on Bitcoin in my article linked below.

Rising wedge and bearish divergence.Non technical indicators that might support this idea;
- ETH gas prices continues to be unreasonably high and ETH 2.0 won't be rolled out until 2022
- Shiba Inu might be a sign of the market overheating (We all remember what happened the last time a memecoin entered the top 10...right?)

ETHUSDT , Its moving exactly toward the target :D :D :D :DHello every body
Did you take in position guys ?
The price exactly move from the buy zone area and its ready to reach to the 1st Tp
Be with us and enjoy your profit
Good Luck
Abtin

ETHUSDT , We are in buy zone ...Hello guys
According to our previous analysis , the market moved exactly to our way
At this time from the past we are in upward channel and we are near the base trendline and we need to take signal and watch carefully to take signal and take position and buy
Maybe it can break the base of trendline like BTCUSDT chart that we published but its not have high chance for it
Previous analysis :
Dont forget use stop loss and attention to money management
Be with us and sleep comfortably
Good Luck
Abtin

Rising wedge pattern in Ethereum* Ethereum in 4H time frame appears with Rising Wedge pattern.
* Rising wedge occurs when the price moves between two trendlines forming higher-highs and higher-lows. The lower trendline works as support for the price and the upper trendline works as resistance.
* Rising wedge appears with wide bottom and as the price moves higher the range becomes narrow.
* Ethereum can test the lower trendline ( support ) and bounce back, but if it break the support we can expect a drop till below support zone.
ETH/USD (Test All-Time High?)💎Technical Analysis Summary💎
ETH/USD
-After holding 3.6k dollar key support last week, finally able to break its swing recent top
-ETH is now trading again above 4k dollars and it's ready to consolidate near the ATH level
-Today, also, Bitcoin broke into a new price at reaches as high as 66k dollars
-For Ethereum, if it can hold its immediate support region
-The chances to test its all-time high price increases in the coming days
-And once the BTC Dominance value decreases, expect all altcoins will move up crazy
-Ethereum is likely to bring new levels if the market conditions turn good
-Good luck everyone and always manages your risk and please do not get FOMO today
⚠️Please always read the description⚠️
Thanks for donating 💰 via Tradingview coins ozzyman2 🙏🎉
``````````````````````````````````````````````
If you need help🙋 don't hesitate to
Send me a message here PolarHusk 😊
``````````````````````````````````````````````
Trading Involves High Risk ⚠️
Not Financial Advice 💸
Exercise Proper Risk Management 💱
``````````````````````````````````````````````

ETH Rising WedgeETH has made a rising wedge on the daily time frame with a technical target of around 2800.

ETHUSDT , Its moving as same as ...Hello everybody
I hope everyone is in profit
In here we have a upward channel like BTC that we published it and exactly happend and we expect that ETH is moving like BTC movement
Until the price is in this channel we expect the market is rising the price and moving toward the TP
You can buy in here or you can check again the area for taking signal then take in position
Bitcoin analysis :
Dont forget stop loss
Be with us and sleep comfortably
Good Luck
Abtin

ETHUSD- CRYPTO- 10/19/2021ETHUSD has formed a head and shoulders pattern at the resistance zone and is now selling towards support zone price 2894.83.

ETHUSD - swing short planETHUSD reached and was rejected from the previous ATH.
Also there is a rising wedge pattern. The price was rejected from both resistance line and the previous ATH.
There is a possibility for swing short.

ETH scalpingTF - 15 min
SL - after keeping price above 4050.
Try to use price moving on the weekend without CME . As always price retun to close point of CME .

ETH/BTC SOMETHING NEW eth/btc chart showing some bullishness ,the ratio is coming to the support area , from then eth will outperform btc .
be alert by the volume in this case ,coz if this pump is real eth will follow btc by outperforming it..

ETH Sell the top.Ethereum - Intraday - We look to Sell at 3619 (stop at 3702)
Pivot resistance is at 3677.
Bearish divergence can be seen on the 4 hour chart, daily chart (the chart makes a higher high while the oscillator makes a lower high), often a signal of exhausted bullish momentum, or at least a correction lower.
Price action looks to be forming a top. W
e look for a temporary move higher.
Preferred trade is to sell into rallies.
50 4hour EMA is at 3350.
The trend of higher lows is located at 3350.
Our profit targets will be 3366 and 3306
Resistance: 3600 / 3680 / 3800
Support: 3500 / 3400 / 3350

ETH Sell a break setup.Ethereum - Intraday - We look to Sell at 3338 (stop at 3421)
Although the bulls are in control, the stalling positive momentum indicates a possible turnaround is possible.
3680 continues to hold back the bulls.
Trend line support is located at 3400.
A break of bespoke support at 3400, and the move lower is already underway.
Our profit targets will be 3103 and 3033
Resistance: 3500 / 3600 / 3680
Support: 3400 / 3300 / 3200

WEEKLY TECHNICAL ANALYSE : CRYPTO : ETHUSDTThis Is My Opinion About These CRYPTOCurrencies.You Should CHeck it Out YourSelf
Check H1 Time Frame for A signal (Find A Small Trend)
The Area is SHown ON the chart GL :>
