Another dump for ETHUSD or straight up from here? Crypto has been mega bullish lately and the king of altcoins holds its price as other L1 and L2 competitors find astronomical gains in this bull market. From a technical perspective ETHUSD may need another push down to wipe out overzealous longs before it is able to push up to test the all time highs.
BULL CASE
If the bulls find conviction, we think the 4500 levels will be tested and blown through before downward correction to retest it.
BEAR CASE
It might not be economically optimal for market makers to push price up from here. After all their job is not to make everyone rich. We think a correction down to 2920 may be in the plays to liquidate traders before price can find conviction to the upside.
Ethusdshort

ETHUSDT 1D (Update)Well, as we can see, the price is now in our first scenario and is moving forward, of course, the previous analysis is still valid and all the scenarios must be considered.

ETHUSDT 1D (Update):What do you think?Well, as we can see on the chart, the price has lost the upward trend support, it has already reacted to the first MPL support, if this support Breaks , we can expect it to fall to the range of $ 2900 . in case of Losing this support and completing the Double Top pattern, we can expect a further drop to the $ 2300 to $ 2400 range. The second scenario is for the price to rise, provided that the support price maintains $ 3100 and can record a Higher High above $ 3400 .

ETHUSD IdeaG'day Guys
Today we gonna analyse No 2 Crypto that currently receive a huge market transaction every day.
Based on an analysis of technical and fundamental current market conditions, I am seeing this pair entering the consolidation phase. I predicted ETH retracing entering on 50% Fibo levels around 2600 / ETH. From here we clearly gonna see the market structure completed before continuing the uptrend rally.
This movement might be happening within Sept & October depending on the new release from ETH founder that possible pushing this pair as high as 5000 / ETH. What we gonna do here is, shorting this pair with minimum Stop Loss with 1:5 risk and reward.
Always trade with risk management, I believe everyone knows Crypto world market movement has huge different with others instrument. High volatility market is High risk with Huge Return. Low Risk Low Return.
Let's see what happens next.. Cheers

ETH shortBINANCE:ETHUSDT
As we said yesterday, after the defeat of the downtrend, we can enter the downtrend, and while the downturn continues, it is better to stay in the position.

ETH LONGBINANCE:ETHUSDT
We have now reached the canal roof
, so it is better to stick to the trigger,
and the important part is that if the canal
roof can be broken, we can go to the indicated range.

ETHUSD Opportunities Read DescriptionIf you follow my previous analysis that I did for ETH a couple weeks ago I explained and marked the area in where there was going to be the possibility for a reversal because of profit taking. I closed my longs positions around that area after I saw that price was starting to create a distribution schematic. Now, with that being said, it never provided a reason to go short until a couple days ago when the daily trendline was broken. It was the only cryptocurrency that broke the long term trendline as many of the others remain in a bullish state. I waited for a retracement and failure to go above the 61.8% of the fibonacci on the smaller timeframe (1HR) and opened short positions, one already took profits and the other at break even and let it run for continuation.
Now, where could the next opportunities be taken? Well, if price manages to break the B point marked on the chart which in my opinion will do, we will have to wait until it reaches one of the two important key zones marked on the chart as not only they are key fibonacci levels, but are also the ones that have the most structure/ confluence with structure. It is important to understand that even though I opened shorts positions, price structure remains bullish and this will be just a pullback of the higher timeframes. However, if price manages to break the levels marked in the chart then the long term bull run will be invalidated. I do still believe that price will continue higher after reaching the first area marked on the chart, but it is highly important for us to be patient and wait for price to reject the area and create a support in such area before taking a long position. Stay safe, good luck, good trading!

Open Shorts (Maro Bhatay)Bearish patterns forming on ETHUSDT
Tweezer top formed on 4HR
Tweezer top forming on the weekly chart
Double top formed on 1HR Chart
Bearish Divergence on 1 Hr
All over extremely bearish
Open Shorts from 3298 till 3220
stop-loss 3338
Target area 2714-2521 Long Term 2328-2053

ETH BEARISH RETESTIn my opinion eth will do bearish retest, after that drop price to about 2,9k for 1 eth, something like that, not sure 100%, if it reaches 3.2k, it is worth taking a look at the indices

Bearish flag in Ethereum* Ethereum in 30min time frame forms bearish flag pattern, which is trend continuation pattern.
* It occurs during bearish trend when the price consolidates within two parallel trend-lines before it continue it's fall.
* If the price breaks the lower trend-line we can see a drop till $2950.

Red Dot on the 2 DayFirst one this uptrend. This is looking more and more like a relief rally that is coming to an end . VWOP weakening and cash flow hasn't even come close to reaching previous levels from ATH


Relief Rally Over. Top is InRight where I put the vertical line go zoom in on the 1 hour and then the 1 minute. We're starting to print mirror image patterns. The trend is about to flip. Also it just so happens that we are right at the golden pocket from ATH to the bottom of our consolidation zone. You can see the bearish H & S pattern that is flipping the trend and how it's rounding out the top. Go short something and hold it all week. Thank me later.
Oh also how could I forget to mention the massive bearish divergence on the 4 hour that we've had all week

ETHEREUM M FORMATION Ethereum is about to complete it's big M formation move,so sellers will be more in the market for a few days or more.
Let's see how the analysis go in the cryptocurrencies market!

Ethereum- Pin Bars before correctionAlso Ethereum looks tired and a correction could be just around the corner
A Doji candle 2 days ago is followed by a Pin Bar yesterday and this give me reasons to expect a drop soon.
Above 3200 sellers seem strong and short term sellers could have at least 2800 as a target
A daily close above 3250 would negate this scenario

ETHUSDT :probability of a Strong growth ...In this area where the price is located, a very good opportunity has been created for the buying position, the stop loss and capital management should be observed .

ETH updateI decided to update you also on ETH the king of the alts. Eth seems a little more prime then BTC to start moving up. As you can see is now trading in an ascending channel, this is also a bearish formation, however bullish till the lower support is broken. I believe eth will move its way up to 3500, there it will be interesting to see if it will form a whipsaw and push to the 3800 level before to retrace back down to 2800 and possibly 2400. To appreciate the flag ETH formed in the RSI, if the momentum will break upward then we should have a nice acceleration up, the opposite is also true.
follow me, share and comment.
feel free to ask me question.

ETH Daily Analysis - Bearish IndicationHey,
As you can see, there is a bearish indication on the Daily Chart Logistic Indicator after 22 days straight green dots in the indicator.
It might be a worth a try to do a short once 15m or 30m RSI is at the top or overbought.

ATH condition: first correction and then pumpHello dear friends
As you can see in the diagram, the ATH is ready for a correction after the recent ascent
ATH correction can be Fibonacci 0.618 = $2300
That is up to MA200 per day = $2300
That brings the price correction to around $2,300
After this correction, we see the formation of a continuous and incremental triangle
Now, with this correction, ATH will make its point D in the ascending triangle and will start moving towards the upper side of the triangle, and after breaking the upper side of the triangle, it will continue its movement according to the triangle pattern up to $6,800.
Dear friends, this is not a trading recommendation
Please make your transactions at your own discretion and opinion
Good luck

ETHUSDT : Powerfull Breaking ...We see that the price has been able to break its static resistance. After a pullback, we can expect growth to the level of $ 4,000.
ready to go long ?

Ethereum could correct to 2600As I said before, 3200 should provide strong resistance for EthUsd.
At this moment the coin looks like is carving a small double top with the neck-line around 2900
A break here would expose 2600 important support

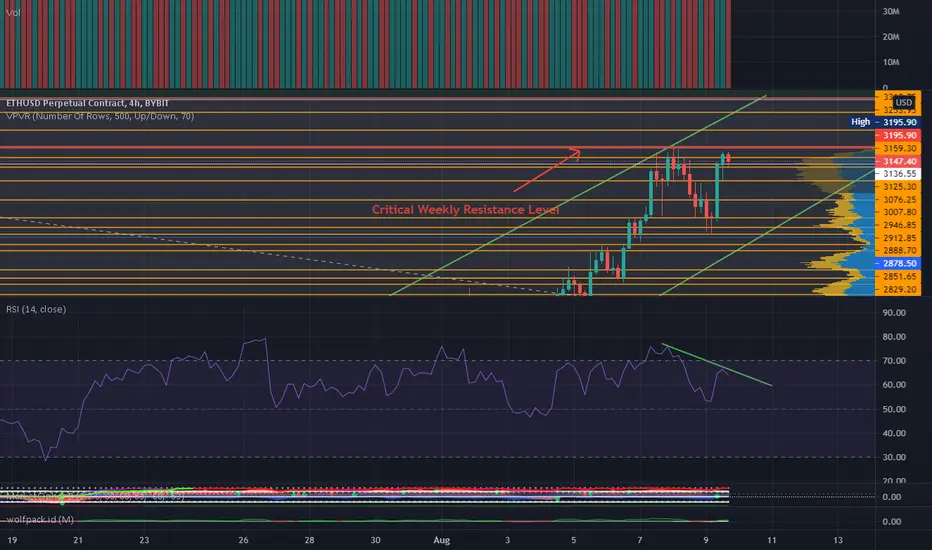
ETH Double Top/Bearish DivLooks like ETH is creating a double top/M pattern off of this big weekly resistance level. If we don't break through it the bearish divergence on the 4 hour will confirm and we are most likely topping out
Etherum More likely to fall in the short term 2H TFConsidering the fall we saw in Kendall before, we can expect more fall after pullback. what do you think ? Leave your comment for us .
