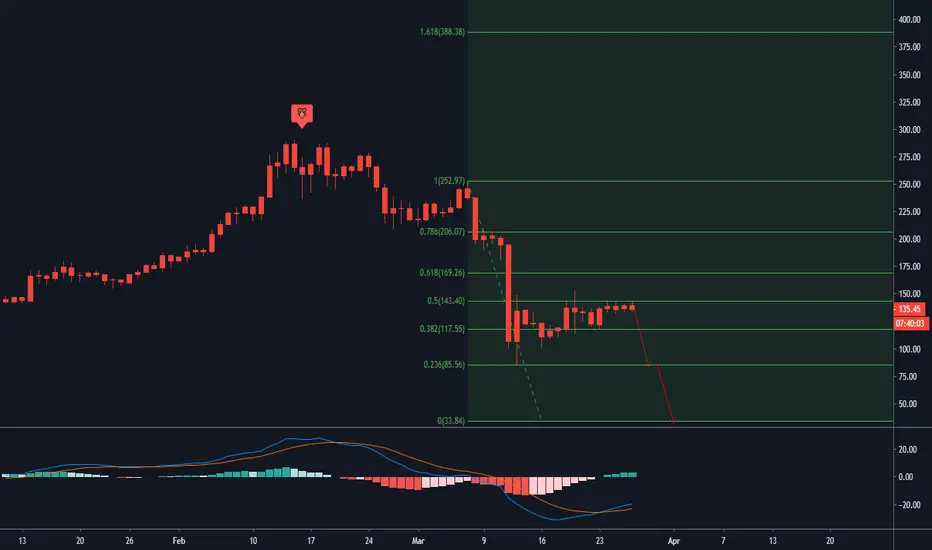
#ETHUSD ANALYSIS.. DUMP INCOMING.. Bears will dominate the whole market for a while, but I firmly believe that these are the last zig-zags before a new market cycle..
We see wedge pattern on #ETHUSD weekly chart and I think, as I mentioned in the graphic, we will find the bottom we have been looking for for a long time.. I think the reference value of rsi 50 is very important, in this context, we can see a fractal as the leading indicator that sales will get harder soon, we will wait and see.. Also, the value of 0.95 for vortex has worked quite meaningfully from the past to the present, as it can be seen in the weekly chart of Ethereum , the value in question produces important clues for us and should be watched carefully in the future..
All these arguments point to a negative process in the medium term, my personal opinion is that Ethereum will drop up to $ 47 and gives a serious buying opportinuty before a new market cycle..
Sometimes you need to break your knees a bit more to jump higher..
Disclaimer: I am not a financial advisor.. Please do your own due diligence when it comes to crypto-investing.. Never put in money that you cannot afford to lose.. Invest at your own risk..
I wish you all the best..
Ethusdshort

ETH/USDETH/USD has reached its resistance line and will fall to the bottom of the specified arrow. I hope you enjoy this analysis.
And this is the best time to enter the deal.
HAVE A GOOD DAY.

ETH analysis on hourly chart [Long or Short]ETH is now on a resistance level (176-180) and sellers are trying to sell at this level. We can wait for some solid rejection and get onto short position with stop at high and targets for the short will be around 150$(strong demand zone), our support.
For bitmex signals, join our telegram channel t.me/bitmexmasters

Ethereum USD - correction of the ascending channel is possibleThe price goes within the rising channel.
And also a trend formed, where he indicated a trend line.
At the moment, the price is a bit overheated.
Resistance
185-187
Local support.
176.5-174

ETHUSD - Short IdeaGreetings friends,
Ethereum broke above daily resistance and closed back below, indicating a deviation to the upside might be formed and a top for Ethereum is in. It is currently retesting previous support 176, confluence with H4 bearish EMA cross, and RSI below the mid line.
Invalidation if price reclaims resistance 176.
Comment below and let me know what you think.
If you find my analysis useful, like and subscribe are greatly appreciated.
Disclaimer: I am not a financial advisor and you should always do your own research before engaging any trade.

ETH/USD (Retest recent High at 190 dollars?)ETH/USD
-found support at ascending trendline of support
-holding 20ma as immediate dynamic support
-bullish cross of 50ma & 100ma
-if 3rd candle close bullish green, we could expect another move up
-the initial target is the recent high at 190 dollars
-strong sell area is at 210 dollars
-our stoploss should be below 165 dollars

#ETHUSD.. DOMINATION OF BEARS WILL END SOON BUT FIRST... Bears will dominate the whole market for a while, but I firmly believe that these are the last zig-zags before a new market cycle..
We see wedge pattern on #ETHUSD weekly chart and I think, as I mentioned in the graphic, we will find the bottom we have been looking for for a long time.. I think the reference value of rsi 50 is very important, in this context, we can see a fractal as the leading indicator that sales will get harder soon, we will wait and see.. Also, the value of 0.95 for vortex has worked quite meaningfully from the past to the present, as it can be seen in the weekly chart of Ethereum, the value in question produces important clues for us and should be watched carefully in the future..
All these arguments point to a negative process in the medium term, my personal opinion is that Ethereum will drop up to $ 47 and gives a serious buying opportinuty before a new market cycle..
Sometimes you need to break your knees a bit more to jump higher..
Disclaimer: I am not a financial advisor.. Please do your own due diligence when it comes to crypto-investing.. Never put in money that you cannot afford to lose.. Invest at your own risk..
I wish you all the best..

ETHUSD Trading Plan For the Week Good Morning guys.. ETHUSD is trading in an ascending channel and for three consecutive time after touching the upper channel it bounces back to the lower channel , keep an eye on the channel , if price does not break out , look for opportunity to sell and put a stop above the upper channel . Good Luck .

ETH / USD Short Opportunity. ETH / USD Short opportunity, based upon expected rejection of the 99MA Level, after closing at the level and wicking above. FIB Retracement Level 3% above entry level also acts as another form of resistance and this is where my Stop Loss is placed. On the 4H and 1H the price is showing rejection and consolidating, struggling to break the MA level. RSI is also approaching overbought.

ETHUSD short with good risk/rewardIf we get a close below 174.4, I'm looking forward to watching the satts roll into my account!

Can ETH Maintain Momentum?Hello traders! Good morning on the East Coast of the USA. Hope you all are staying safe on the charts and out in public! Earlier this morning ETHUSD decided to take off and break through trendline resistance (see below). I have to be honest, the significance of this is very small.
The real question is if ETHUSD can maintain this momentum. If it can there is hope for a lot more gains. On a separate post on BTC, I mentioned how double top and head and shoulders at times play out (check it when you have a chance). The short of it is when I see an asset/commodity quickly selling off after its been on a lengthy trend and subsequently creates a base for a short period of time, my immediate though is Top Reversal Patter .
Let's take a look at a momentum indicator.
Above, momentum is analyzed using the Squeeze Momentum indicator which is a great tool for capturing divergences and highly suggest looking into it. With ETH potentially putting in a new high close, there is a possibility a bearish divergence might signal the slowing of the trend. I'd like to note that RSI and MACD are not posting divergence on lower time frames. This is typically the case on strong and quick moves.
Furthermore, price action is tying into a lot of what I am seeing with equity markets. Each are nearing the top of a short term trend. I'll be looking for short entries and will 100% not rush into them. Stay safe and like and follow if you enjoyed this content.

ETH/USD (Bullish pattern still in play?)ETH/USD
-ETH bounced at 100MA on 4H chart
-key support today is 148 dollars
-ETH is trading inside this bullish channel
-if the pattern broke to the upside, the target is 173 dollars
-a break below 148 dollars will invalid this scenario


ETH/USD (2nd bounce at key support?)ETH/USD
-potential 2nd bounce at key support
-upward trendline support remains intact
-upside priority still valid
-if key trendline support is broken, this trade will invalidate
-upside target is up to 190 dollars
-stoploss below 151 dollars

ETHEREUM / U.S. DOLLAR (ETHUSD) DailyDates in the future with the greatest probability for a price high or price low.
The Djinn Predictive Indicators are simple mathematical equations. Once an equation is given to Siri the algorithm provides the future price swing date. Djinn Indicators work on all charts, for any asset category and in all time frames. Occasionally a Djinn Predictive Indicator will miss its prediction date by one candlestick. If multiple Djinn prediction dates are missed and are plowed through by same color Henikin Ashi candles the asset is being "reset". The "reset" is complete when Henikin Ashi candles are back in sync with Djinn price high or low prediction dates.
One way the Djinn Indicator is used to enter and exit trades:
For best results trade in the direction of the trend.
The Linear Regression channel is used to determine trend direction. The Linear Regression is set at 2 -2 30.
When a green Henikin Ashi candle intersects with the linear regression upper deviation line (green line) and both indicators intersect with a Djinn prediction date a sell is triggered.
When a red Henikin Ashi candle intersects with the linear regression lower deviation line (red line) and both indicators intersect with a Djinn prediction date a buy is triggered.
This trading strategy works on daily, weekly and Monthly Djinn Predictive charts.
This is not trading advice. Trade at your own risk.


ETHEREUM / U.S. DOLLAR (ETHUSD) WeeklyDates in the future with the greatest probability for a price high or price low.
The Djinn Predictive Indicators are simple mathematical equations. Once an equation is given to Siri the algorithm provides the future price swing date. Djinn Indicators work on all charts, for any asset category and in all time frames. Occasionally a Djinn Predictive Indicator will miss its prediction date by one candlestick. If multiple Djinn prediction dates are missed and are plowed through by same color Henikin Ashi candles the asset is being "reset". The "reset" is complete when Henikin Ashi candles are back in sync with Djinn price high or low prediction dates.
One way the Djinn Indicator is used to enter and exit trades:
For best results trade in the direction of the trend.
The Linear Regression channel is used to determine trend direction. The Linear Regression is set at 2 -2 30.
When a green Henikin Ashi candle intersects with the linear regression upper deviation line (green line) and both indicators intersect with a Djinn prediction date a sell is triggered.
When a red Henikin Ashi candle intersects with the linear regression lower deviation line (red line) and both indicators intersect with a Djinn prediction date a buy is triggered.
This trading strategy works on daily, weekly and Monthly Djinn Predictive charts.
This is not trading advice. Trade at your own risk.

ETHEREUM / U.S. DOLLAR (ETHUSD) MonthlyDates in the future with the greatest probability for a price high or price low.
The Djinn Predictive Indicators are simple mathematical equations. Once an equation is given to Siri the algorithm provides the future price swing date. Djinn Indicators work on all charts, for any asset category and in all time frames. Occasionally a Djinn Predictive Indicator will miss its prediction date by one candlestick. If multiple Djinn prediction dates are missed and are plowed through by same color Henikin Ashi candles the asset is being "reset". The "reset" is complete when Henikin Ashi candles are back in sync with Djinn price high or low prediction dates.
One way the Djinn Indicator is used to enter and exit trades:
For best results trade in the direction of the trend.
The Linear Regression channel is used to determine trend direction. The Linear Regression is set at 2 -2 30.
When a green Henikin Ashi candle intersects with the linear regression upper deviation line (green line) and both indicators intersect with a Djinn prediction date a sell is triggered.
When a red Henikin Ashi candle intersects with the linear regression lower deviation line (red line) and both indicators intersect with a Djinn prediction date a buy is triggered.
This trading strategy works on daily, weekly and Monthly Djinn Predictive charts.
This is not trading advice. Trade at your own risk.


ETHUSDT - analytics of corrective price growth!Good day to all crypto fans! Let's analyze where we expect the price of ETH in the near future?
Locally, the ETH price completes the corrective movement in the fourth wave, followed by the local fifth wave. Levels are marked on the chart. After which, most likely there will be a slight correction to the level of 142.42 and subsequent growth.
Price moves in an upward channel in its lower part. It is indicated on the chart. Punching and fixing above the level of 150.45, the price will go to the level of 169.30 or the middle border of the channel.
According to the indicators on the hourly timeframes, the local corrective movement may continue. The fourth wave is often heavy and unpredictable. On the daily timeframe, the upward movement is not yet complete. Therefore, upward movement to the levels marked on the chart remains a priority.
Cancellation of the upward movement is a breakdown and consolidation below the lower boundary of the channel or level 139.20.
Thanks to all my subscribers and readers for your attention! 🙏Your likes and comments motivate me to give you more accurate information and analytics.
Success and profit!🤑
Don’t leave without like and comment, and if you liked my analytics sign up and you definitely won’t miss anything!
Disclaimer!
I do not give entry and exit points.
I share with you my opinion and ideas, which may differ from yours.

Weekly chart shows ETH bottom formationIn the weekly chart, the formation of a bottom is evident. ETH bullish target maybe at 200 for the short term

Just imagine......The world is on its arse... markets are trashed.
Why would crypto stay in the green?
These lower levels are not out of the question.