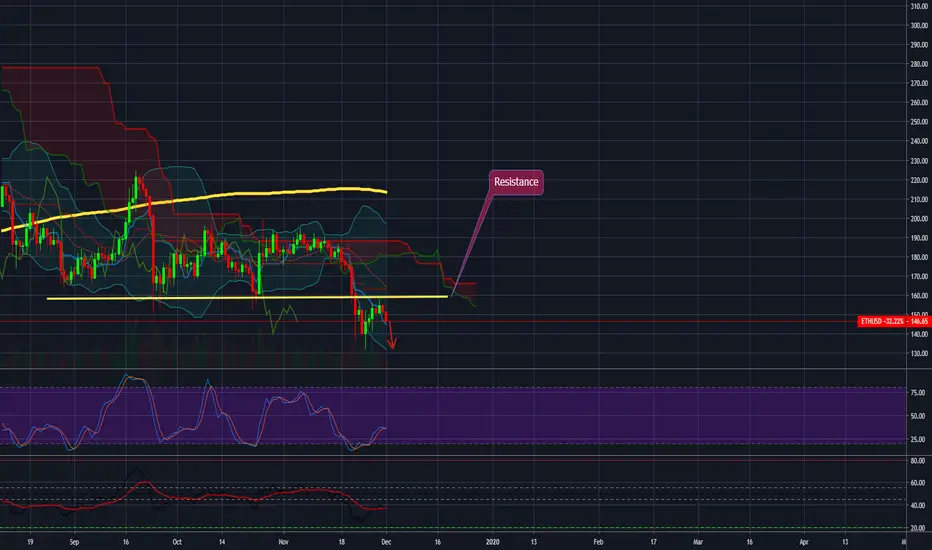
ETHUSD potential reversal!
ETHUSD expected to rise up to 1st resistance at 149.88 where it could potentially react off and drop down to 1st support at 134.42.
*Disclaimer.*
Trading leveraged products carries a high level of risk and may result in you losing substantially more than your initial investment. Pepperstone Group Limited is licensed and regulated by the Australian Securities and Investments Commission (AFSL 414530). Pepperstone Limited is authorised and regulated by the United Kingdom Financial Conduct Authority (FRN 684312). This information is not intended for distribution to, or use by, any person in any country or jurisdiction where such distribution or use would be contrary to local law or regulation.
Ethusdshort

ETHUSD potential reversal!
ETHUSD expected to rise up to 1st resistance at 151.50 where it could potentially react off and drop down to 1st support at 135.00.
Trading CFDs on margin carries high risk.
Losses can exceed the initial investment so please ensure you fully
understand the risks.

ETH/USD TA Update (More Upside Challenge?)ETH/USD
ETH broke the inside trend-line resistance around 135 levels and has the potential to retest the much bigger resistance line at 150 regions.
We can see buying volume in the past days and ETH finally started moving upward with the help of BTC moving up too.
EMA cross is likely to happen within the next day to give a signal of an immediate shift in short term momentum.
ETH is about to explode with a few weeks in time.

ETH/BTC TA Update (Bounce at 0.786 Fib?)ETH/BTC
ETH found support at 0.786 Fib level and trading history from Aug to Sep activity. We saw a 7% pump from bottom today,
I would expect ETH to pump 1 more to retest the downward trend-line of resistance before pulling back and potentially form a new Higher Low.
Bearish side if ETH sharply drops to 17300 sats and closes below it with engulfing candle. I'm short term bullish until a retest of immediate resistance.

ETH/USD TA Update (4hr Pullback?)ETH/USD
ETH faced rejection from the key resistance at 138 - 140 area. The price has a pullback to key support between 130 regions. This pullback maybe not be over yet,
We could still 1 more leg down to 127 area. Before attempting to retest again the downward trend-line of resistance coming from peak 157 - 151 levels.
ETH reached an overbought RSI giving extra pressure for a pullback to occur during its recent pump.
I'll be waiting for ETH to consolidate longer between 130 regions before entering a Long position to avoid premature entry.

ETHUSD reversed from resistance, potential drop!
ETHUSD reversed off its resistance at 141.75 where it could potentially drop further to 122.85.
Trading CFDs on margin carries high risk.
Losses can exceed the initial investment so please ensure you fully
understand the risks.

ETHUSD / SHORT / 2% RISKat resistance in upward channel.
We are looking for a nice short.
2% risk 6% gain.
Hasta la vista!

ETH 2019 Bull and Bear Market - Under 100 or Bottom?
Where will we finish this year?
Will we start a new uptrend on the 7th of January?
Or will we see new lows under 100 USD?
Every Retracement was followed by a dump after the golden pocket was lost.
Trendlines showing possible End of December Dates and 7th of January of new tests of the current golden pocket.
Will it hold and we have the power to come out of the falling wedge and breakthrough all resistances or will we find a low under 100 USD?


ETH/USD TA Update (Bulls Defended Trend-line Support?)ETH/USD
ETH is following the downward trend-line support as the price perfectly bounce right from it again.
Though $120 is a whole number of physiological support also Jan - Feb 2019 trading activity within this price level.
If the price will retest the resistance between $137 - $140 and pullback to $126 area to confirm new support,
I would expect a potential early sign of bulls buying. The market trend-line cycle will probably take 30 days,
expect more sideways action during this period.

ETH hits first target area, more downside to $85! ETH just hit our first target area after nearly 20 days falling from the $156 retrace area down to $122 and then some. From here if we follow market structure price can retrace into the $138-140 area before breaking through $122 and into our target area of $85. Price could theoretically move up to the $150 level where the impulse started but that is unlikely if the market structure trend should continue.
Right at support at $122 some strong buy volume came out which is a little concerning but overall the downtrend looks to hold well.

The Ethereum Market is Still in a DowntrendThe Ethereum recovered to the area above $134.00 during early Asian hours, however, the growth proved looks to be unsustainable.
Short-term momentum and trend have a bearish bias, besides the hunt for a probable low is not over. If that is the case the first resistance above is the 25th November low of $131.15. A clear break there could send the price for testing H4 50 and 200 SMAs at 137.90 and $151.
The bearish trend coupled with the high volatility suggested that the downward momentum has the potential to continue. ETH/USD is running closer towards a big $100 return, last seen in February, amid the falling wedge pattern on a daily chart. But before that the bears need to breakout 125.25 (Feb. 2019 high) and psychological $120 support firstly.
What do you think about Ethereum?

Ethereum aims to $100Hello, dear Traders!
PrimeXBT is at your service and today we overview ETHUSD (inverted).
I invert the ETH chart to illustrate the bearish scenario.
Price is moving inside the channel and we have the next round target of $100 .
But in case ETH breaks the lower line - we will be able to talk about reversal of the bullish movement.
We set this BTC chart on the left for clarity, what can happen according to this price changes, similarity is observed.
Market Cap
$16 035 694 805 USD
Volume (24h)
$6 678 425 801 USD
Circulating Supply
108 865 785 ETH
Share your thoughts, ideas about the market under the chart.
Watch for our Updates to be the first who gets well-timed signals!
GOOD LUCK AND LOTS OF PROFITS !!

ETHUSD approaching support, potential for a bounce!
ETHUSD is expected to drop to 1st support at 138.80 where it could potentially react off and up to 1st resistance at 158.50.
Trading CFDs on margin carries high risk.
Losses can exceed the initial investment so please ensure you fully
understand the risks.

Simple Adam & Adam double bottomShort term bullish reversal has already begun, testing out and identifying new patterns in chart. Overall still bearish.

ETHUSD Pyramidit looks like a pyramid doesn't it? stuck in a downtrend, shorting to ~130 - 135 is the best option. Looking for a reversal so I can make some new charts..


ETHEREUM MUST WATCH(RETEST)Hi traders its JK here again, and today we will be looking at ETHUSD. Pending the undecided move in the market price lately, majority of the crypto price are relatively showing a sign of retesting the previous low(support level)
Clearly shown above is a classical chart pattern called the THE DESCENDING TRIANGLE CHART PATTERN. What is the real fact behind this pattern?
Traders need to know that the real fact behind this pattern is the horizontal boundaries(support).
This pattern is considered to be a bearish continuation chart pattern looking at its current position now.
Now the question is, how do traders take advantage of this pattern?
First of all they need to wait for the pattern to be valid before thinking of opening a position. This pattern becomes valid only when price close below the horizontal boundaries. Looking at the move to retest a low of $138 down to $130.
Hey guy, let me see what you think and have to share in the comment below and also dont forget to like and follow.
You can also join me on twitter :
twitter.com
On youtube for more educational content and signals:
www.youtube.com
PM me on telegram:
@JOHN8KELVIN

ETHUSD May drop lower before risingretest of fib level 0 is target, linear regression shows a clear downtrend, major support at ~140 which will most likely hold if this drop occurs, even though hardfork.

#ETHUSD#Ethereum, Boredom celebratesA downward trend without changes.
As long as ETH USD is below the resistance line at $ 158 we recommend selling.
Ichimoku Indicator indicates continued declines
Target: $ 129

#ETHUSD#Ethereum, The bears will continue to celebrateThere was no breaking the resistance at $ 158 like we thought it might be
The last 2 candles were closed in the shape of a star that they would usually appear at the end of the trend and indeed the candle that followed was red
The Ichimoku cloud continues to be a bear cloud and the candles are still below the cloud and the blue line is still above the red line, all of which indicate continued declines.
The price below the 200 moving average line.
Target: $ 131
Ethereum (ETHUSD) Market Outlook | Daily Crypto Market BreakdownETH and other ALT-coins need bullish momentum or we are heading down south. I personally would like to see how low we can go. This will be an interesting month.

ETH Short down to $85-90! ETHUSD has finally shown a continued move potential in market structure to the downside. We were waiting for the double bottom to break through and price to pullback into the broken low. Price has a pullback and begun to rotate at the new resistance which can bring the price down to the ultimate support at $85-90. The downside break was on good volume, the volume to the upside swing was rather weak. The ultimate target to the downside is $87.00.
Disclaimer: This trade idea is for educational purposes exclusively, this does not constitute investment or trading advice. TRADEPRO Academy is not responsible for any market activity.
