Ethereum Analyze (Short term/Timeframe 15min)!!!⏰It seems that Ethereum can find the end of wave 5 near the important trend line and resistance zone.
I expect Ethereum to lose at least 3% of its value in the next hours.
Ethereum Analyze ( ETHUSDT ) Timeframe 15min⏰
Do not forget to put Stop loss for your positions (For every position you want to open).
Please follow your strategy, this is just my idea, and I will be glad to see your ideas in this post.
Please do not forget the ✅' like '✅ button 🙏😊 & Share it with your friends; thanks, and Trade safe.
Ethusdshort

Ethereum at 61.8% fib?Ethereum
Intraday
We look to Sell at 1608 (stop at 1631)
Our short term bias remains negative. Selling continued from the 61.8% pullback level of 1607.04. There is scope for mild buying at the open but gains should be limited. We look for a temporary move higher. Preferred trade is to sell into rallies. Bearish divergence is expected to cap gains.
Our profit targets will be 1529 and 1501
Resistance: 1610 / 1700 / 1800
Support: 1529 / 1500 / 1450
Disclaimer – Saxo Bank Group. Please be reminded – you alone are responsible for your trading – both gains and losses. There is a very high degree of risk involved in trading. The technical analysis, like any and all indicators, strategies, columns, articles and other features accessible on/though this site (including those from Signal Centre) are for informational purposes only and should not be construed as investment advice by you. Such technical analysis are believed to be obtained from sources believed to be reliable, but not warrant their respective completeness or accuracy, or warrant any results from the use of the information. Your use of the technical analysis, as would also your use of any and all mentioned indicators, strategies, columns, articles and all other features, is entirely at your own risk and it is your sole responsibility to evaluate the accuracy, completeness and usefulness (including suitability) of the information. You should assess the risk of any trade with your financial adviser and make your own independent decision(s) regarding any tradable products which may be the subject matter of the technical analysis or any of the said indicators, strategies, columns, articles and all other features.
Please also be reminded that if despite the above, any of the said technical analysis (or any of the said indicators, strategies, columns, articles and other features accessible on/through this site) is found to be advisory or a recommendation; and not merely informational in nature, the same is in any event provided with the intention of being for general circulation and availability only. As such it is not intended to and does not form part of any offer or recommendation directed at you specifically, or have any regard to the investment objectives, financial situation or needs of yourself or any other specific person. Before committing to a trade or investment therefore, please seek advice from a financial or other professional adviser regarding the suitability of the product for you and (where available) read the relevant product offer/description documents, including the risk disclosures. If you do not wish to seek such financial advice, please still exercise your mind and consider carefully whether the product is suitable for you because you alone remain responsible for your trading – both gains and losses.

Is there a head and shoulders in Ethereum?If the candle closes weakly in the coming days, after the recent rise, the price will enter a downward trend and decrease to the price of 1,100-1,200 dollars.

ETHUSDT SHORTRisk warning, disclaimer: the above is a personal market judgment based on published information and historical chart data on Tradingview, all analysis is only subjective. Hope investors consider, I am not responsible for your investment decision. Thank you.
Good luck!

ETH/USDT :: Definitely a selling position !ETH/USDT :::
downward trend .
In case of breaking the range of 0.6, it is possible to fall to the Red line .

ETHUSD -Ethereum is about to fallHi everyone, the Ethereum chart is a little better than the Bitcoin one, the horizontal support has been broken, for me this is a short entry with target 1250-1300, in case it bounces on the trendline I will think about possibly a long entry.

ETHUSD top-down analysisHello traders, this is the full breakdown of this pair. We will take this trade if all the conditions are satisfied as discussed in the analysis. Smash the like button if you find value in this analysis and drop a comment if you have any questions or let me know which pair to cover in my next analysis.
Press like button if you enjoy this content 😊

Expecting downtrend for Ethereum!Check my recent Ethereum/BTC chart as well guys, Ethereum is really not looking well at all!
I shorted Ethereum already but unfortunately it tumbled a bit too fast and I could not alert you guys about the shorting opportunity.
However, I did post the $ETHBTC bearish analysis before it fell this much!
Follow me for the highest quality signals for FREE! I shorted Ethereum at the top at $2020 too before this local top!
Feel free to ask me about anything you are curious about!


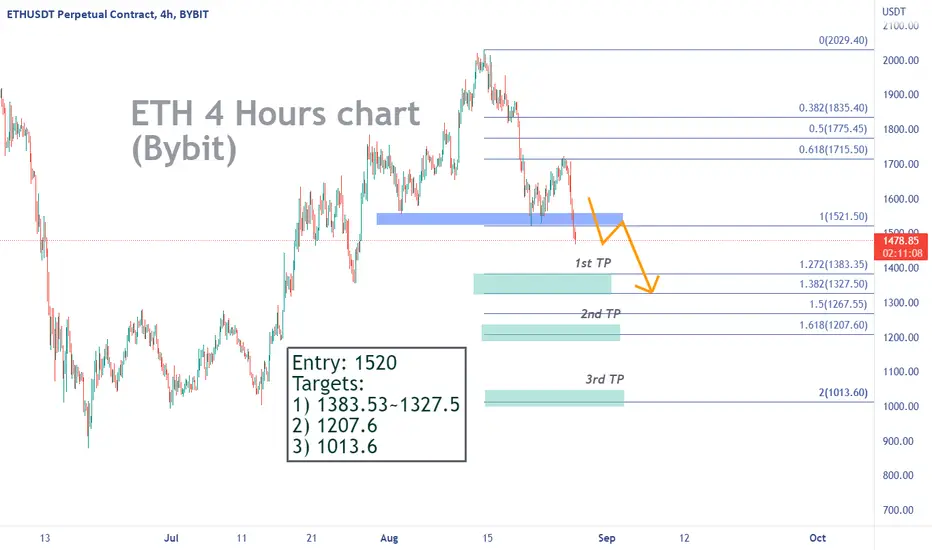
ETH - Selling SignalBYBIT:ETHUSDT
4H time frame
-
Ethereum just broke out the neckline at 1521.6 and formed a Head and Shoulders on 4H.
This is a good entry to open short and aim to support levels as below.
-
Targets:
1) 1383.53~1327.5
2) 1207.6
3) 1013.6
ETH Price Prediction 25/08/2022 ETH Price Prediction 25/08/2022 ETH Price Prediction 25/08/2022 Short ETH Price Prediction

ETH: Sell the breakEthereum
Intraday - We look to Sell a break of 1526 (stop at 1571)
1527 has been pivotal. A break of the recent low at 1527 should result in a further move lower. Daily signals are mildly bearish. Our short term bias remains negative.
Our profit targets will be 1424 and 1394
Resistance: 1700 / 1750 / 1800
Support: 1600 / 1550 / 1500
Please be advised that the information presented on TradingView is provided to Vantage (‘Vantage Global Limited’, ‘we’) by a third-party provider (‘Signal Centre’). Please be reminded that you are solely responsible for the trading decisions on your account. There is a very high degree of risk involved in trading. Any information and/or content is intended entirely for research, educational and informational purposes only and does not constitute investment or consultation advice or investment strategy. The information is not tailored to the investment needs of any specific person and therefore does not involve a consideration of any of the investment objectives, financial situation or needs of any viewer that may receive it. Kindly also note that past performance is not a reliable indicator of future results. Actual results may differ materially from those anticipated in forward-looking or past performance statements. We assume no liability as to the accuracy or completeness of any of the information and/or content provided herein and the Company cannot be held responsible for any omission, mistake nor for any loss or damage including without limitation to any loss of profit which may arise from reliance on any information supplied by Signal Centre.

ETHUSD BOUNCE Eth is closed to a bounce be watchful and cautioned, it might get a bounce at approximately $1500 level and if not we enjoy the smooth ride to the down side

Short opportunity for ETHFirst of all, I should point this out. I am a trader who does not like short trading very much. However, when we consider the continuation of the bear market, there is a serious short opportunity here. The monthly W retest level is $2159. Entry, targets and stop points are on the chart. While all my long transactions are open at the moment, I wanted to share a possible opportunity with you.

Ethereum (ETH) Analysis & Trade IdeaBearish, with lots of momentum.
But there is potential for a bounce at current levels.
I present a bearish scenario, as well as a bullish scenario.

ETH USDT PF #BINANCE 15 M .ETH USDT PF #BINANCE 15 Minutes Analysis With T/P And S/L Follow For More Thank You . #BTC #DOT

ETH To $800?I am currently waiting on this weekly candle to close in 7 hours from the time of this post! If the weekly candle closes in or above my purple zone then more upside moves should happen as this is a key psychological level as you can see it has been used many times before mostly as support with each touch in this zone creating massive bounces to the upside.
On the other hand if the candle closes below this zone as it is currently then i can see massive downside moves to around the $800-$1000 level.
Again patience is key to making and more importantly not losing money in crypto!
DM me if you would want daily analysis, trades & education.

ETHUSDTEth usdt can take hit from mentioned areas for bellow mentioned targets.eth will be bullish after breakout of 2000 level.

2X $ETH BELOW 1K!???$ETH jumped a little above $2k but i think its headed to 750$ within the next few weeks if it doesn't form a double bottom coming out of this pattern!

ETH Chart UpdatesHello, TradingView community and my subscribers, please if you like ideas do not forget to support them with your likes and comment, thank you so much and we will start.
Today I want to share my opinion with you about ETH / USDT

Time to Short Ethereum!Hello everyone, another great short is Ethereum! Lots of bearish signs, plus Bitcoin is very bearish too. ETHBTC is also bearish, so we have three factors showing us that Ethereum will fall!
Keep stop loss at $2025.
Targets:
TP1: $1934
TP2: $1881.46
TP3: $1839.4
TP4: $1797.5

Ethereum USD Prediction H1Here is my view for ETHUSD on H1. The price could go down, you can put a pending order on the Order block or find an entry on LTF within OB Zone. Trade Safe!

ETHUSD is in sell zone!!ETHUSD was in the upward channel for the short term. Currently, the price has broken out of this channel. As the long-term trend is down, it is highly likely that ETHUSD will continue to drop to the previous major support zone.
Press the like button if you enjoy this content :)
