ETHUSD UP Trend.!#ETHUSD Looking for Buy trade setup as I mentioned in the Chart.!
Keep Supporting LIKE, COMMENT And FOLLOW.!
ThankYou.!
Ethusdsignal

ETHUSD Down Trend.!#ETHUSD Looking for Sell trade setup as I mentioned in the Chart.!
Keep Supporting LIKE, COMMENT And FOLLOW.!
ThankYou.!

ETH Price ETHUSD H1Here is my view for ETHUSD on H1. The price should go down, you can put a pending order on the Order block or find an entry on LTF within OB Zone. Trade Safe!

ETHUSD Ascending Channel Pattern.!#ETHUSD Looking for Sell trade setup as I mentioned in the Chart.!
Keep Supporting LIKE, COMMENT And FOLLOW.!
ThankYou.!

ETH price ETHUSD H1Here is my view for ETHUSD on H1. The price should go down, you can put a pending order on the Order block or find an entry on LTF within OB Zone. Trade Safe!

ETH Price M15Here is my view for ETHUSD on M15. The price should go down, you can put a pending order on the Order block. Trade Safe!

ETH Price H4Here is my view for ETHUSD on H4. The price should go down, you can put a pending order on the Order block or find an entry on LTF within OB Zone. Trade Safe!

Ethereum Is Setting Up For More DownsideETHUSD advance in wave (2) is taking the shape of Elliott Wave w-x-y double zigzag correction. According to the theory, once the correction is completed the price will resume in the direction of the major trend.
The breakdown of the parallel channel will signal the resumption of the downtrend.
What's your view on Ethereum? Let me know in the comment.

ETH Price H1Here is my view for ETHUSD on H1. The price should go down, you can put a pending order on the Order block or find an entry on LTF within OB Zone. Trade Safe!

ETH Price D1Here is my view for ETH Price ETHUSD on D1. The price should go down, you can put a pending order on the Order block or find an entry on LTF within OB Zone. Trade Safe and happy new year!

ETHUSD Price H4here is my view for ETHUSD on H4. The price should go down, you can put a pending order on the Order block or find an entry on LTF within OB Zone. Trade Safe!

ETHUSDETH/USD has seen a steady and rather incremental price recovery this week after last weekend’s decline, but trading this morning is showing signs of value erosion
After almost hitting a price of 4500.00 in early trading this morning, ETH/USD has come off this high water mark not seen since the 3rd of December and slipped slightly. As of this writing, ETH/USD is near the 4360.00 ratio and trading conditions appear rather fast. Important short-term lows are within sight technically. If ETH/USD begins to challenge the 4350.00 to 4340.00 marks this could send a shiver of nervousness within speculators.
Yes, ETH/USD has done well since the bedlam demonstrated late last week took the cryptocurrency to lows that were not anticipated. After recovering from the spike which saw a low value of nearly 34700.00 exhibited, ETH/USD has methodically proven many buyers remain active. However the price action in Ethereum does remain rather volatile and trading just a few days ago demonstrated nervousness remains abundant.
On the 6th of December an early high was reached around 4200.00 only to see ETH/USD plunge to a low of nearly 3925.00. And then only a little while later, ETH/USD was making a high of 4350.00 approximately in the same day. This is where the value of ETH/USD is largely trading now three days later.
Choppy trading conditions are certainly part of the everyday landscape of ETH/USD, but recent tests of the 4000.00 psychological juncture is likely causing an increased amount of speculative nervousness. If current price levels are sustained and support near the 4330.00 mark proves vulnerable, ETH/USD may see further bearish movement short term. The broad cryptocurrency market has demonstrated some price declines in the short term, as they have given back some of their winnings made the past few days of trading.
Cautious speculators who are skeptical of ETH/USD upwards move made recently and believe another retest of lower support levels is going to be exhibited near term cannot be faulted. These conservative traders may want to wait for the 4330.00 to 4300.00 to be tested before igniting their selling positions. Traders who are looking for quick hitting trades, and want to sell after short term reversals higher have challenged resistance can also make a selling wager.
If resistance actually doesn’t prove durable and the 4400.00 to 4420.00 marks are toppled, another test of 4450.00 to 4500.00 could develop in the blink of an eye. Traders need to use their risk management wisely as ETH/USD fights to create a better trend.
Ethereum Short-Term Outlook
Current Resistance: 4400.00
Current Support: 4330.00
High Target: 4500.00
Low Target: 4153.00

ETHUSD | Ethereum Price Prediction Based on the Order BlockMy view on ETHUSD | Ethereum Price Prediction based on the order block from H1. Trade safe!

ETHUSD Is Heading Lower In Five WavesEthereum (ETHUSD) has just printed a bearish five-wave impulse sequence. This indicates that the current trend is to the downside.
Once the three-wave correction is completed, the price should resume lower in wave 3.

ETH/USD LONG SET UP TO NEW ALL TIME HIGHEthereum (ETH/USD) expanded its recent upside range early in the Asian session as the pair exhibited improving technical sentiment following the break of a recent relative high around the 4030.35 level. Stops were elected above some upside price objectives during the climb higher including the 4003.24 and 4151.87 areas, levels related to buying pressure that recently emerged around the 3373.45 level. Additional upside price objectives include the 4318, 4335, 4490, 4504, 4523, 4793, and 4893 levels.
Following the recent appreciation, downside price retracement levels and areas of potential technical support include the 3688, 3515, 3375, 3235, 3082, and 3035 levels. Traders are observing that the 50-bar MA (4-hourly) is bullishly indicating above the 100-bar MA (4-hourly) and above the 200-bar MA (4-hourly). Also, the 50-bar MA (hourly) is bullishly indicating above the 100-bar MA (hourly) and above the 200-bar MA (hourly).
Price activity is nearest the 50-bar MA (4-hourly) at 3794.86 and the 50-bar MA (Hourly) at 3908.54.
Technical Support is expected around 4000/ 3800/ 3700/ 3515.25/ 3375.24/ 3235.23 with Stops expected below.
Technical Resistance is expected around 4384.43/ 4518.94/ 4633.03/ 4840/ 5000 with Stops expected above.
On 4-Hourly chart, SlowK is Bearishly below SlowD while MACD is Bullishly above MACDAverage.
On 60-minute chart, SlowK is Bearishly below SlowD while MACD is Bullishly above MACDAverage.

ETHUSD SELL OR BUY???If break blue zones we focus buy till the red zone or if the price still reject on the current blue zone we sell
Have Fun :D

ETHUSDt signal (LONG)Hello friends.
Please support my work by clicking the LIKE button(If you liked).Thank you!
Everything on the chart.
open pos: 3300-3400
target zone: 3600-3700
stop: ~3220 (depending of ur risk). ALWAYS follow ur RM .
risk/reward 1 to 2.5
Good luck everyone!
Follow me on TRADING View, if you don't want to miss my next analysis or signals.
It's not financial advice.
Dont Forget, always make your own research before to trade my ideas!
Open to your questions or suggestions(Looking for investors!).

ETH/USD Sell Signal on 9th August 2021As we see ETH/USD close the daily candle of 8th August 2021 is red candles, we have resistance around 2950-2965, and heading to strong support around 2840-2865
Trading plan on 9th August 2021
Short ETH/USD 2950-2965 Sl 2985
Target TP: 2840-2865

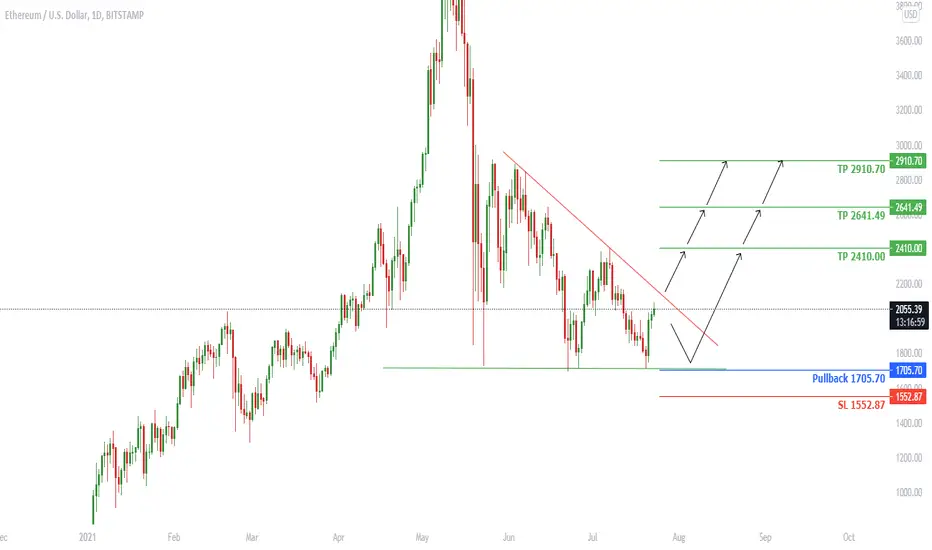
ETHUSD Waiting for Breakout
Welcome back Traders, Investors, and Community!
Hi Traders, ETHUSD on D chart is getting close to the end of Triangle, if we get a breakout on the lower TF we can look for entries. It might go down to 1705.70 before it goes higher.
⬆️Buy at Resistance Breakout or Buy at 1705.70
⭕️SL @ 1552.87
✅TP1 @ 2410.00
✅TP2 @ 2641.49
✅TP3 @ 2910.70
We will have more FREE forecasts in TradingView soon
❤️ Your Support is really appreciated!❤️
Have a Profitable Day
ETHUSDT and DOGEUSDT Technical Analysis
Welcome back Traders, Investors, and Community!
Here on ETHUSD the price has broken above the Bearish Trendline and it has got couple of rejection at the Bullish trendline. The first TP for the price would be 2220.0 and the second would be 2458.0
DOGEUSDT had formed a Bullish Flag and it has broken above the Bullish Trendline of the Flag which is a sign of Bullish trend.
The first TP would be 0.280 and then we would have 307.0 and 350.0
Traders, please hit the 👍 LIKE button if you like this idea and if you have your own opinion about this, please write it in the comment box. We will be glad for this.
We will have more FREE forecasts in TradingView soon
❤️ Your Support is really appreciated!❤️
Have a Profitable Day

ETHUSD Expecting BullishOn the ETHUSD daily time frame, we can see it's now trying to break out the support level, but before that, ETHUSD must make some correction upside. We can see it already creates an ABC pattern where the C is still unfinished. So, we are going to open a Buy call here and expecting to fill the C level.

Analysis update #ETH and the best shopping areaThe Pulback that we specified in the four-hour time frame was hit and is still falling. New shopping point $1452 which is the best point, friends who do not want to buy there can also do shopping according to the chart in Pulback
In the four-hour time frame, more precise points were identified, which has a good base for price return

ETHUSD maybe ready to shortETHUSD, like BTCUSD, is giving me the momentum candle I was looking for, confirming bearish price action....if the candle closes in this fashion! It could confirm the sellers are still in charge, and price will likely continue bearish. The fact that it is breaking back into the triangle structure is pretty telling.
Confirmation needed! No confirmation, no trade!
Check out my BTCUSD trade analysis video.
