Ethusdsignal


ETHUSD 4H-TIMEFRAME ANALYSISETHUSD 4H-TIMEFRAME ANALYSIS
Hello ladies and gentlemen
This is my new idea for Etherum
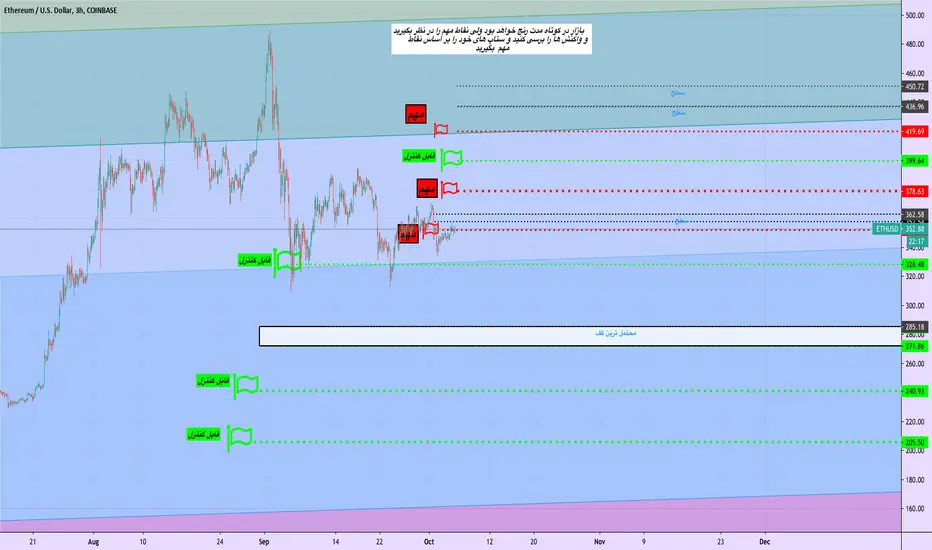
My idea is that ETH In the short term, it will continue to decline
Real support is between 250 and 240 It would be good to test it (the goal of breaking the wedge)
I hope my idea is clear
Support me by like and share
Good luck

ETHUSD double bottom and break of trend line + Bullish engulfingETHUSD
Around 309.00 area price got rejected twice and formed a Double bottom and bounced back from this level
Currently the price is above .236 Fibonacci retracement level. In 4 hour timeframe we are expecting a bullish engulfing candle. And its also reached a price action level and previous lows may turn support for the bear
Series of Higher high Higher low and Higher high was forming which is a bullish sign. In Elliot wave principal the 2nd wave is completed and the 3rd way is underway. We are expecting this 3rd wave will end at .50 Fibonacci retracement level and resistance zone and a key psychological 400.00 level
.50 Fibonacci is coordinated with the Lower high of Previous lower side impulse wave. And this level will act as resistance for the bull. If this level broken then the next target would be 450.00 which is a .786 Fibonacci level and swing area
The 50,100,200 Exponential moving average is acting as resistance for ethereum. RSI managed to move above 50 mark
If the USD will remain weaken we can expect this crypto will visit the 2020 high level which is around 490.00. On downside 310.00 will remain act as a major resistance level
Please give us a thumbs up if u like our work and do follow us so that you can get a regular update about upcoming setups and ideas


ETHUSD 4H-TIMEFRAME ANALYSISETHUSD 4H-TIMEFRAME ANALYSIS
ETH broke the support at 355 with high liquidity
Now it is back to test the area that is now resistance
It needs high liquidity to overcome the resistance
My analysis is that ETH will fail
He will have to return to test the temporary resistance at 310
I will update and share other ideas with the upcoming CRYPTO MARKETS movements
Good luck

ETHUSD Update: Short Trade After Breakdown of the Flag PatternETHUSD reversed from resistance and breakout of daily ascending trendline and support zone.
Price has been retracing the sell-off and currently retested the swing level correctively.
Price has the potential to move lower toward the support zone at $250 once we breach the green lines and flag channel.
Keep your eyes on this!
Previous Update:

ETHUSD Analysis: Further Weakness Ahead!Ethereum "ETHUSD" reversed from resistance level and break out of ascending trendline and support zone.
Price is currently reversing from ascending trendline and has the potential to retest the broken support as resistance.
Watch out for bearish price action signals from the swing level for a longterm short trade opportunity.
Targets at a support level around $250 are very probable!
What's your view on Ethereum? Kindly let me know in the comment.
Thanks,
Veejahbee.

ETH/USD Rockets To 2-Year Highs Technical Analysis (09/01/2020)Technical Analysis 1 September 2020
Ethereum (ETH/USD) extended recent gains early in today’s North American session as the pair appreciated to the 473.53 area after trading as low as the 428.65 area during the Asian session. Stops were elected above the 474.59 area, an upside price objective that represents the 50% retracement of the historical depreciation from 828.97 to 80.60. Additional upside price objectives include the 487.55, 498.68, 516.03, 517.38, 531.80, and 543.09 areas. The pair’s ongoing upward momentum was confirmed yesterday when buying pressure emerged around the 418.79 area during a pullback, representing the 61.8% retracement of the historical depreciation from 627.83 to 80.60. Stops were elected below the 398.91, 397.08, 396.37, 392.67, 386.63, 384.29, and 382.47 areas during the pair’s recent depreciation from the 447.50 area, and traders are curious to see if these levels provide any technical support during pullbacks.
The 396.69 area remains an important technical level, representing the 23.6% retracement of the historical depreciation from 1419.96 to 80.60. Following the pair’s recent appreciation, important technical levels include the 416.00, 409.64, 389.91, 383.02, 374.83, and 360.04 areas. Traders are observing that the 50-bar MA (4-hourly) is bearishly indicating below the 100-bar MA (4-hourly) and above the 200-bar MA (4-hourly). Also, the 50-bar MA (hourly) is bullishly indicating above the 100-bar MA (hourly) and above the 200-bar MA (hourly).
Price activity is nearest the 100-bar MA (4-hourly) at 407.83 and the 50-bar MA (Hourly) at 433.80.
Technical Support is expected around 349.75/ 331.95/ 315.08 with Stops expected below.
Technical Resistance is expected around 487.55/ 498.68/ 516.03 with Stops expected above.
On 4-Hourly chart, SlowK is Bearishly below SlowD while MACD is Bullishly above MACDAverage.
On 60-minute chart, SlowK is Bearishly below SlowD while MACD is Bullishly above MACDAverage.
Yesterdays Technical Analysis 31 August 2020 ETH
Ethereum (ETH/USD) added to recent gains early in today’s North American session as the pair appreciated to the 439.00 area after trading as low as the 418.16 area during the European session. Some Stops were elected above the 438.40 area during the ascent higher, representing the 78.6% retracement of the recent depreciation from 445.45 to 412.51. Traders had earlier pushed the pair as high as the 439.00 area during the Asian session before profit-taking knocked ETH/USD lower. Recently, bids emerged above the 377.44 area, representing a test of the 61.8% retracement of a recent appreciating range from 362.88 to 401.00. Stops were elected below the 398.91, 397.08, 396.37, 392.67, 386.63, 384.29, and 382.47 areas during the pair’s recent depreciation from the 447.50 area. Following the pair’s recent depreciation from the 447.50 level to the 379.53 area, traders are eyeing upside retracement levels around the 395.57, 405.49, 413.52, 421.54, and 431.46 areas. The 396.69 area remains an important technical level, representing the 23.6% retracement of the historical depreciation from 1419.96 to 80.60. Following the pair’s prior run-up, important technical levels include the 414.17, 396.12, 392.67, 383.53, 376.90, 363.13, and 358.75 areas. Recently, the pair has encountered buying pressure around the 23.6% retracement of the appreciating range from 268.39 to 415.00, and downside retracement levels in this appreciating range include the 373.89, 364.70, 355.50, 344.13, and 342.42 areas.
Afte recently taking out the 445.45 level, one upside price objective is the 454.79 areas. Stops were recently elected above the 336.10, 337.33, 342.29, 350.44, 354.22, 366.48, and 369.26 areas during the move higher. Recently, bids emerged just above the 314.07 area, a level that represents the 50% retracement of the broad historical depreciation from the 547.54 to 80.60. A couple of interesting levels that traders will observe during retracements lower include the 301.20 and 301.40 areas, and they are related to buying pressure that emerged around the 241.62 and 319.86 areas. Likewise, the 312.82, 316.32, and 322.16 levels are areas with important technical significance. Chartists are observing that the 50-bar MA (4-hourly) is bearishly indicating below the 100-bar MA (4-hourly) and above the 200-bar MA (4-hourly). Also, the 50-bar MA (hourly) is bullishly indicating above the 100-bar MA (hourly) and above the 200-bar MA (hourly).
Price activity is nearest the 100-bar MA (4-hourly) at 406.75 and the 50-bar MA (Hourly) at 418.57.
Technical Support is expected around 349.75/ 331.95/ 315.08 with Stops expected below.
Technical Resistance is expected around 454.79/ 487.55/ 498.68 with Stops expected above.
On 4-Hourly chart, SlowK is Bullishly above SlowD while MACD is Bullishly above MACDAverage.
On 60-minute chart, SlowK is Bearishly below SlowD while MACD is Bearishly below MACDAverage.

ATS efficiency report since July for ETH/USDWe continue the ATS strategy reports section.
Today’s guest is ETH/USD.
For the last two months, the pair has shown excellent dynamics.
But the ATS strategy worked even better than the buy and hold strategy.
ATS strategy made 76 percent, the asset grew by 70%
Current open position (Is not being taken into account for result calculation) at the moment + 22%
Script settings for 2H timeframe:
· Signal calculation type - "Low"
- Signals filter - "Enabled"


ETH/USD Thwarted By 200-Hour Simple Moving AverageEthereum (ETH/USD) found a small bid early in today’s North American session as the pair appreciated to the 412.04 area after trading as low as the 393.75 area earlier in the Asian session. Stops were reached below the 401.57 area during the pair’s move lower, a relative low from earlier this week, with further Stops elected below the 398.91 and 397.08 areas. Buying pressure emerged above the 392.67 area, representing the 38.2% retracement of the recent appreciation from 215.16 to 447.50. Chartists are noting that the pair has recently been capped around or below the 100-bar simple moving average on 4-hourly charts. Following the pair’s recent depreciation from the 447.50 level to the 393.75 area, traders are eyeing upside retracement levels around the 413.05, 419.63, 426.20, 434.34, and 435.57 areas. The 396.69 area remains an important technical level, representing the 23.6% retracement of the historical depreciation from 1419.96 to 80.60. Following the pair’s recent run-up, important technical levels include the 414.17, 396.12, 392.67, 383.53, 376.90, 363.13, and 358.75 areas. Recently, the pair has encountered buying pressure around the 23.6% retracement of the appreciating range from 268.39 to 415.00. Downside retracement levels in this appreciating range include the 373.89, 364.70, 355.50, 344.13, and 342.42 areas.
After recently taking out the 445.45 level, one upside price objective is the 454.79 areas. Stops were recently elected above the 336.10, 337.33, 342.29, 350.44, 354.22, 366.48, and 369.26 areas during the move higher. Recently, bids emerged just above the 314.07 area, a level that represents the 50% retracement of the broad historical depreciation from the 547.54 to 80.60. A couple of interesting levels that traders will observe during retracements lower include the 301.20 and 301.40 areas, and they are related to buying pressure that emerged around the 241.62 and 319.86 areas. Likewise, the 312.82, 316.32, and 322.16 levels are areas with important technical significance. Chartists are observing that the 50-bar MA (4-hourly) is bullishly indicating above the 100-bar MA (4-hourly) and above the 200-bar MA (4-hourly). Also, the 50-bar MA (hourly) is bearishly indicating below the 100-bar MA (hourly) and below the 200-bar MA (hourly).
Price activity is nearest the 100-bar MA (4-hourly) at 404.78 and the 50-bar MA (Hourly) at 413.54.
Technical Support is expected around 349.75/ 331.95/ 315.08 with Stops expected below.
Technical Resistance is expected around 454.79/ 487.55/ 498.68 with Stops expected above.
On 4-Hourly chart, SlowK is Bullishly above SlowD while MACD is Bearishly below MACDAverage.
On 60-minute chart, SlowK is Bearishy below SlowD while MACD is Bullishly above MACDAverage.
Title :ETH/USD BUY LIMIT ORDER
Asset : Crypto
Symbol : ETH/USD
Type : Limit Order
Time Frame : 4hr
Entry Price 1 : $331.00
Entry Price 2 : $306.00
Stop Loss : $296.00
Take Profit 1: $371.00
Take Profit 2 : $406.00
Take Profit 3: $451.00
Trail your stop loss
Take profit 4 $487.00
Take profit 4 $506.00

ETHUSDT (Bullish)Hi To All Traders !
Everything IS Clear .
IF You Agree Hit The Like Bottom And Support Me.
The Information Provided Is Not Trading Advice But An Informative Analysis Of The Price Movement.

ETH/USD LONG SET UPEthereum (ETH/USD) was on the back foot early in today’s North American session as the pair weakened to the 382.00 area after trading as high as the 403.64 area during the Asian session. Traders observe that the pair has continued to derive technical support around the 50-bar simple moving average, and has recently encountered buying pressure around the 23.6% retracement of the appreciating range from 268.39 to 415.00. Downside retracement levels in this appreciating range include the 373.89, 364.70, 355.50, 344.13, and 342.42 areas. ETH/USD recently spiked to the 415.00 area, a test of the 418.79 level that represents the 61.8% retracement of the historical depreciation from 627.83 to 80.60. ETH/USD then quickly plunged to the 325.75 area, right around the 50-bar simple moving average on 4-hourly charts, and just above the 50% retracement of the recent appreciation from 229.77 to 415.00. Additional upside price objectives include the 425.31, 437.31, and 454.79 areas. Stops were recently elected above the 336.10, 337.33, 342.29, 350.44, 354.22, 366.48, and 369.26 areas during the move higher.
Following the pair’s recent run-up, traders are observing retracement levels around the 373.47, 371.29, 367.84, 360.65, 358.70, 347.82, 344.24, 338.66, 338.30, 331.95, 329.55, 323.87, 322.39, and 315.08 levels. Last week, bids emerged just above the 314.07 area, a level that represents the 50% retracement of the broad historical depreciation from the 547.54 to 80.60. A couple of interesting levels that traders will observe during retracements lower include the 301.20 and 301.40 areas, and they are related to buying pressure that emerged around the 241.62 and 319.86 areas. Likewise, the 312.82, 316.32, and 322.16 levels are areas with important technical significance. Chartists are observing that the 50-bar MA (4-hourly) is bullishly indicating above the 100-bar MA (4-hourly) and above the 200-bar MA (4-hourly). Also, the 50-bar MA (hourly) is bullishly indicating above the 100-bar MA (hourly) and above the 200-bar MA (hourly).
Price activity is nearest the 50-bar MA (4-hourly) at 349.26 and the 50-bar MA (Hourly) at 384.90.
Technical Support is expected around 305.98/ 293.26/ 281.92 with Stops expected below.
Technical Resistance is expected around 425.31/ 437.31/ 454.79 with Stops expected above.
On 4-Hourly chart, SlowK is Bearishly below SlowD while MACD is Bearishly below MACDAverage.
On 60-minute chart, SlowK is Bearishly below SlowD while MACD is Bearishly below MACDAverage.

ETHUSDT Double Bottom Pattern hi to all traders
according to the double bottom pattern and the symmetric growth parameter.
i expect the pattern to be complete...
and I expect the price to touch newer than before and
continue to grow at the rate of the second triangle and then correct the price
if you're agree hit the like bottom and follow my account.
the information provided is not trading advice but an informative analysis of the price movement
continue to grow at the rate of the second triangle and then correct the price

ETH/USD LONG SET UP Technical Analysis July 28 Ethereum (ETH/USD) rebounded in today’s North American session as the pair appreciated to the 320.74 area after profit-taking pushed the pair lower to the 306.29 level, a test of the 305.98 area that represents the 38.2% retracement of the recent appreciating range from 260.10 to 334.34. Stops were triggered below the 312.46, 310.62, and 309.66 areas, retracement levels related to recent appreciating ranges from the 241.62, 223.85, and 229.77 areas. Traders were able to push the pair to a fresh 2020 high after Stops were triggered above the 328.56 area, a level related to buying pressure that emerged around the 90.00 area after the pair’s precipitous decline this year. Related areas of technical significance that traders will continue to observe include the 312.82, 316.32, and 322.16 areas. Additonal upside price objectives include the 336.10, 337.33, 342.29, 350.44, 354.22, 366.48, and 369.26 areas. A couple of interesting levels that traders will observe on retracements lower include the 301.20 and 301.40 areas, and they are related to buying pressure that emerged around the 241.62 and 319.86 areas. After crossing the psychologically-important 300.00 figure, technical support is now evident around the 309.66, 294.49, 282.06, and 269.72 levels.
Title :ETH/USD BUY LIMIT ORDER
Asset : Crypto
Symbol : ETH/USD
Type : Limit Order
Time Frame : 4hr
Entry Price 1 : $281.80
Entry Price 2 : $273.80
Stop Loss : $265.80
Take Profit 1: $302.00
Take Profit 2 : $322.00
Take Profit 3: $340.00
Trail your stop loss
Take profit 4 $360.00
If the market fails to sustain its recent move above the 300 area, traders are waiting to see what will happen around areas of technical significance including the 281.81, 275.07, 267.19, 260.83, 254.46, and 246.58 levels. Stronger bids are likely in place around the 298.60, 285.45, 274.82, and 264.18 areas. Appreciating ranges that are technically significant include the move from 229.77 to 334.34, the move from 233.85 to 334.34, the move from 241.62 to 334.34, the move from 260.10 to 334.34, and the appreciation from 90.00 to 334.34. Important technical levels related to those ranges include the 276.68, 269.72, 254.45, and 241.00 areas, and traders are very interested to observe how price activity reacts around these levels. Chartists are observing that the 50-bar MA (4-hourly) is bullishly indicating above the 100-bar MA (4-hourly) and above the 200-bar MA (4-hourly). Also, the 50-bar MA (hourly) is bullishly indicating above the 100-bar MA (hourly) and above the 200-bar MA (hourly).
Price activity is nearest the 50-bar MA (4-hourly) at 280.91 and the 50-bar MA (Hourly) at 318.97.
Technical Support is expected around 305.98/ 293.26/ 281.92 with Stops expected below.
Technical Resistance is expected around 349.75/ 354.22/ 366.48 with Stops expected above.
On 4-Hourly chart, SlowK is Bullishly above SlowD while MACD is Bearishly below MACDAverage.
On 60-minute chart, SlowK is Bullishly above SlowD while MACD is Bullishly above MACDAverage.

ETH/USD 240m Support and ResistanceMulti timeframe Support and Resistance for ETH/USD using the 240m tf

ETHUSDt signal (LONG)Hello friends.
Please support my work by clicking the LIKE button(If you liked).Thank you!
Everything on the chart.
IDEA WITH GROWTH IS RELEVANT ONLY IF BTC WILL RISE, KEEP EYES ON BTC!!!
open pos: market
targets: 237 - 241 - 245
after first target reached move ur stop to breakeven
stop: under 227 (depending of ur risk). ALWAYS follow ur RM .
Good luck
Follow me on TRADING View, if you don't want to miss my next analysis or signals.
Good luck.
It's not financial advice.
Dont Forget, always make your own research before to trade my ideas! If i help you to earn some money i will RLY VERYVERY appreciate for your donate.
Open to your questions or suggestions(PM to me).

ETHUSDt locally signal (SHORT)Hello friends.
Please support my work by clicking the LIKE button(If you liked).Thank you!
Everything on the chart.
open pos: market and 1 more sell limit order on ~238.1
targets: 229-227
stop: ~240(depending of ur risk). ALWAYS follow ur RM .
risk reward 1 to 3
Good luck
Follow me on TRADING View, if you don't want to miss my next analysis or signals.
Good luck.
It's not financial advice.
Dont Forget, always make your own research before to trade my ideas! If i help you to earn some money i will RLY VERYVERY appreciate for your donate.
Open to your questions or suggestions(PM to me).

ETHUSDt locally signal (LONG)Hello friends.
Please support my work by clicking the LIKE button(If you liked).Thank you!
Everything on the chart.
open pos: 243(market) and 241.5
targets: 255 and 267
after first target reached move ur stop to breakeven
stop: 235 (depending of ur risk). ALWAYS follow ur RM .
risk profit: almost 1 to 3.5
Good luck
Follow me on TRADING View, if you don't want to miss my next analysis or signals.
It's not financial advice.
Dont Forget, always make your own research before to trade my ideas! If i help you to earn some money i will RLY VERYVERY appreciate for your donate.
Open to your questions or suggestions(PM to me).

ETH/USD - Short to $221.GAP on the CME exchange
To be at the $220 level.
That's where we aim.
Bitcoin confirms intent to fall.
Push ❤️ if you think this is a useful idea!
Before to trade my ideas make your own analysis.
Thanks for your support!

Ethereum Reached the Important Level, It's time watch this levelEthereum is currently trading in a Important Resistance area!
If it breaks upside the resistance it will go more higher up to 290$
But, If Ethereum can't break through this resistance and breaks the trend support, we can see Ethereum again in 150-160$ level.
We can also see a bearish divergence in RSI, it's not fully confirmed yet! We need to see how the today's candle closes!
I will update this in future seeing the market!
Please hit the like button and comment your thoughts! 👍👍👍 :)
Stay Tuned;
