ETHEREUM Major rally ahead if the 1W MA50 breaksLast time I looked into Ethereum (ETHUSD) was at the beginning of the month, where I presented a trading plan based on the break-outs of the Triangle on the 1D time-frame:
Now that the price broke above the Triangle, causing a bullish break-out signal as per the strategy, it is time to look into ETH again but on the 1W time-frame as we are ahead of a critical test.
As you see, the price is about to hit the 1W MA50 (blue trend-line). ETH hasn't closed a week above it since the January 10 2022 1W candle. It doesn't therefore take much to realize how important of a Resistance level this trend-line is. What may be even more crucial though is the fact that during the 2016/2017 Bull Cycle, the price formed the very same Accumulation pattern that ETH has been currently in since the May 10 2021 candle.
At that time, the accumulation ended when after 2 months of trading below the 1W MA50, Ethereum closed a 1W candle above the 1W MA50, causing a bullish break-out signal and initiating a massive parabolic rally. Right now, we may be entering this last phase of the Accumulation where a 1W candle close above the MA50, can kick-start the next rally. Even the 1W RSI sequences during the Accumulation phases are similar. Regarding where the next top may be, a safe idea is to look for a test of the RSI Resistance Zone, which is where the rallies historically take a pause.
--------------------------------------------------------------------------------------------------------
** Please support this idea with your likes and comments, it is the best way to keep it relevant and support me. **
--------------------------------------------------------------------------------------------------------
Ethusdsignals

ETHUSD Lower Highs and 1D MA100 are the key. How to trade those.Ethereum is currently testing its 1D MA50 (blue trend-line) and even though it has marginally broken above it three times since December 09 2021, it failed to hold a sustainable rise and got rejected under the pressure of a Lower Highs trend-line.
The very same Lower Highs trend-line has been seen during the previous correction and subsequence Accumulation Phase on ETH's bottom, below again the 1D MA50. However, it was when the 1D MA100 broke (green trend-line), which happened to be just below the 0.382 Fibonacci retracement level, that ETHUSD confirmed entering a bullish trend long-term.
We just so happen to be on a similar situation now, with the 1D MA100 declining rapidly near the 0.382 Fib. We monitor the price action first for a break above the Lower Highs trend-line and then for a break-out above the 1D MA100, in order to confirm the bullish reversal on the long-term. In that scenario, look for a first High near the 0.618 Fib, as in August 2021, which is currently just over $3800. If the Lower Highs trend-line rejects the price again look for a pull-back towards the 2160 low again.
--------------------------------------------------------------------------------------------------------
** Please support this idea with your likes and comments, it is the best way to keep it relevant and support me. **
--------------------------------------------------------------------------------------------------------

ETHEREUM getting ready for $10k. Last chance to buy?It has been a while since I looked into Ethereum but what a better time to look at it than now. Ever since the May high, the price has been trading inside a Triangle. This pattern resembles the June - November 2017 Triangle which was the last accumulation phase of the 2017 Cycle before a final parabolic rise that formed the market top just below the 4.382 Fibonacci extension.
The two fractals are identical. Both parabolic rallies initially started after a 1D Golden Cross (the MA50 crossing above the MA200 (blue and orange trend-lines respectively), that followed a market bottom (Fib extensions measured from that bottom). The Triangles are the last accumulation phase before the blow-off top. The LMACD sequences are also quite similar.
If the pattern plays out exactly as the 2017 fractal, then currently we may be on one of the last chances to buy before the parabolic rally towards the $10000 mark. The 4.382 Fib extension is a little below $17000.
Will there be a better opportunity to buy ETHUSD or you are not missing this one? Feel free to share your work and let me know in the comments section!
--------------------------------------------------------------------------------------------------------
** Please support this idea with your likes and comments, it is the best way to keep it relevant and support me. **
--------------------------------------------------------------------------------------------------------

ETHEREUM bounced exactly on the 1DMA50. We have seen this beforeETHUSD followed the general bearish market sentiment yesterday and as all cryptos, registered a strong (almost -25%) correction. The unique feat for ETH is that its correction stopped exactly on its 1D MA50 (blue trend-line).
My long term outlook on Ethereum is the following and I've last updated it on July 28, shortly after the break above its 1D MA50 gave a strong buy confirmation:
Right now, the price is holding above the Support Zone, forming a Rising Wedge (almost Triangle) pattern. According to my July chart above, we've seen this pattern every time ETH broke above the 1D MA50 and rallied since the March 2020 COVID global meltdown. As you see on the snapshots below, on all occasions, the price held the 1D MA50 and rebounded:
Is this a strong signal calling for a continuation of the long-term bullish trend? Most likely yes based on the technical data above. However a candle closing below the 1D MA50 could deliver further selling towards the 1D MA200 (orange trend-line) and take the market to a medium-term consolidation phase between the two before resuming the uptrend.
** Please support this idea with your likes and comments, it is the best way to keep it relevant and support me. **
--------------------------------------------------------------------------------------------------------
!! Donations via TradingView coins also help me a great deal at posting more free trading content and signals here !!
🎉 👍 Shout-out to TradingShot's 💰 top TradingView Coin donor 💰 this week ==> GJMRealEstate
--------------------------------------------------------------------------------------------------------

ETHUSD BUYING ON DIPS As i can see ETH is ready to make new higher high as soon as this break the resistence are then i will start
to make a new higher high we are rading this pair with a low risk and looking for higher rewards
Friends push like and comments we appreciate ur love and support
Follow us for more updates

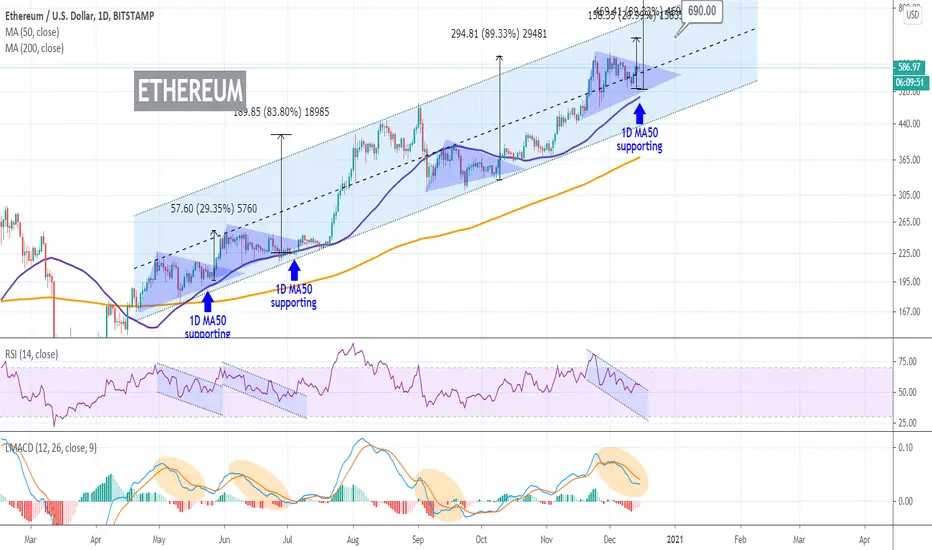
ETHEREUM forming a bullish break-out pattern to $690ETHUSD is holding its 9 month Channel Up, currently having formed a Triangle within. As seen on the chart, every time such a pattern (Triangle) is formed, the price breaks to the upside. Some times more aggressive (+83%, +89%), others less (+29%).
At the same time, while the Triangle is formed, the RSI prints a Channel Down (showing accumulation in process) and the LMACD being descending, makes a Bullish Cross. The only exception to the RSI is the Sept/ Oct Triangle, but that traded below the the 1D MA50 (blue trend-line). In all other occasions, the 1D MA50 was supporting (as it does now).
A +29% rise tops at $690, a +89% would top at $990. Which one do you think its going to be?
Feel free to share your work and let me know in the comments section!
Please like, subscribe and share your ideas and charts with the community!
--------------------------------------------------------------------------------------------------------
!! Donations via TradingView coins also help me a great deal at posting more free trading content and signals here !!
🎉 👍 Shout-out to TradingShot's 💰 top TradingView Coin donor 💰 this week ==> TradingView
--------------------------------------------------------------------------------------------------------
**BONUS MATERIAL: My most recent ETHBTC analysis **
ETHEREUM on the weekly chart. Is $600 achievable?Last week I posted the following chart on Ethereum:
** The Inner Channel Up **
It was about the final Resistance level of 400 that ETH had to break before its April Channel Up (inner/ blue) on the 1D chart turned bullish again. Well it happened, as the 1D MA50 turned into Support, and the price is moving higher.
** The Outer Channel Up **
My attention now shifts back to the 1W chart, which (excluding the March melt-down) is dictated by a very clear Channel Up too (outer). See how harmonically the price is pivoting on the middle (dashed) trend-line of this Channel Up (red and green arrows). This Channel started after the December 2018 bottom and since then, it is the first time that a weekly candle closes that high after a bounce on the middle trend-line. Clear bullish strength with the sentiment getting even stronger as the LMACD is about to make a bullish cross.
Can Ethereum take advantage of this momentum and reach $600 before the end of the year, which will be a Higher High on the long-term (outer) Channel Up? A roughly +95% increase from the last low, certainly shows it can! And as you see on the chart this +95% rise has been consistent in marking Higher Highs since December 2018, successfully making 5 occurrence already!
Feel free to share your work and let me know in the comments section!
Please like, subscribe and share your ideas and charts with the community!
--------------------------------------------------------------------------------------------------------
!! Donations via TradingView coins also help me a great deal at posting more free trading content and signals here !!
🎉 👍 Shout-out to TradingShot's 💰 top TradingView Coin donor 💰 this week ==> TradingView
--------------------------------------------------------------------------------------------------------

ETHEREUM one level left to break before the next jumpETHUSD has been trading within a Channel Up on the 1D chart since early April. The price has traded on the lower half of the pattern for most of the time, which serves as the demand zone for accumulation. The upper half was used so far for profit taking by long-term traders.
Though this framework is relevant, the most important development of the last days is the $400 Resistance which has been tested (and failed to break) three days ago. This is similar to the June-mid July price action when ETH again struggled to break the (at the time) 255 Resistance, but when it did an aggressive rally started straight to the profit taking zone of the Channel Up.
Notice how in both cases during the later stages of the Resistance testing, the 1D MA50 (blue trend-line) turned into Support. Also the LMACD pattern is similar.
Do you expect a strong rally once this Resistance breaks? Feel free to share your work and let me know in the comments section!
Please like, subscribe and share your ideas and charts with the community!
--------------------------------------------------------------------------------------------------------
!! Donations via TradingView coins also help me a great deal at posting more free trading content and signals here !!
🎉 👍 Shout-out to TradingShot's 💰 top TradingView Coin donor 💰 this week ==> AxelShadah
--------------------------------------------------------------------------------------------------------

ETHEREUM The Channel Up that makes buyers worry.ETHUSD has been one of the surprises of the post-March collapse, having broken above its June 2019 High, while BTC is lagging. Despite this success that has revived investing interest on this coin, there is a certain pattern that holders would want to see breaking upwards as it comes with strong bearish bias.
** The Channel Up on 1W **
That is the Channel Up you see on this chart. With perfect Higher High trend-line touches on the 1W candles of August 20 2018, June 24 2019 and recently August 21 2020. As you see the middle of the Channel also serves as a Resistance/ Support level at times. Every Higher High is on the 1.15 Fibonacci extension of the previous Low-High leg.
** The LMACD **
The Channel suggests that if the 1W MA20 breaks, the leg to a new Higher Low may begin. The LMACD just made a Bearish Cross, which on July 2019 marked the start of a drop below the median, while on March took place exactly at the bottom (even outside) of the Channel.
** The RSI **
Positive sentiment though comes from the RSI which shows that if it keeps trading within the neckline of the H&S (within of course its own Channel Up), which I marked by the yellow shape, the price may remain higher than where it was on the left part of the neckline, i.e. currently above the middle (white dashed line). What the RSI must avoid is the Red Zone (on the bottom of the Channel).
It goes without saying that ETH buyers wouldn't want to see this Channel Up fulfill its technical gap and instead break above it and start a new, more aggressive bullish pattern .
What do you think will happen? Feel free to share your work and let me know in the comments section!
Please like, subscribe and share your ideas and charts with the community!
--------------------------------------------------------------------------------------------------------
!! Donations via TradingView coins also help me a great deal at posting more free trading content and signals here !!
🎉 👍 Shout-out to TradingShot's 💰 top TradingView Coin donor 💰 this week ==> gergiabboud
--------------------------------------------------------------------------------------------------------

BITCOIN bringing rally memories to ETHEREUM??This is an interesting find I came across while comparing ETH's current cycle on the 1W chart to BTC's previous (2014 - 2017) Cycle.
As you see Ethereum, not only follows Bitcoin's Bear Market structure but also the consolidation that took place after, which led to the Bull Market rally. When that consolidation broke to the upside and the price pulled-back to test the (previous) top of the structure as Support, it held and kickstarted the aggressive phase of the Bull Market for Bitcoin.
Will history ETHUSD follow Bitcoin on this one? Feel free to share your work and let me know in the comments section!
Please like, subscribe and share your ideas and charts with the community!
!! Donations via TradingView coins also help me a great deal at posting more free trading content and signals here !!
Shout-out to TradingShot's top TradingView Coin donor this week ==> CITIZENCAINE

ETHEREUM Pump/ Rinse/ RepeatWell it appears that this is the sequence for Ethereum since late April: Pump-Rinse-Repeat.
More specifically the last two Pump sequences (April 21-30 and May 21-June 01) have been around +37%. After their peak, the price pulled back and consolidated within a Cup pattern. As mentioned this has been done twice already.
Right now, the 3rd sequence has began and there is still another +9% to go in order to complete the 37% range, which if repeated, will peak at $312.
Notice also how the 4H LMACD is just about to form a Bearish Cross, which during the last sequence (May 31) market the final leg upwards to the blow-off top.
Will this be repeated?
Please like, subscribe and share your ideas and charts with the community!

ETHEREUM Indications that the Bull Rally is startingAnother simple study on ETHUSD making use of the MA20 and the LMACD on the 1M (monthly) chart.
As you see both showcase strong bullish signals. In particular, the LMACD made a Bullish Cross in May but the important thing is that Ethereum has been making Higher Highs since, indicating a sustainable uptrend.
On top of that the MA20 has turned bullish for the first time since the 2018 Bear Market.
Additionally, the short-term bearish fractal posted early this month, got invalidated yesterday:
Are you ready to join the ride?
** Please support this idea with your likes and comments, it is the best way to keep it relevant and support me. **

ETHEREUM Bearish fractal and how it is invalidatedEthereum is trading within a 1 month Channel Down on the 1D chart. This is the second Channel Down in a row it has been trading in since April 20th. The first was invalidated when the price aggressively broke to the upside and hit 254.00.
The broader pattern is a Bearish Megaphone that started with the June 26th peak. The same Channel Down in a row pattern took place on that peak. Once the price broke the 2nd Channel Down to the downside, it dropped to the 1D MA200.
Since the current Channel Down made a High on the Bearish Megaphone's Lower Highs trend-line, it is possible to see a similar drop to the 1D MA200 if the Channel Down breaks downwards. The pattern is invalidated of course if the Lower Highs trend-line of the Bearish Megaphone breaks upwards, in which case ETHUSD turns bullish on even larger time-frames.

Ethereum Monthly Chart Reveals Likely DirectionSparksterSignals hasn't done a manual analysis of ETHUSD for a while. Looking at the big picture on the monthly chart reveals MACD momentum is becoming positive and price action via Heiken Ashi setting also shows positive momentum.
However, the 2 week and 1 week time-frames look like time for consolidation so we're not expecting fast price appreciation quite yet...
The red trend-line needs to be broken first. At that point the weekly momentum may fly in formation with the monthly momentum and price can continue towards previous ATH — taking the rest of the altcoin market up with it!
Triggers at the ready...

ETHEREUM Similarities with early 2019 and the Death CrossBefore we start please support this idea with your likes and comments, it is the best way to keep it relevant and support me.
** The Bearish Megaphone and Death Cross **
ETHUSD is on a strong 4 week rise since the $90.00 bottom. That bottom was made on the Lower Low trend line of the Bearish Megaphone pattern that started with June's $365 High, so technically it was backed up. A interesting mix of bearish signs arises as the price is now not only just below the 0.618 Fibonacci retracement level (counting 290.00 as the High) but also a Death Cross on the 1D chart (MA50 crossing below the MA200) is emerging.
** The Fractals **
The above combination of indicators is bearish. On top of that I have discovered similarities on the current trading pattern from the 290 High to the 90 Low (Fractal 1) with the September 2018 - January 2019 sequence (Fractal 2). As you see on the chart, both Fractals stopped on roughly a -68% decline from their Top. Fractal 1 was rejected on its first (and second later) test on the 0.618 Fibonacci level and pulled back to find Support roughly on the 0.236. Assuming the current Death Cross takes effect, we can expect a similar rejection on the 0.618 Fib level (around 185.00) and a pull back to 0.236 Fib (roughly 120.00), assuming the pattern is replicated on the exact same fashion.
Based on Fractal 1 and that pattern alone, we can expect ETH to touch $290.00 again by September 2020. Do you agree with this idea? Feel free to share your work and let me know in the comments section!
Please like, subscribe and share your ideas and charts with the community!

ETHUSD Stuck on the volatility zone. Buy the pull back.Pattern: Channel Up on 1D.
Signal: Bullish near 225.00. It is a symmetrical pattern of the April-June uptrend.
Target: $360 (just below the Resistance Zone).

ETH/USD LONG set up on pullback ($220)Buy ETH/USD
Entry 1 192.20
Entry 2 189.14
Entry 3 187.96
Sl 181.19
Tp.1 200.42
Tp.2 205.42
Tp.3 210.10
Tp.4 214
Tp.5 220
Tp.6 240

ETH/USD LONG SET UP ON 4hr Buy ETH/USD
Entry 1 155.30
Entry 2 152.60
Sl 150
Tp.1 160
Tp.2 166
Tp.3 170
Tp.4 178
Tp.5 186

ETHEREUM is a 2nd chance for those who missed out on BITCOINI have been into ETHUSD for a very long time and was always interested at the fundamental similarities with BTCUSD. I always thought that Ethereum was repeating Bitcoin's first Cycle and even published this study:
I am not going to go into much detail on this analysis. The candle action resemblance of ETH with BTC's first cycle is striking. I am gonna leave this to you. Do you think ETH is another opportunity for those who missed investing on BTC's early years? Let me know in the comments section!
Please like, subscribe and share your ideas and charts with the community!

ETH DOMINANCE Bullish DivergenceWith Ethereum approaching again the 1W MA50 on the dominance chart, I thought it would be a could time to look at its key indicators, RSI and MACD. Both show a Bullish Divergence despite trading on a Falling Wedge printing Lower Lows.
Do you agree with this chart?

ETHUSD Buy SignalPattern: 1D Falling Wedge.
Signal: Bullish as the price is approaching the Support Zone and the pattern is close to exhaustion.
Target: 230.00 and 280.00 in extension.

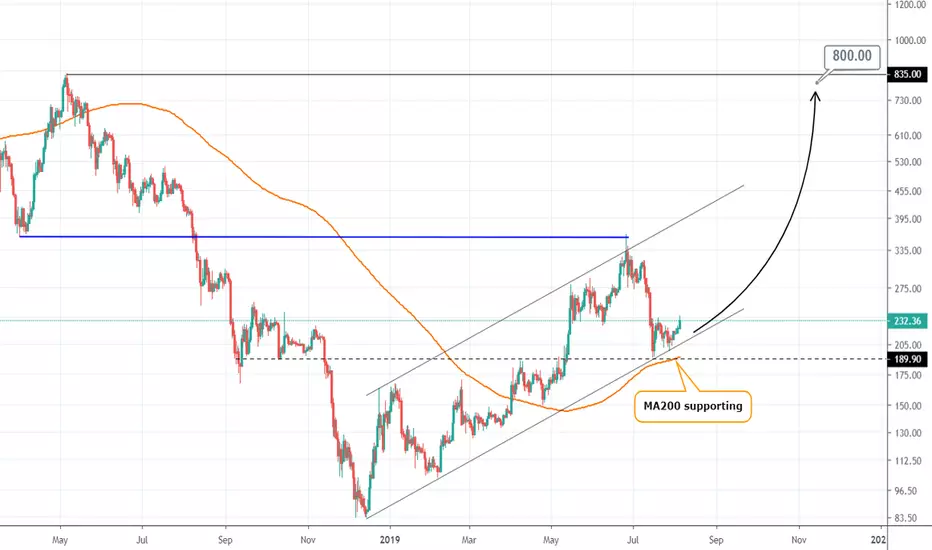
ETHEREUM to $800 before the end of the yearETH has reached an important support level consisting of both the Higher Low of the 1W Channel Up that started with the 2018 bottom and the MA200. This technically creates the ideal long term buy entry.
Since the 2019 uptrend strategically and methodically targets the Lower Highs and Lower Lows of the 2018 Bear Cycle, it is logical to assume that the next target for Ethereum is $800.
ETHEREUM bulls should be happy with this cross!Haven't looked into Ethereum for a while and the reason is because it has been trading on an incredibly steady bullish pattern. The price has been accumulating, then spiking to a standard peak, profit taking. Then the process is repeated.
What stands out as the strong signal of an upcoming rise is the crossing of the MA50 and MA200 on the 4H chart. The MA200 always supports while the MA50 directs. Once crossed they remain aligned for a while (essentially the accumulation phase) before the MA50 breaks upwards again, delivering the spike. The RSI pattern is also similar.
Currently the two MA periods are crossed so I expect ETH to accumulate. Good time to load more longs in my opinion for a break above $320!
