#ETHUSDT: Price to Touch All Time High $4500 By End Of YearETHUSDT has hit lowest point and we might see a price reversal towards $4500, which would be an all-time high. There are three potential targets for the price to reach.
Good luck and trade safely!
Best regards,
Team Setupsfx_
We’d love for you to support and encourage us!
- Like our ideas
- Share your thoughts
- Share our work if it helps
ETHUSDT

ETHUSDT: Progressing Well 01/05/2025 UPDATEThe ETHUSDT price is moving well, currently trading above the 1700$ area. We anticipate a continuous rise, potentially reaching $2400 first and then $3000. Our swing target remains at $4500. The current price behaviour and momentum suggest an extremely bullish outlook.
Good luck and trade safely!
Thank you for your unwavering support! 😊
If you’d like to contribute, here are a few ways you can help us:
- Like our ideas
- Comment on our ideas
- Share our ideas
Team Setupsfx_
❤️🚀

ETH ANALYSIS (12H)This analysis is an update of the analysis you see in the "Related publications" section
Ethereum has finally reached the flip zone.
Pay close attention: Ethereum dominance is sitting on monthly support, which is a level with strong bounce potential.
We have two possible scenarios for Ethereum | either it breaks through the flip zone, or it makes a correction and turns bullish again from around the bottom.
⚠️ What’s clear is that shorting Ethereum is risky and doesn’t make sense!
For risk management, please don't forget stop loss and capital management
When we reach the first target, save some profit and then change the stop to entry
Comment if you have any questions
Thank You

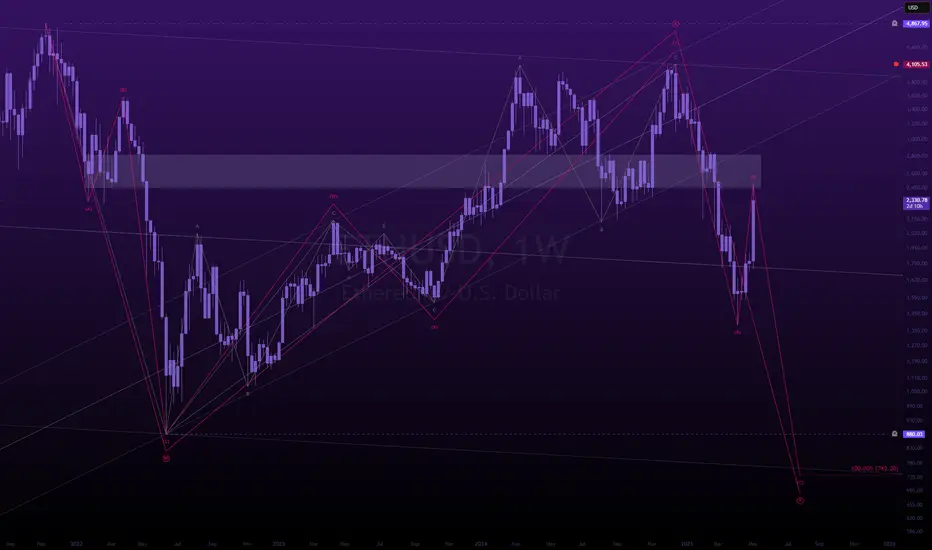
one last dancegm.
you finally woke up and ethereum was soaring.
you saw the bounce. the reclaim. the headlines.
you convinced yourself the bottom was in.
you drew trendlines, watched influencers say “we’re so back.”
you wanted to believe.
and that’s exactly what wave B needed.
because this wasn't a breakout.
it’s a reset.
a psychological rinse,
engineered to bait late longs and build fuel for the final l i q u i d a t i o n.
this is the macro (W)-(X)-(Y).
not hopium, not dreams structure.
wave A brought devastation.
wave B brought complacency
wave C brings the execution.
make no mistake:
we’re not going up,
we’re being set up.
the chart says $742.
you call it impossible.
but the market doesn’t care what you believe.
the market only exists to find the maximum pain,
your maximum pain.
eth to $700 is not a prediction.
it’s a scheduled event.
and you’re RSVP’d unless you wake up.
wave C of wave (Y) is coming.
and it doesn’t care how bullish you feel.
---
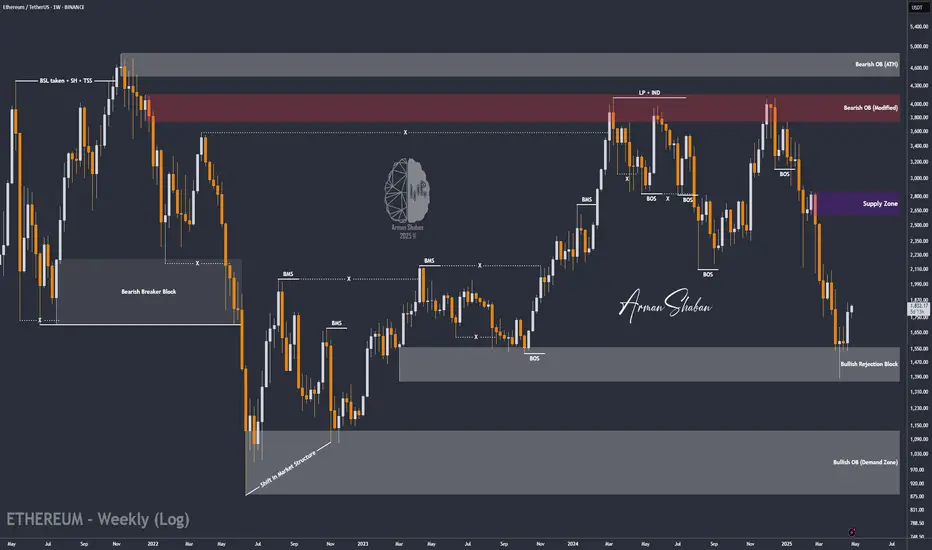
ETH/USDT : Bulls are coming back? (READ THE CAPTION)By analyzing the #Ethereum chart on the weekly (logarithmic) timeframe, we can see that after reaching the demand zone between $1400 and $1550, buying pressure increased significantly. Currently, Ethereum is trading around $1800, and I expect to see the next bullish wave soon. The potential upside targets are $1990, $2500, and $2600. This analysis will be updated accordingly!
Please support me with your likes and comments to motivate me to share more analysis with you and share your opinion about the possible trend of this chart with me !
Best Regards , Arman Shaban
$Ethereum Weekly Outlook Ethereum Weekly Outlook 🔥
CRYPTOCAP:ETH just bounced hard from the macro trendline key demand zone
- Now reclaiming the $2,350 level is a strong bullish signal.
- The next major resistance sits at $4,800.
- The path looks bullish if we hold this zone.
Accumulate smart.

Ethereum: Correction to $1,300–$1,500 and Rise to $2,500–$2,800#Ethereum Price Analysis: Correction to $1,300–$1,500 Before Potential Rise to $2,500–$2,800
Let’s break down why Ethereum (ETH) might correct to the $1,300–$1,500 range and then potentially rise to $2,500–$2,800 (with increased risk beyond that).
Technical Analysis
On the ETH/USDC 5-day timeframe chart from Coinbase, key points confirm a correction to $1,300–$1,500:
1. Correction Target: $1,300–$1,500 ("Coinbase orders")
• Limit orders were placed on Coinbase before the drop.
2. Hyperliquid Liquidation Map
• According to the Hyperliquid Liquidation Map, the liquidation level for long traders is at $1,337.00, within the target zone of $1,300–$1,500.
• A price drop to this level could trigger a cascade of liquidations, and market makers might accumulate positions at the lowest prices, specifically in the liquidation area.
3. Elliott Waves
• We’re completing the 5th wave and starting to form a reversal. This event will roughly coincide with the S&P 500’s reversal.
What Event Could Trigger the Correction?
• An expected Bitcoin correction to $70,000–$76,000 could trigger Ethereum’s drop, as the altcoin market historically follows BTC.
• I’ve previously shared this Bitcoin idea; we’re waiting for it.
Potential Targets for Ethereum Before a Global Downturn
Look for an exit point in this area: $2,500.00–$2,800.00
➖ This is approximately the 61.8% Fibonacci level
➖ A significant area according to the Volume Profile
➖ Large sell orders on Binance at $2,500, $2,800, and $3,000
➖ On Coinbase, they’re getting smarter and splitting orders into 500–600 ETH.
➡️ In Summary for Ethereum
This makes the $1,300–$1,500 range attractive for buying the dip.

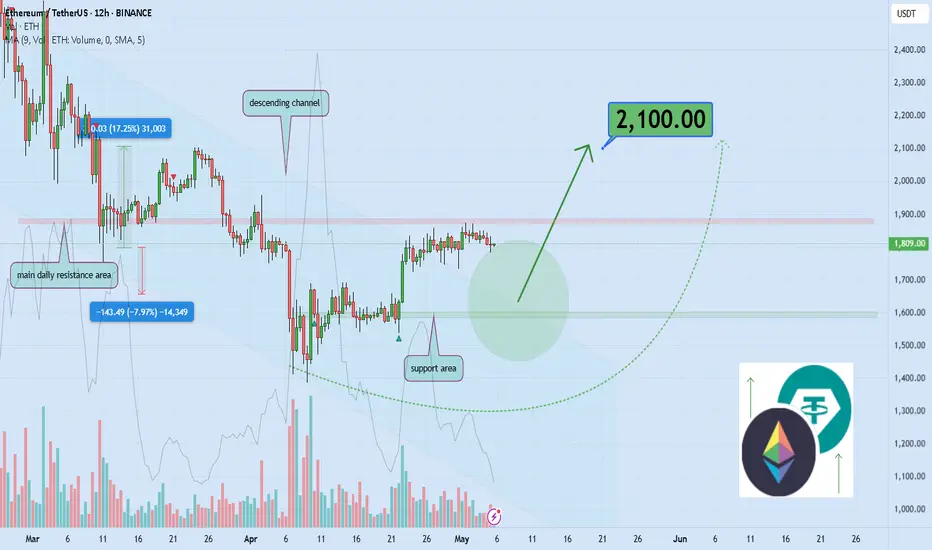
Can Ethereum Break $2,000 and Surge 16% to $2,100?Hello and greetings to all the crypto enthusiasts, ✌
All previous targets were nailed ✅! Now, let’s dive into a full analysis of the upcoming price potential for Ethereum 🔍📈.
Ethereum has recently broken out of its descending channel to the upside, indicating a potential for at least a 16% price increase. The price is approaching a key resistance zone, with the psychological \$2,000 level in sight. My primary target is \$2,100, but a retest of the channel's upper boundary is also a likely scenario. 🚀📊
🧨 Our team's main opinion is: 🧨
Ethereum broke its descending channel, targeting a 16% rise to \$2,100, with key resistance at \$2,000. 🚀
Give me some energy !!
✨We invest hours crafting valuable ideas, and your support means everything—feel free to ask questions in the comments! 😊💬
Cheers, Mad Whale. 🐋
$LINK just broke out CRYPTOCAP:LINK just broke out of its downtrend and 100-day SMA!
Bullish reversal confirmed eyes on $30 +86%.
Entry: CMP
- TP1: $18.90
- TP2: $23.50
- TP3: $29.90
Stop Loss: $14.80
Use 3–5x leverage max. DYOR, NFA.

ETHUSDT Daily : READY For Ethereum ATH Hi guys ,
So let's see if Ethereum finally gets its turn. The chart has heavy nodes for growth but I think we could see Ethereum at $4,000 again.
SecondChanceCrypto
⏰ 9/May/26
⛔️DYOR

BTC.D : READY FOR ALT-SEASONHi Guys, Hope You well
As you can see, the trend is finally breaking and the downtrend is starting again for the growth of the altcoins in the market. I hope you get the best profits from this alt season, which may be the last alt season and the best in this market cycle.
SecondChanceCrypto
⏰ 9/May/26
⛔️DYOR

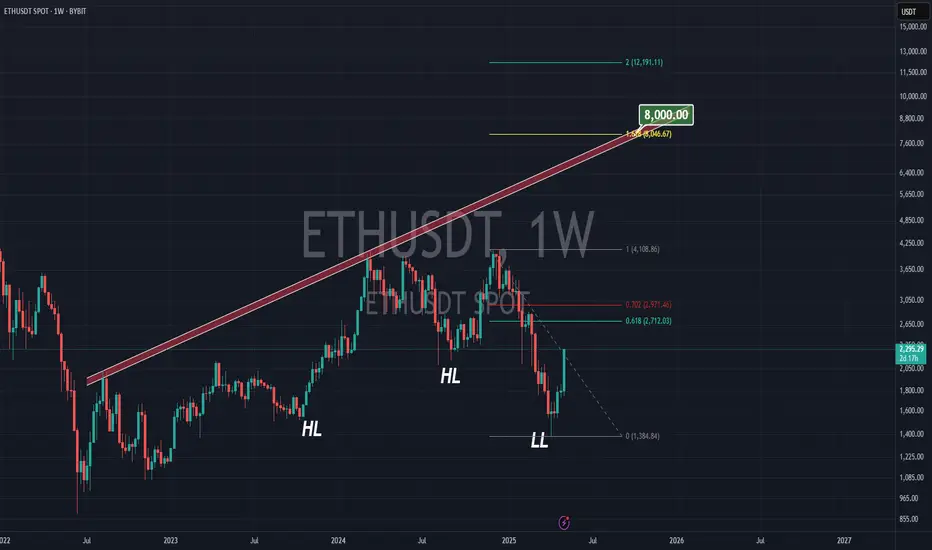
ETHEREUM TO $8000According to the previous tops we have for Ethereum on big time frames, we have a strong & long-term trend-line which gives us $7000 in summer and $8000 in October time.
On the other hand the 161.8% Fibonacci from the previous top the bottom we just saw (about $1500 ) is at $8000 .
Is this a coincident?! I don't think so
#ETH Breakout is incoming!$ETH/USDT – Breakout Watch
Ethereum is currently retesting a key descending resistance line after an extended period of consolidation. The structure suggests growing bullish momentum.
🟢 A successful breakout and daily close above the $1,900–$2,000 zone could trigger a move toward $2,200–$2,400 in the coming sessions.
Watch for confirmation with volume expansion and retest behavior. Rejection at this level could delay the move, but the pressure is clearly building.
Key Levels:
Resistance: $1,900–$2,000
Target: $2,200–$2,400
Support: $1,800
Chart looks clean breakout potential is real.
DYOR NAF
BINANCE:ETHUSDT BITSTAMP:ETHUSD

Ethereum Bear Market Over! $10,000 Before 2026 Confirmed!People were badmouthing Ethereum but look what is happening, more than 20% growth in a single day. Awesome right? But this is only the start, the last high will be reached and conquered easily, that I know for certain for sure it is true just watch.
In a previous analysis I mentioned that ETHUSDT was trading within a tight range support buy-zone, marked blue on this chart. This is also a higher low and consolidation was happening before what happened today. Bullish action confirmed. Real bullish action I should say because this action is coupled with really high volume. Confirming a very strong high in the coming weeks and days.
Here is what will happen, Ethereum will grow daily non-stop for months. Now, saying it (reading it) is one thing, experiencing will be something completely different, the market will become euphoric as everything grows.
Hundreds of billions worth of USD will be injected into the market, we already have 30 billions that came in recently but only some 10-15 billions are already in-play. This means that the whales still have 15 billion USD ready to buy, and they will continue to buy long-term. As this capital dries up, more and more players will get involved. Notice how the sentiment is still low. People know we are bullish but that is only the usual market participants, those that are part of the industry, the rest, the mass, they are not in yet. When the masses wake up, that will be very close to the top of the first bullish wave. 250 B$ coming in will change not only the Cryptocurrency market forever but also the global financial landscape.
Ethereum breaking bullish is just step one, there is more to come. Prepare for Ethereum to trade at around $10,000 before this year ends. Would you like to bet? I don't think so, we already won because we've been bullish since before 7-April, now it is time to enjoy the ride nothing more.
Adapt and change. The market always fluctuates from bullish to bearish, from bearish to sideways, from sideways to bullish and bullish the market will stay long-term.
Thank you for reading.
"Buy like it's the end of the world. —Master Ananda"
You can't go wrong when prices are low.
Thanks a lot for your continued support.
Namaste.

ETHUSDT - Will likely have 5 Digits by the end of 2025Ethereum has dropped 65% since December, hitting its bottom in April —
that’s 5 full months in a bear market with a massive drawdown, especially for the second-largest crypto by market cap.
Today, it made a strong bounce, rallying over 50% from the grey support zone,
confirming that the bottom was likely in.
Looking at the RSI, Ethereum has entered the oversold zone only 3 times in the last 5 years —
which is another strong indication that a bottom has been reached.
So what can we expect from ETH in the coming days?
- Ethereum is still close to the bottom, and RSI conditions remain healthy.
- Historically, the current RSI level has only occurred three times in five years.
Based on this:
- This bounce is likely just the beginning of a much bigger move. ETH still has a lot of upside potential.
- The next key resistance is around $2,500, which lines up with both the 200 EMA and the 0.618 Fibonacci level — keep an eye on that.
- Long-term, Ethereum is on track for a new all-time high (ATH).


$SUPRA Breakout Alert$SUPRA Breakout Alert
After months in a descending channel, SUPRA has broken out with strong volume.
Price flipped resistance into support and now targets the 0.01805 USDT level, a potential +174% move from the breakout point.
Eyes on 0.01805 📈 DYRO, NFA

Ethereum ETH price analysisThe #Ethereum network has successfully activated the #Pectra update, one of the factors that JPMorgan previously called a bullish driver for CRYPTOCAP:ETH
The update contains 11 improvements, including: support for smart contracts in wallets (simplified use and recovery, payment of fees in different tokens), an increase in the staking limit to 2048 ETH, optimization of validators and management of withdrawals through smart contracts.
All of this should make #Ethereum more convenient, scalable, and accessible.
📊 If we look at the OKX:ETHUSDT chart, I want to believe that the price will not go below $1500-1600 and this will be the “last carriage” buying zone
📈 And then - a smooth “acceleration of a heavy locomotive”, which, let's hope, will reach the $3800 “station” already in 2025.
_____________________
Did you like our analysis? Leave a comment, like, and follow to get more

ETH (Ethereum)–High-Risk, High-Reward Setup Near Fair Value GapEthereum is showing early bullish signals within a broader downtrend, and a pullback toward the $1,700 zone—where it meets the underside fair value gap and 21-day moving average—may set the stage for a higher low and potential trend reversal.
🔹 Entry Zone:
$1,700
🎯 Take Profit Levels:
🥇 $2,000
🥈 $2,200
🥉 $2,400
🛑 Stop Loss:
$1,550 (below structure and invalidation point)

ETH/USDT – Weekly Chart AnalysisETH/USDT Unique Technical Structure: Large Accumulation + Recovery Setup
This chart shows Ethereum’s price action over the past few years, highlighting key support and resistance areas. A strong visual signal (blue arrow) indicates bullish potential.
Chart Pattern Implications:
The pattern on this chart is not a classical shape (e.g., cup and handle), but it does show a Wyckoff-style accumulation phase followed by a failed breakout and reaccumulation:
Strong base formed between $1,000-$1,400
A series of lower highs and a range-bound structure after the 2022 peak
The bullish projection illustrated by the arrows shows a potential recovery towards the ATH again
This setup suggests that Ethereum is at a critical juncture – either:
It retests current support and begins a new uptrend.
Or it risks another test of the $1,400-$1,050 range before a breakout.
Risk-Reward: Current levels ($1,796) offer attractive long-term entries if you’re bullish.
Caution Zone: If ETH breaks below $1,400 with volume, $1,050 becomes the next key defense.
If you found this analysis helpful, hit the Like button and share your thoughts or questions in the comments below. Your feedback matters!
Thanks for your support!
DYOR. NFA

Breakout trading point: 1861.57
Hello, traders.
If you "Follow", you can always get new information quickly.
Please click "Boost" as well.
Have a nice day today.
-------------------------------------
(ETHUSDT 1D chart)
The 1861.57 point is the HA-Low indicator point on the 1W chart.
The key is whether it can receive support and rise around the A section, that is, 1861.57.
Since the HA-Low indicator on the 1D chart is formed at the 1647.06 point, it is important whether it can receive support and rise in the 1647.06-1861.57 section.
If it shows support in the 1647.06-1861.57 section, it is a time to buy.
-
If it falls from 1647.06, there is a possibility that a stepwise downtrend will continue, so you should also consider a response plan for this.
In the case of a decline, the Fibonacci ratio section of 0 (1190.57) ~ 0.786 (1259.39) is expected to be an important support and resistance section.
-
Since the price is located below the M-Signal indicator on the 1M chart, it is recommended to conduct trading from a day trading or short-term trading perspective.
When it breaks through the 1861.57 point, a breakout trade is possible, but as I mentioned earlier, trading requires a short and quick response.
-
If the StochRSI indicator is above the midpoint, it is recommended to focus on finding a time to sell, and if it is below the midpoint, it is recommended to focus on finding a time to buy.
When creating a trading strategy by referring to the movement of these auxiliary indicators, you must check whether there is support at the support and resistance points drawn on the 1M, 1W, and 1D charts.
-
Thank you for reading to the end.
I hope you have a successful trade.
--------------------------------------------------
- Here is an explanation of the big picture.
I used TradingView's INDEX chart to check the entire range of BTC.
I rewrote the previous chart to update it while touching the Fibonacci ratio range of 1.902 (101875.70) ~ 2 (106275.10).
(Previous BTCUSD 12M chart)
Looking at the big picture, it seems to have been maintaining an upward trend following a pattern since 2015.
In other words, it is a pattern that maintains a 3-year bull market and faces a 1-year bear market.
Accordingly, the upward trend is expected to continue until 2025.
-
(Current BTCUSD 12M chart)
Based on the currently written Fibonacci ratio, it is displayed up to 3.618 (178910.15).
It is expected that it will not fall again below the Fibonacci ratio of 0.618 (44234.54).
(BTCUSDT 12M chart)
Based on the BTCUSDT chart, I think it is around 42283.58.
-
I will explain it again with the BTCUSD chart.
The Fibonacci ratio ranges marked in the green boxes, 1.902 (101875.70) ~ 2 (106275.10) and 3 (151166.97) ~ 3.14 (157451.83), are expected to be important support and resistance ranges.
In other words, it seems likely that they will act as volume profile ranges.
Therefore, in order to break through these ranges upward, I think the point to watch is whether they can receive support and rise near the Fibonacci ratios of 1.618 (89126.41) and 2.618 (134018.28).
Therefore, the maximum rising range in 2025 is expected to be the 3 (151166.97) ~ 3.14 (157451.83) range.
In order to do that, we need to see if it is supported and rises near 2.618 (134018.28).
If it falls after the bull market in 2025, we don't know how far it will fall, but based on the previous decline, we expect it to fall by about -60% to -70%.
Therefore, if it starts to fall near the Fibonacci ratio 3.14 (157451.83), it seems likely that it will fall to around Fibonacci 0.618 (44234.54).
I will explain more details when the bear market starts.
------------------------------------------------------

Ethereum: Sell Or Hold? Panic Buy, Panic Sell or Panic Hold?If I were you in this situation, what would you do?
What would you do if you were not you in this situation?
Ethereum hit bottom on the 9th of April and the bottom is confirmed based on the same candle. It ended full green and with really high volume.
The action moved back above support on 22-April when the 3-Feb. low resistance was conquered. Ethereum now trades within a tight price range.
This range's support has been tested four times and it holds, Ethereum now trades higher but what will happen next? What would you do if I were me?
Market conditions can change in a day. Two days green, two days red it is all sideways, nothing changes and nothing has changed.
If you are still wondering if you should panic sell or panic hold right now all you have to do is panic buy because Ethereum is going up.
Ignore the short-term nothing because this chart isn't showing even noise. It is the consolidation of the higher low before additional growth.
Ethereum's chart looks very different to Bitcoin, it is incredible. Ethereum is no longer "#2" but more like an Altcoin, Bitcoin has its own chart while Ethereum has the chart of a medium sized Cryptocurrency pair. This is good, it tells us that Ethereum is about to grow really strong and will produce a new All-Time High in 2025. This All-Time High will be higher than 2021 because while this isn't Bitcoin it is still a very strong chart. Expect lower no more, panic buy followed by panic hold while you rest easy and relaxed because there is no panic when the market grows.
The only panic right now is on the short side because the bottom is in and the bears are gone.
Rest easy, do not let go of your coins. Hold strong.
Never ever use a stop-loss. Think long-term and the market will bless you with amazing results.
Namaste.

ETHEREUM New Update (1D)Price has approached a supply (flip) zone. It is not expected to break this zone on the first attempt, and bears are likely to regain control for now.
If Ethereum returns once again to the lower zones marked on the chart, it could present a low-risk opportunity for buy/long positions.
The main target can be the upper supply zone.
A daily candle closing below the invalidation level would invalidate this analysis.
Do not enter the position without capital management and stop setting
Comment if you have any questions
thank you
