ETH ANALYSIS🔮 #ETH Analysis :: Support & Resistance Trading
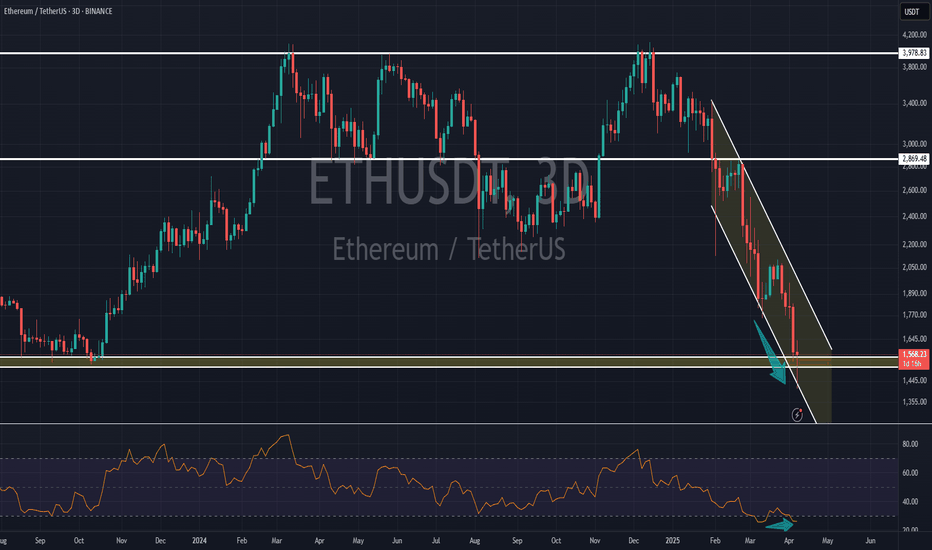
💲💲 #ETH is trading between support and resistance area. If #ETH sustains above major support area then we will a bullish move and if not then we will see more bearish move in #ETH then could expect a pullback.
💸Current Price -- $1564
⁉️ What to do?
- We have marked crucial levels in the chart . We can trade according to the chart and make some profits. 🚀💸
#ETH #Cryptocurrency #DYOR
ETHUSDT
ETH Outlook after the Dip. What to expect NOW?Finally, the price broke the wedge, and the price experienced a significant drop. I think now is the time for ETH to rise again to 1900 . STRONG SUPPORT 1400 .
Give me some energy !!
✨We spend hours finding potential opportunities and writing useful ideas, we would be happy if you support us.
Best regards CobraVanguard.💚
_ _ _ _ __ _ _ _ _ _ _ _ _ _ _ _ _ _ _ _ _ _ _ _ _ _ _ _ _ _ _ _
✅Thank you, and for more ideas, hit ❤️Like❤️ and 🌟Follow🌟!
⚠️Things can change...
The markets are always changing and even with all these signals, the market changes tend to be strong and fast!!
FXAN & Heikin Ashi Trade IdeaBINANCE:ETHUSD
In this video, I’ll be sharing my analysis of ETHUSD, using FXAN's proprietary algo indicators with my unique Heikin Ashi strategy. I’ll walk you through the reasoning behind my trade setup and highlight key areas where I’m anticipating potential opportunities.
I’m always happy to receive any feedback.
Like, share and comment! ❤️
Thank you for watching my videos! 🙏
eth buy midterm "🌟 Welcome to Golden Candle! 🌟
We're a team of 📈 passionate traders 📉 who love sharing our 🔍 technical analysis insights 🔎 with the TradingView community. 🌎
Our goal is to provide 💡 valuable perspectives 💡 on market trends and patterns, but 🚫 please note that our analyses are not intended as buy or sell recommendations. 🚫
Instead, they reflect our own 💭 personal attitudes and thoughts. 💭
Follow along and 📚 learn 📚 from our analyses! 📊💡"
Ethereum will be in the bears' control in the mid-term (1D)Based on the recent pivot formations, momentum, and wave degrees, we are observing signs of a deeper correction on the Ethereum chart, which we find necessary to warn about.
As you know, we follow technical evidence and signals to provide analysis—we do not predict the market but rather analyze it step by step.
From the point where we placed the red arrow on the chart, Ethereum's price-time correction has begun.
It appears that an ABC pattern is forming, with wave B now completed or nearing completion after losing the trendline (red dashed line).
Wave C should align with the previous waves in degree and have a longer duration than wave A.
Since wave B retraced close to the top of wave A, wave C’s price correction may not fall too far below the low of wave A.
We have two possible scenarios: either Demand 1 will be the market bottom, or Demand 2.
A daily candle closing above the invalidation level would invalidate this analysis. Let's see how it plays out.
invalidation level : 2941$
For risk management, please don't forget stop loss and capital management
When we reach the first target, save some profit and then change the stop to entry
Comment if you have any questions
Thank You
Ethereum Weekly Analysis: Double Top BreakdownHello guys!
Ethereum has formed a clear double top pattern on the weekly timeframe — a strong bearish reversal signal. The pattern is confirmed by:
🔹 A break of the ascending trendline
🔹 Strong rejection from the $3,200–$3,400 resistance zone
🔹 Current price action hovering near $1,780
🧭 Target of the double top pattern lies in the $1,350–$1,450 zone — aligned with a low-volume area on the volume profile, which could act as a magnet for price.
Key Takeaways:
If ETH fails to reclaim the $2,000 zone, more downside pressure is likely.
A bounce may occur in the target zone, providing a possible mid-term long opportunity.
📌 Stay cautious and watch for reaction zones, especially if ETH reaches the $1,400 region.
You can buy it at $1400!
Ethereum 20% Crash: Temporary Setback or a Buy Opportunity?Hello, Traders!
Ethereum experienced a significant drop, plunging over 20% in just one day and hitting its lowest point since last August.
ETH price found strong support at $2130 and I don’t expect further downfall beyond this level unless broader market conditions deteriorate.
One of the key technical developments was Ethereum breaking the crucial $2800 support zone, which is a bearish signal for the continuation of the uptrend.
However, a quick recovery above this level could reignite bullish momentum and bring buyers back into the market. W
atching how ETH reacts to this resistance will be crucial in the coming days.
The main catalyst for this sell-off was Trump’s decision to impose tariffs on Canada, Mexico, and China, which triggered a broader risk-off sentiment in global markets.
The crypto space, being highly sensitive to macroeconomic events, saw a sharp reaction, with Ethereum and other major altcoins suffering deep corrections.
Despite the current bearish outlook, there is one major reason why Ethereum is likely to recover quickly — the upcoming Pectra upgrade, set to take place next month.
Historically, ETH has seen strong rallies leading up to major network upgrades, and I expect a similar pattern to unfold this time.
If the market stabilizes and sentiment shifts, Ethereum could reclaim lost ground and resume its long-term bullish trajectory.
For now, the key levels to watch are $2130 as support and $2800 as resistance.
A break above $2800 could signal a strong reversal, while failure to hold $2130 might open the door for deeper corrections
Please don’t forget to boost this idea and leave your comments below.
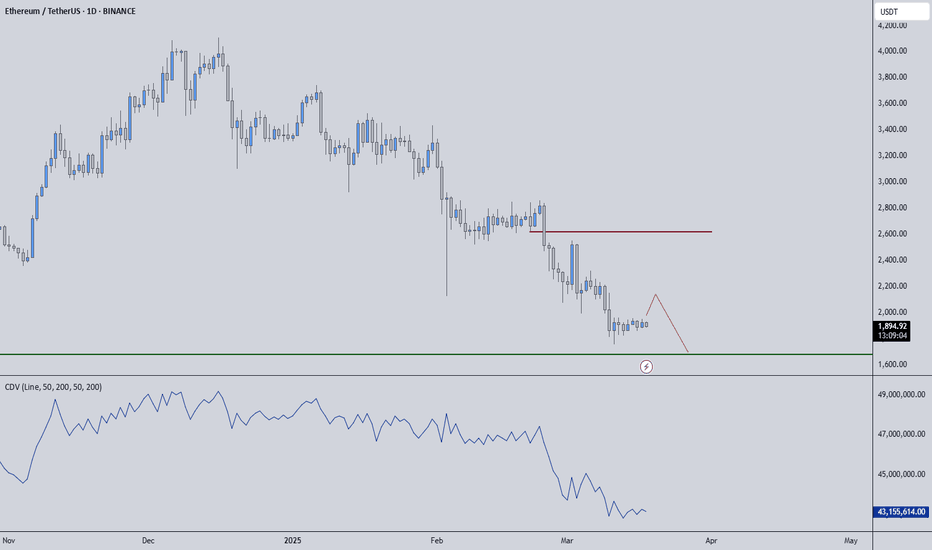
ETHUSDT – Eyes on the Green Line!ETHUSDT – Eyes on the Green Line!
“Momentum is building, and all signs point to the next key level—the green line is in play!”
🔥 Key Insights:
✅ Trend Remains Strong – No reason to fade the move.
✅ Green Line = Next Target – That’s where liquidity & reactions will matter.
✅ Pullbacks = Buying Opportunities – No FOMO, we wait for strategic entries.
💡 The Smart Plan:
Look for Dips to Load Up – Volume & CDV should confirm strength.
LTF Breakouts = Strong Entry Signals – Follow structure, not emotions.
Green Line = First Major Resistance – Expect reactions, manage risk accordingly.
“If momentum holds, Ethereum is headed straight for the green line—watch closely!” 🚀🔥
A tiny part of my runners;
💼 STMXUSDT: 2 Buying Areas
🐢 TURBOUSDT: Buy Zones and Buyer Presence
🌍 ICPUSDT.P: Massive Upside Potential | Check the Trade Update For Seeing Results
🟠 IDEXUSDT: Spot Buy Area | %26 Profit if You Trade with MSB
📌 USUALUSDT: Buyers Are Active + %70 Profit in Total
🌟 FORTHUSDT: Sniper Entry +%26 Reaction
🐳 QKCUSDT: Sniper Entry +%57 Reaction
ETH CHART: I FOUND THE BOTTOM!HERE IS MY FUNDA REASON OR NEWS WHY I THINK THIS IS THE LAST DROP~! BEFORE WE RECOVER AND START THE BUILDING OF CRYPTO!
Price Decline and Market Sentiment: Ethereum's price has dropped below $1,800, marking a significant decline of over 45% since the start of the year. This has raised concerns about its market stability, with some analysts predicting further drops to $1,550 if key resistance levels aren't reclaimed.
Investor Sentiment and FUD: Fear, uncertainty, and doubt (FUD) have led to increased selling pressure. Retail traders have been offloading ETH holdings, resulting in reduced trading volumes and network activity. Active addresses and transaction volumes have also declined, signaling lower demand!
Technical Challenges and Resistance Levels: Ethereum has struggled to break past critical resistance levels, such as $1,900. Its failure to reclaim these levels has validated bearish patterns, with some analysts warning of a potential drop to 17-month lows!
Macroeconomic Factors: Broader economic uncertainties, including geopolitical events like tariffs, have contributed to Ethereum's struggles. These factors have added to the negative sentiment in both the financial and crypto markets.
Network Activity and Whale Behavior: While some large investors (whales) are accumulating ETH, the overall network activity has seen a decline. This mixed behavior has created uncertainty about the asset's short-term trajectory
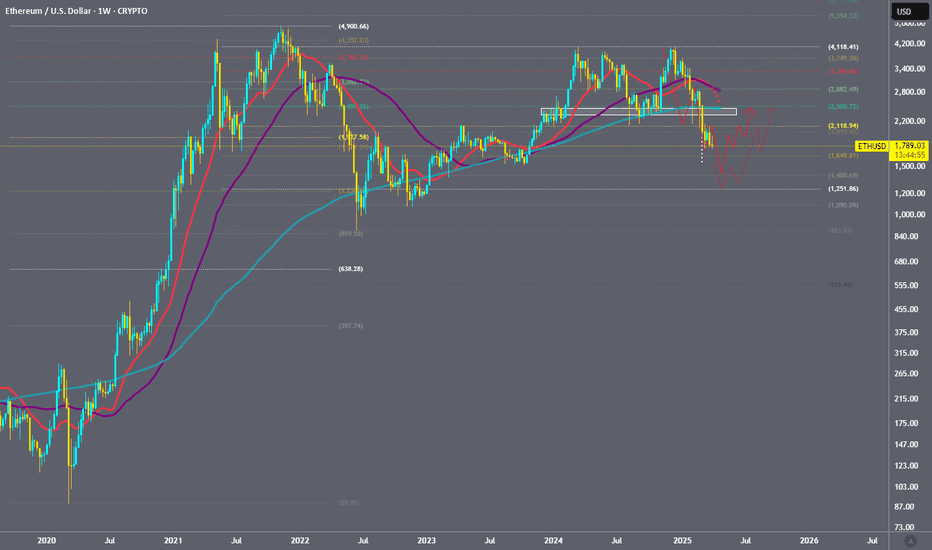
[Update ETH]: $1350-->$7000-->$800?I think we may go to retest the 0.75 level by the end of May, then blow off top very fast in Q4 to high 6000/low 7000. Then I think we gonna go slowly down <1000 until the end of this decade.
Mini bear market-> Fed will panic-pivot end of Q2 -> Final Blowoff top Q3/Q4-> Mega Recession
BTCUSDT WEEKLY : BEARMarket Will be start Hi Guys , Good day,
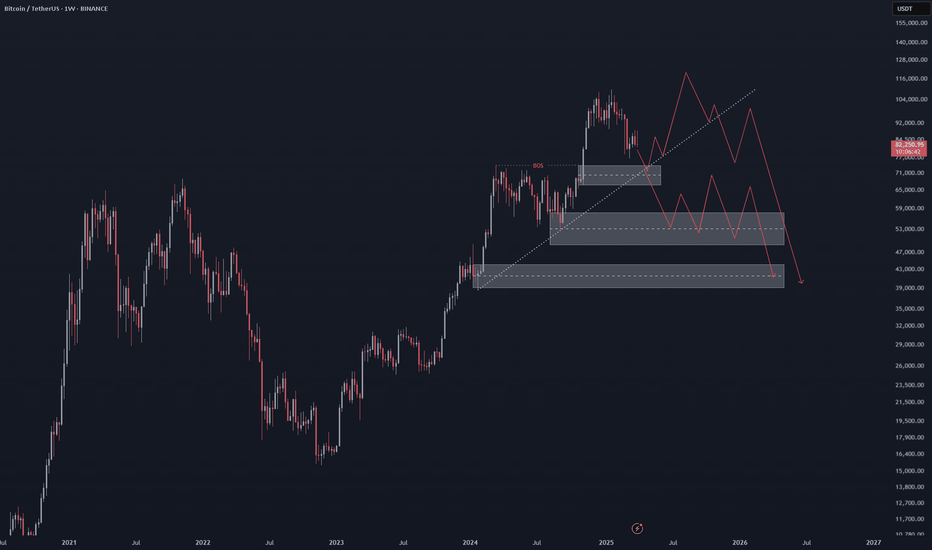
Be carefully, I think bull market is finish ,
I think the bull market may be over. Be very careful with your trades. Check the charts and see where we are at a sensitive point.
SecondChanceCrypto
⏰ 6/april/26
⛔️DYOR
Always do your research.
If you have any questions, you can write them in the comments below and I will answer them.
And please don't forget to support this idea with your likes and comments.
USDT.D Weekly : So IMPORTANT AreaHello and good timeو
Well, as I indicated on the chart, we have two very important areas. The initial box, if the price is rejected in this area, we can expect Bitcoin to be 70,000 to 74,000. However, in the event of a stock market crash and stories related to global tariffs that cause a heavy stock market crash, if the crypto market follows the fall, in the Tether dominance chart, we can reach the upper box areas, which can be said to be Bitcoin at $48,000 to $50,000. Be very careful in your trades.
SecondChanceCrypto
⏰ 6/april/26
⛔️DYOR
Always do your research.
If you have any questions, you can write them in the comments below and I will answer them.
And please don't forget to support this idea with your likes and comments.
STRAXUSDT UPDATESTRAXUSDT is a cryptocurrency trading at $0.04440, with a target price of $0.07000. This represents a potential gain of over 80%. The technical pattern observed is a Bullish Falling Wedge, indicating a possible trend reversal. This pattern suggests that the downward trend may be coming to an end. A breakout from the wedge could lead to a significant upward movement in price. The Bullish Falling Wedge is a positive indicator, signaling a potential price surge. Investors are showing optimism about STRAXUSDT's future performance. The current price may present a buying opportunity. Reaching the target price would result in substantial returns for investors. STRAXUSDT is positioned for a potential breakout and significant gains.
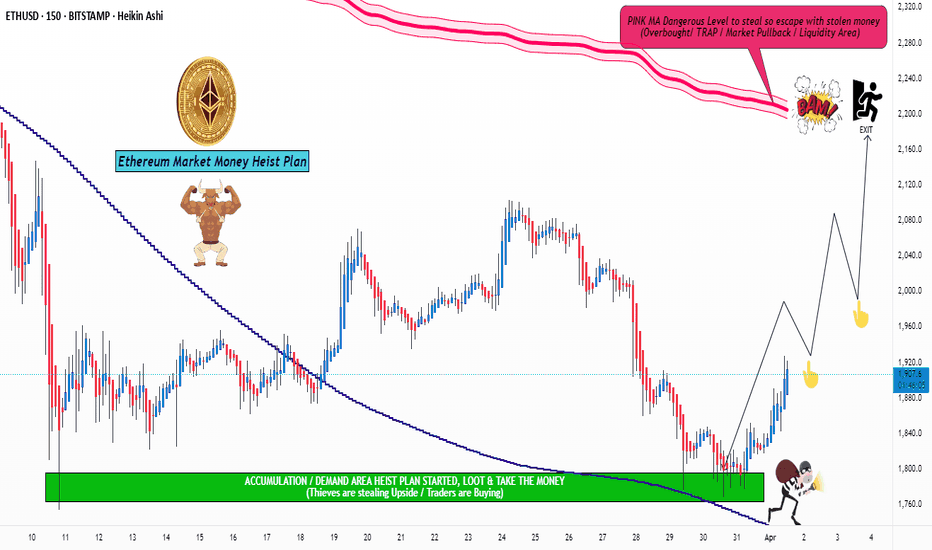
ETH/USD "Ethereum vs U.S.Dollar" Crypto Heist Plan(Swing/Day)🌟Hi! Hola! Ola! Bonjour! Hallo! Marhaba!🌟
Dear Money Makers & Thieves, 🤑 💰🐱👤✈️
Based on 🔥Thief Trading style technical and fundamental analysis🔥, here is our master plan to heist the ETH/USD "Ethereum vs U.S.Dollar" Crypto market. Please adhere to the strategy I've outlined in the chart, which emphasizes long entry. Our aim is the high-risk Red MA Level. Risky level, overbought market, consolidation, trend reversal, trap at the level where traders and bearish robbers are stronger. 🏆💸"Take profit and treat yourself, traders. You deserve it!💪🏆🎉
Entry 📈 : "The vault is wide open! Swipe the Bullish loot at any price - the heist is on!
however I advise to Place buy limit orders within a 15 or 30 minute timeframe most recent or swing, low or high level.
Stop Loss 🛑:
📌Thief SL placed at the nearest/swing low or high level Using the 1H timeframe (1800) Day/swing trade basis.
📌SL is based on your risk of the trade, lot size and how many multiple orders you have to take.
🏴☠️Target 🎯: 2200 (or) Escape Before the Target
🧲Scalpers, take note 👀 : only scalp on the Long side. If you have a lot of money, you can go straight away; if not, you can join swing traders and carry out the robbery plan. Use trailing SL to safeguard your money 💰.
ETH/USD "Ethereum vs U.S.Dollar" Crypto Market Heist Plan (Day / Swing Trade) is currently experiencing a bullishness,., driven by several key factors.👇
📰🗞️Get & Read the Fundamental, Macro, COT Report, On Chain Analysis, Sentimental Outlook, Intermarket Analysis, Future trend targets.. go ahead to check 👉👉👉🔗
⚠️Trading Alert : News Releases and Position Management 📰 🗞️ 🚫🚏
As a reminder, news releases can have a significant impact on market prices and volatility. To minimize potential losses and protect your running positions,
we recommend the following:
Avoid taking new trades during news releases
Use trailing stop-loss orders to protect your running positions and lock in profits
💖Supporting our robbery plan 💥Hit the Boost Button💥 will enable us to effortlessly make and steal money 💰💵. Boost the strength of our robbery team. Every day in this market make money with ease by using the Thief Trading Style.🏆💪🤝❤️🎉🚀
I'll see you soon with another heist plan, so stay tuned 🤑🐱👤🤗🤩
ETH Ready for PUMP or what ?Do you think this will happen, or do you see ETH below $1750 in the future?
Give me some energy !!
✨We spend hours finding potential opportunities and writing useful ideas, we would be happy if you support us.
Best regards CobraVanguard.💚
_ _ _ _ __ _ _ _ _ _ _ _ _ _ _ _ _ _ _ _ _ _ _ _ _ _ _ _ _ _ _ _
✅Thank you, and for more ideas, hit ❤️Like❤️ and 🌟Follow🌟!
⚠️Things can change...
The markets are always changing and even with all these signals, the market changes tend to be strong and fast!!
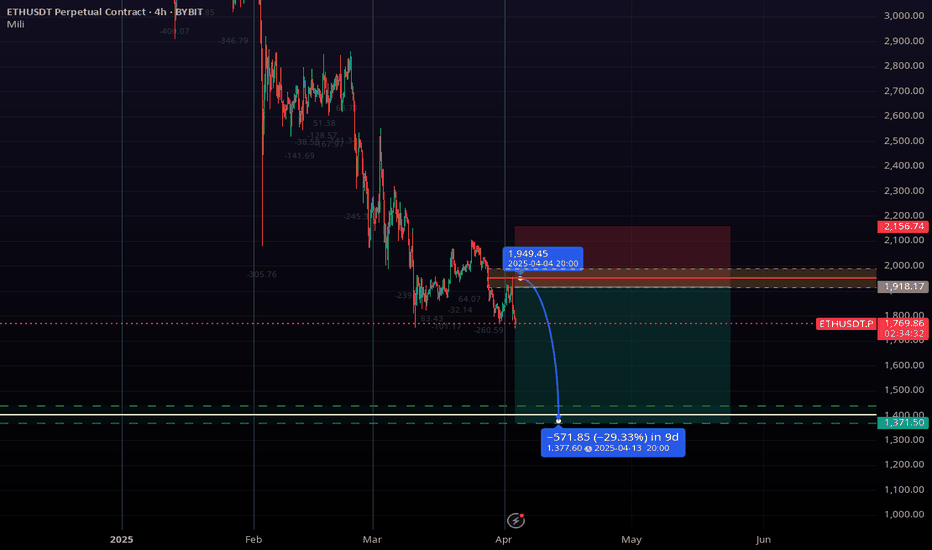
Ethereum TA 25.4.5Hello everyone, I hope you are doing well. Ethereum on the 4-hour timeframe got rejected after hitting a strong order block and started forming new lows. Given the current chart conditions, we have two order blocks in the high price area and we expect the price to return to these levels. If we see a short setup, we will enter a short position with a target of 1750. For now, I am not suggesting a long position and will wait until the pullback on the chart is complete.
⚠️ This Analysis will be updated ...
👤 Sadegh Ahmadi: GPTradersHub
📅 25.Apr.5
⚠️(DYOR)
❤️ If you apperciate my work , Please like and comment , It Keeps me motivated to do better
Bitcoin TA 25.4.5Hello friends, I hope you are doing well. In this daily timeframe, we have an order block that has caused a price level to break. Inside this daily order block, there is a hidden order block that can be observed in the 4-hour timeframe, which has the potential to push the price down to $74,000. We are waiting for the price to reach this order block as indicated in the chart, and then we will look for a trigger in the 15-minute and 5-minute timeframes to set up a short position with a target of $74,000. This is my roadmap. If there are any changes, I will definitely inform you.
⚠️ This Analysis will be updated ...
👤 Sadegh Ahmadi: @GPTradersHub
📅 25.Apr.5
⚠️(DYOR)
❤️ If you apperciate my work , Please like and comment , It Keeps me motivated to do better
#ETH #ETHUSDT #ETHEREUM #LONG #SWING #Analysis #Setup #Eddy#ETH #ETHUSDT #ETHEREUM #LONG #SWING #Analysis #Setup #Eddy
ETHUSDT.P Swing Long Analysis & Setup
Important area of the upper time frame for swing are identified and named.
This setup is based on a combination of different styles, including the volume style with the ict style.
Based on your strategy and style, get the necessary confirmations for this Swing Setup to enter the trade.
Don't forget risk and capital management.
The entry point, take profit point, and stop loss point are indicated on the chart along with their amounts.
The responsibility for the transaction is yours and I have no responsibility for not observing your risk and capital management.
🗒 Note: The price can go much higher than the second target, and there is a possibility of a 500% pump on this currency. By observing risk and capital management, obtaining the necessary approvals, and saving profits in the targets, you can keep it for the pump.
⚠️ Warning : The stop loss is dramatic and large. Place the stop loss based on your strategy and after getting entry and confirmation on the entry point behind the last shadow that will be created. (( This is just my opinion and is not meant to be 100% correct, so be careful with your capital. ))
Spot Investing : ((long 'buy' position)) :
🟢 Entry 1 : 1800
🟢 Entry 2 : 1500
First entry point calculations :
⚪️ SL : 1370 ((23.89%))
⚫️ TP1 : 4500 ((150%))
⚫️ TP2 : 5000 ((177.78%))
⚫️ TP3 : 8000 ((344.44%))
⚫️ TP4 : 10000 ((455.56%))
‼️ Futures Trading Suggested Leverages : 3-5-7
The World Let it be Remembered...
Dr. #Eddy Sunshine
4/4/2025
Be successful and profitable.
Do you remember my first Ethereum swing long signal?
My first swing long signal was provided on Ethereum, which was spot pumped by more than 100% and was profitable :
Ethereum Price Analysis: Is a Drop to $1,550 Imminent This Week?As of April 3, 2025, Ethereum (ETH) is trading at approximately $1,838 (based on recent market data), reflecting a precarious position in the crypto market. After a volatile start to the year, ETH has shed over 44% year-to-date and is now testing critical support levels. This analysis explores the potential for an 11% drop to the $1,550 range within the next few days (by the end of this week, April 6), driven by technical breakdowns, bearish on-chain signals, and broader market pressures.
Technical Analysis: Bearish Signals Mounting
On the daily chart, ETH has been struggling to maintain momentum above the $1,800 psychological level. After a brief bounce from its yearly low of $1,760 on March 11, the price has failed to reclaim the $2,000 mark—a key resistance zone that previously acted as support in late 2024. Here’s a breakdown of the technical setup:
Key Support Breach: The $1,800–$1,877 range has been a critical support zone, aligning with the 61.8% Fibonacci retracement level from the December 2024 high of $4,106 to the March 2025 low of $1,759. A close below $1,770 this week would confirm a breakdown, opening the door to the next major support at $1,550–$1,600, a level last tested in October 2023.
Bearish Pattern Confirmation: The 2-hour chart shows ETH completing a corrective structure (likely an A-B-C wave) after its March 19 peak at $2,070. If wave C mirrors wave A in length—a common Elliott Wave scenario—the target aligns near $1,550, coinciding with the 1.61 external Fibonacci retracement of the recent bounce.
Moving Averages: ETH is trading below both its 50-day SMA ($2,321) and 200-day SMA ($3,010), signaling a sustained bearish trend. The 50-day SMA, now sloping downward, acts as dynamic resistance, capping any relief rallies. A failure to reclaim this level soon reinforces the downside risk.
RSI Oversold but Weak : The 14-day Relative Strength Index (RSI) sits near 30, indicating oversold conditions. However, in strong downtrends, RSI can remain oversold for extended periods, as seen during ETH’s 2022 bear market. Momentum remains weak, with no bullish divergence to suggest an imminent reversal.
Target Projection : A drop from $1,838 to $1,550 represents an 11% decline, achievable within 2–3 days if selling pressure accelerates. The $1,550 level aligns with historical support and the long-term 78.6% Fibonacci retracement, making it a plausible target.
On-Chain Data: Selling Pressure Intensifies
On-chain metrics paint a grim picture, supporting the bearish technical outlook:
Exchange Reserves Rising: Ethereum’s exchange reserve has ticked up from 18.3 million ETH, reversing a multi-month decline. This suggests long-term holders or institutions are moving assets from cold storage to exchanges, potentially preparing to sell.
Whale Activity: Recent data shows significant whale sell-offs, with large transactions (over 100 ETH) spiking in the past 48 hours. This aligns with posts on X noting whale distribution near current levels, adding downward pressure.
DeFi Weakness: Ethereum’s dominance in decentralized finance (DeFi) is waning, with total value locked (TVL) dropping as competing Layer-1 chains gain traction. Reduced network activity undermines ETH’s utility-driven demand, a key pillar of its value proposition.
Staking Dynamics: While staking activity increased post-Shapella upgrade, the anticipated selling pressure from unstaked ETH continues to linger, especially as macroeconomic uncertainty prompts profit-taking.
Market Sentiment: Fear Dominates
The broader crypto market is reeling from macroeconomic headwinds. The U.S. Core PCE Index rose to 2.8% in February, exceeding the Federal Reserve’s 2% target, signaling persistent inflation. Higher interest rates for longer dampen risk-on assets like cryptocurrencies. Posts on X reflect growing pessimism, with some traders eyeing sub-$1,000 levels if $1,760 fails—a sentiment echoed by Ethereum’s 7% drop this week alone.
Bitcoin (BTC), trading near $82,000, has also faltered, dragging altcoins lower. ETH’s correlation with BTC remains high (around 0.9), and a failure to hold $80,000 for BTC could amplify ETH’s decline. Additionally, the lack of immediate catalysts—such as ETF approvals or major network upgrades—leaves ETH vulnerable to further capitulation.
Price Scenarios and Key Levels
Bearish Case (Base Scenario): A daily close below $1,770 triggers a swift move to $1,550–$1,600 by April 6. Volume spikes and panic selling could push it lower, though $1,550 offers strong historical support.
Bullish Rejection: A reclaim of $2,070 (the March 19 high) invalidates the bearish setup, potentially sparking a relief rally to $2,250. This seems unlikely without a significant BTC breakout or positive news.
Invalidation: A close above $2,120 this week would negate the short-term bearish thesis, though resistance at the 50-day SMA ($2,321) caps upside potential.
Trading Strategy
Entry: Short ETH below $1,770 with confirmation of increased volume.
Target: $1,550 (11% drop), with a stretch goal of $1,500 if momentum persists.
Stop Loss: $1,911 (intraday high from April 2), limiting risk to 4–5%.
Risk/Reward: Approximately 2.5:1, assuming a $1,550 target.
Conclusion
Ethereum’s technical setup, coupled with bearish on-chain signals and a fearful market, suggests an 11% drop to $1,550 is plausible by the end of this week (April 6, 2025). The $1,770 level is the line in the sand—watch it closely. While oversold conditions hint at a potential bounce, the lack of buying conviction and macro pressures tilt the odds toward further downside. Traders should monitor BTC’s price action and exchange inflows for confirmation. Stay nimble, and let the charts guide your next move.
Ethereum Elliot Wave Theory: $19,000 & Altcoins Market UpdateThe market is shaking but nothing truly changes. Ethereum is on a path that will end with a price above $10,000 USD. Ether (ETHUSDT) can easily trade at $11,111, $15,000 or even $19,000 in the latter part of 2025. Think about the market conditions and sentiment when Ether trades above 10K. Take a moment to think. Visualize. What do you see, hear, sense or feel?
The low was set March 10. Ethereum has been bearish since March 2024.
11-March 2024 was the main and first peak.
10-March 2025 was the main bottom and low.
An entire year of bearish action. The market never moves straight down nor straight up. The bullish action in late 2024 is part of a complex correction. It can be called an inverted correction within a long-term correction.
The last bear-market ended with a bottom being hit June 2022. This was followed by slow but steady growth; bullish consolidation. Prices were sideways but producing higher lows. Then a bullish wave developed to end 2023 and went through March 2024. March 2024 marked the end of this cycle and the start of a major, long-term complex correction. This correction ended last month. The end of the correction marks the start of the next bull-market cycle. The 2025 bull-market. This bull-market is not yet fully obvious but it will be clear within less than 2 months. There will be growth but for the majority of the participants to realize that yes, it is happening, it will take even longer.
Altcoins Market In General
Some projects bottomed in February, others in March. Most of them ended their correction in February 2025, there are always variations. This low is a long-term higher low. Many projects bottomed in late 2024. After a strong rise to end the year, we had a correction and this puts us in the current situation. Once the correction ends (already over) a new bullish impulse starts. The bullish impulse is composed of five waves. Three moves forward with two steps back.
➢ The first wave is up and green. Wave 1.
➢ The second wave is down and red. Wave 2.
➢ The third wave is the biggest wave. This wave tends to produce the highest volume and lots of momentum. Up and green. Wave 3.
➢ The fourth wave will be down and red and it will alternate the second wave. For example, if the second wave is long in duration, the fourth wave will be short. If the second wave is fast, the fourth wave will be slow. Etc. Wave 4.
➢ The fifth wave signals the end of the bullish impulse and this is the speculative wave. This is where anything is possible. Anything can happen within this wave. Trading volume will be lower compared to the third wave but new All-Time Highs are hit here and after this wave is over, the start of a new long-term correction or bear-market. Wave 5.
This is the map based on Elliot Wave Theory terminology. Everything is looking ready right now.
Signals are starting to show pointing to the start of major growth. What one does, the rest follows. Look at EOS. I just shared an article. Visit my profile and read it for a simple and quick example.
Don't be surprised when Ethereum trades above $10,000. Be prepared.
Take profits when prices are high and up.
The time to buy is now. Focus on the long-term.
Thanks a lot for your continued support.
Namaste.


