eth buy longterm"🌟 Welcome to Golden Candle! 🌟
We're a team of 📈 passionate traders 📉 who love sharing our 🔍 technical analysis insights 🔎 with the TradingView community. 🌎
Our goal is to provide 💡 valuable perspectives 💡 on market trends and patterns, but 🚫 please note that our analyses are not intended as buy or sell recommendations. 🚫
Instead, they reflect our own 💭 personal attitudes and thoughts. 💭
Follow along and 📚 learn 📚 from our analyses! 📊💡"
ETHUSDT

LINK START...Hello friends🙌
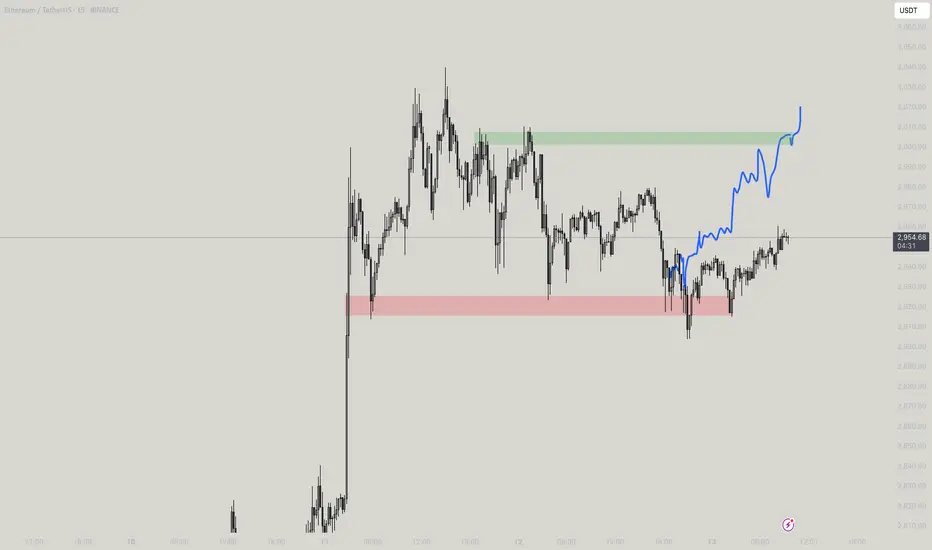
📈As you can see, the upward trend has started, and the power is in the hands of buyers, and here we have an opportunity to enter a buy trade with risk and capital management to move with the specified goals.
🔥Follow us for more signals🔥
*Trade safely with us*

ETH/USDTETH is showing a similar structure to BTC, with a visible gap in play. A partial or full fill of the gap, followed by a bullish structure break on lower timeframes, would be a strong signal of buyer strength.
Waiting for confirmation before acting.
$ETH Pullback to $2630 Support?CRYPTOCAP:ETH has a great week pushing through resistance and making new local highs after testing the daily 200EMA and daily pivot as support.
Price is likely to retest the swing high and previous resistance as support around $2600-2700, also the .382 Fibonacci retracement.
RSI is printing daily bearish divergence in overbought from the wave (3) top to current as it did at the wave (5) top seeing large rejection. The retest of $2600 would reset RSI.
Price is ultimately set to test $3600 as the next resistance if the Elliot wave count is correct.
Analysis is invalidated below $2050
Safe trading

ETH - Can it go $3200??Yes looks good until stays above 2890, all buys are good in this range as scalps! AWESOME aint it?
Is ETH overextended and due for a correction?For those holding ETH, this is a good point to set up a hedge using derivatives.
If the price keeps going up (which I think is unlikely at this moment—perhaps it will move sideways), buying at these levels is crazy.
In fact, there’s been a recent rally, full of people on X and YouTube saying this is the big moment to buy… That immediately raises a red flag for me!
And what about the FEDFUNDS? Have you taken a look? Haha, just something to think about.
--
After a long time away from TradingView and the community, I’m back to breathe some life into it!
Missed you all — let’s enjoy life and make the most of what it has to offer!
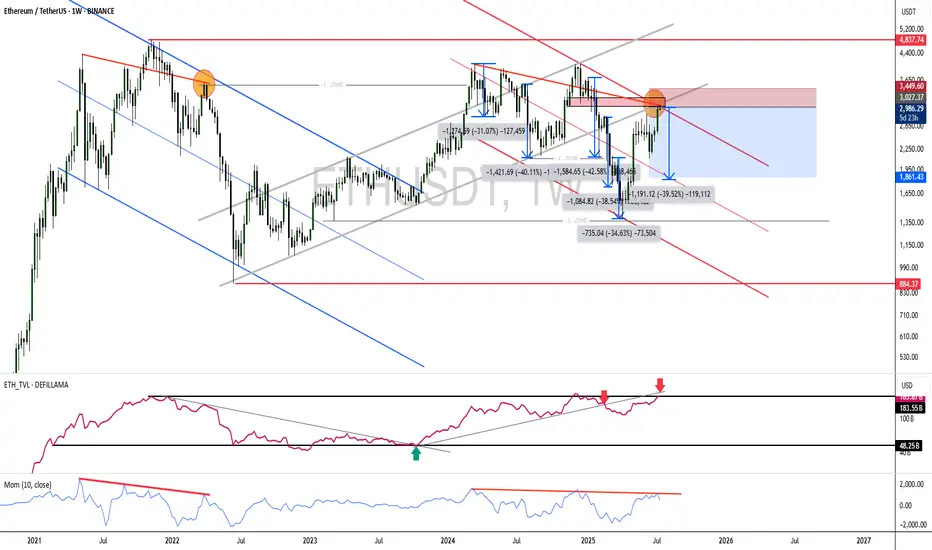
Can a Bear Market Start With Ethereum At $3,000?Ethereum produced sideways action for 49 days, 7 weeks. Immediately after seeing this I realized the next logical step was a bullish breakout, and the market moved up. But this isn't all. Ethereum is still trading at $3,000, more than $1,800 away from its all-time high.
Now, thinking about the doubt that always creeps up when the market becomes bullish confirmed, I want to clear things up if at least for you. While others can continue to doubt and will continue to do so, many others will even SHORT and lose everything, you will be happy knowing that the market will experience additional growth. You will also be making profits as the market grows. You will be happy because you know for a fact, based on data, that we are set to experience sustained long-term growth.
A bear market can only develop after a bull market. A bull market ends in a major high or new all-time high. Current conditions for ETHUSDT are far from being "peaky." There is no new all-time high. Actually, prices are still relatively low.
First Ethereum needs to challenge its previous all-time high, create a new one and then we can talk about a bear market or correction. We know for a fact that Ethereum is bullish based on recent price action and the chart. We know for a fact that Ethereum will grow because Bitcoin is already high up. Ethereum is the #2 Crypto and what Bitcoin does it tends to follow.
Bitcoin is super strong but this is not to be confused as weakness. Weakness comes when the market has been growing for too long, growth becomes heavy and a drop happens next. Strength happens when the market has been sideways for months, breaks up and produces a major advance (now). This type of pattern predicts additional growth.
Bitcoin is the king and what Bitcoin does the rest follows. You can expect additional growth.
The reason why the bullish cycle is not yet over is because prices are still too low. Many altcoins are trading near all-time lows. Think about it. A bear market develops from all-time highs and bull markets develop from all-time lows. We are only at the start of a major bullish cycle, phase and wave.
The proof is in the chart. A major low was hit 7-April 2025, the lowest since March 2023. This marks the end of the correction and the start of the 2025 bullish phase. I don't know if Ethereum will grow for years or only for a few months. I know with 100% certainty that the Cryptocurrency market will continue to grow. You can bet your house on it.
Thanks a lot for your continued support.
Namaste.

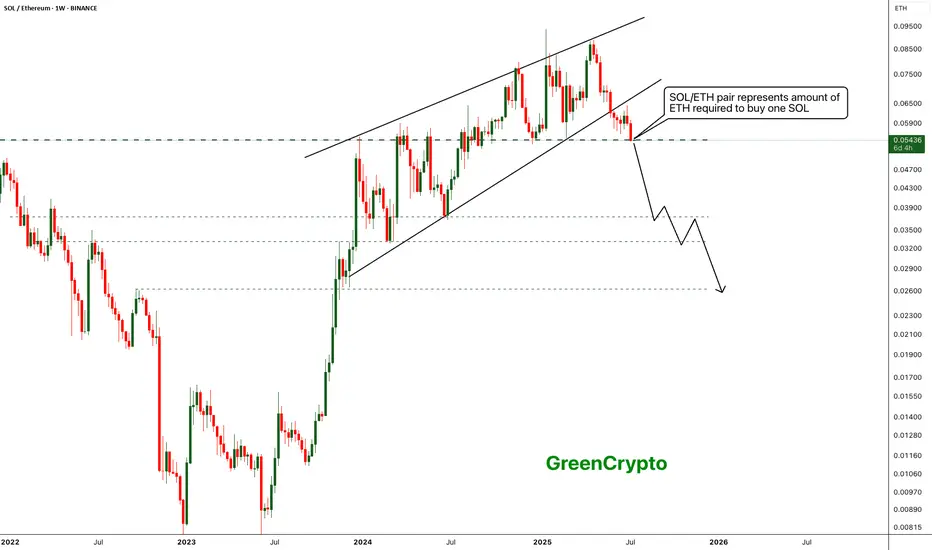
Ethereum is outshining Solona- Ethereum is finally outshining Solona
- ETH/SOL pair has broke down from the raising wedge pattern indicating clear bearish sentiment
- with the current bearish trend, we can expect the SOL/ETH pair to drop further down to 0.02630 range..
- This is clear sign the holder are preferring ETH or SOL
Stay tuned for more updates
Cheers
GreenCrypto
ETH - Confirmed target is 4100- After successfully breakout from the major resistance price is heading towards the next resistance line.
- From the previous all time high, we have a clear resistance around 4100 range.
- We can expect this bullish trend to continue easily and reach the next resistance around 4100.
Stay tuned for more updates
Cheers
GreenCrypto

#ETHUSDT: Time For Big Price Distribution! Get Ready $5000ETH is currently in distribution and is on our target list. We expect a smooth price movement, potentially reaching $3100, $3800, and $5000. Use the entry zone to take a position; anything below the entry will invalidate the idea. Please use accurate risk management while trading.
Like, comment, and share this idea to encourage us to post more.
Team Setupsfx_

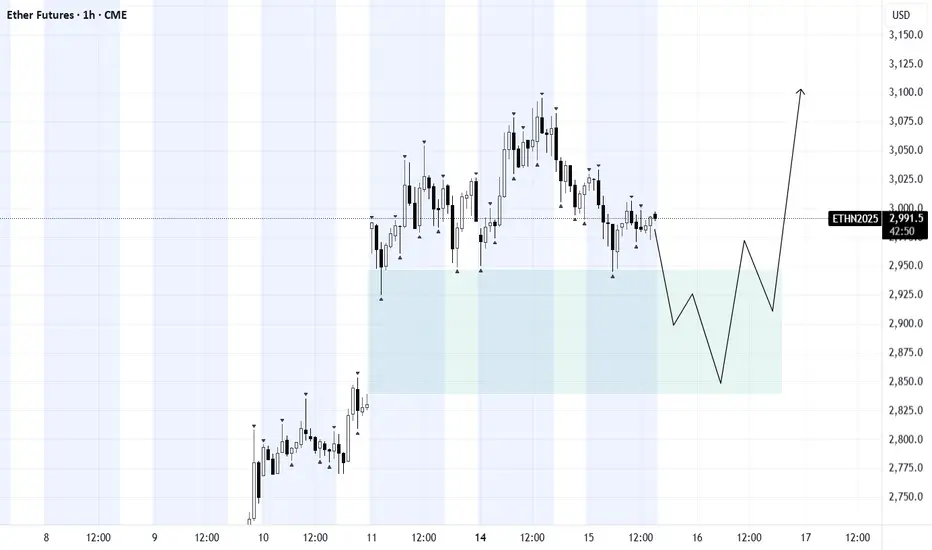
#ETHUSDT: Currently On The Way Towards Filling The FVG?ETCUSDT is currently experiencing a significant correction as the price approaches a pivotal juncture where a substantial bullish price reversal is anticipated, potentially propelling it to new all-time highs or even surpassing them. It is imperative to exercise meticulous risk management and conduct your own thorough analysis before engaging in any cryptocurrency trading or investment activities.
Should the price indeed undergo a major correction, it is likely to decline to our second designated area, where it is anticipated to fill the liquidity gap and subsequently reverse course, continuing its trajectory towards our established targets.
Please consider this analysis as a secondary influence only, or even solely for educational purposes. It is crucial to conduct your own independent analysis and risk management prior to engaging in any cryptocurrency trading or investment endeavours, as they inherently carry substantial financial risks.
We extend our best wishes and encourage you to trade safely and responsibly.
Should you wish to demonstrate your support, you are welcome to express your appreciation through likes, comments, or sharing this information.
Thank you for your consideration.
Have a pleasant weekend.
Team Setupsfx_

ETH's Situation, A Comprehensive Analysis !!!As I said, and no one believed, the cup and handle pattern has completed and broken out, which could quickly drive the price above $4000.
previous Analysis
Best regards CobraVanguard.💚

YET AGAIN!! ~~ ETH to $3200!!My shitposting 3 times for eth because it happens!! It happenss! ITT HAPPENS!!! I said it

Resistance zone: 3265.0-3321.30
Hello, traders.
If you "Follow", you can always get the latest information quickly.
Have a nice day today.
-------------------------------------
(ETHUSDT 1D chart)
It is showing an upward breakout of the important zone of 2419.83-2706.15.
We need to see if the price can be maintained by rising above the Fibonacci ratio of 0.5 (2788.93).
If so, it is expected to rise to the resistance zone of 3265.0-3321.30.
The important zone of 2419.83-2706.15 is the support and resistance zone that can lead to a full-fledged uptrend.
Therefore, if it falls below this zone, we should stop trading and watch the situation.
-
Thank you for reading to the end.
I hope you have a successful trade.
--------------------------------------------------
- This is an explanation of the big picture.
(3-year bull market, 1-year bear market pattern)
I will explain more details when the bear market starts.
------------------------------------------------------

Will Ethereum reach 15K soon?In my video I share why is it possible for Eth to reach 14-17K in the next months.
Disclaimer: Not a financial advice

ETH/USD Setup | Thief Trading Blueprint for Profit.🔥🚨THE ETHEREUM HEIST PLAN: Thief-Style Trading Blueprint for Maximum Gains🚨🔥
💰Thief Mode: Activated | Time to Rob the Bulls 💰
📢🌍 Hello Money Makers, Crypto Crooks & Chart-Breaking Bandits! 🐱👤🤑💸
Welcome to the “Thief Trading Style” breakdown — a high-stakes, high-reward crypto market blueprint built on deep technical & fundamental intel. This isn’t your average strategy… it’s a full-blown heist on the ETH/USD market!
🧠 THE MASTER PLAN (ETH/USD – Day & Swing Trade)
🔎 Based on our Thief Mode analysis — blending market sentiment, trend psychology, and price action — Ethereum is ripe for a bullish robbery. We’re setting up shop at high-risk liquidity traps and targeting bearish overconfidence.
💥ENTRY STRATEGY – "The Vault Is Open, Time to Strike!" 💥
🟢 Go Long:
Swipe in on bullish momentum.
🕒 Set Buy Limit Orders at key pullback zones (swing highs/lows from 15m or 30m timeframes).
💼 Use DCA (Layered Orders) for multiple precision entries. The more layers, the stronger the loot stack.
🛑STOP LOSS – "Thief Rule: Don’t Get Caught"
📍Place SLs at logical swing highs/lows using the 1H timeframe
💡 Adjust according to lot size & how many entries you're stacking
Risk smart, steal smarter!
🎯TARGET – "Make the Escape at 2850.0 or Jump Early if Cops Close In!"
📌Set TP at 2960.0, or
📌Exit early if the market starts turning shady (exit before reversal signs appear)
⚔️SCALPER'S CODE – "Fast Hands Only!"
🧲Only scalp Long-side plays
🧠Use trailing SLs to protect stolen profits
💼Big wallets? Front-run the move
🪙Smaller bags? Team up with swing traders and follow the blueprint.
🚨MARKET CONTEXT – Why This Heist is Bulletproof
💥ETH/USD is showing bullish energy due to:
Macro & Fundamental Drivers
On-Chain Metrics showing accumulation
Sentiment Analysis leaning toward over-leveraged bears
Intermarket Correlation signaling rotation into altcoins
🔗Stay sharp, keep updated with: COT Reports, Macro Calendar, Crypto News Feeds
⚠️NEWS RELEASE WARNING – "Robbers Hate Surprises"
📛Avoid new entries during major news releases
📈Use Trailing Stop Losses to lock in profits
⛔Don’t leave positions unmanaged during volatility spikes
💖LOVE THE PLAN? THEN BOOST THE GANG!
🎯Tap the 🔥 Boost Button 🔥 and show support for the Thief Trading Style!
The more boosts, the more plans drop — let’s build a community of smart traders robbing the market legally (😉).
✍️DISCLAIMERS
📌This analysis is for educational purposes only — not financial advice.
📌Always trade within your own risk management rules.
📌Market conditions change fast — adapt, evolve, and don’t trade blindfolded.
🚀Stick around for more blueprints — the next heist is always just around the corner.
Until then… Lock. Load. Loot. 🐱👤🤑💰

ETH/USD ROBBERY IN PROGRESS! Long Now, Exit Before Bears Attack!🚨 ETH/USD HEIST ALERT: Bullish Loot Before the Trap! 🚨
Thief Trading Style: Steal Profits & Escape Before the Cops Arrive!
🌟 Greetings, Market Pirates & Profit Bandits! 🌟
(Hola! Oi! Bonjour! Hallo! Marhaba!)
🔥 The Ethereum vault is WIDE OPEN! Time to execute the Thief Trading Strategy—bullish momentum is primed for a heist. Long entries only! Target the highs, then vanish before the overbought trap snaps shut.
🔑 Heist Plan (Day/Swing Trade)
🎯 Entry: "The vault is unguarded—swipe bullish loot at any price!"
Pro Tip: Use buy limits within 15-30min for pullback entries (recent swing lows/highs).
🛑 Stop Loss:
Thief SL (4H): 2240.0 (Nearest swing low)
Adjust SL based on risk, lot size & multiple orders.
🏴☠️ Target: 2800.0 (or escape earlier if bears ambush!)
⚡ Scalpers’ Quick Loot:
Only scalp LONG!
Big wallets? Charge in! Small wallets? Join swing traders & rob smart.
Trailing SL = Your Escape Rope!
📢 Why Ethereum?
🐂 Bullish momentum + strong fundamentals = Perfect heist conditions!
(Check COT reports, macro trends & sentiment— check 👉🔗!)
⚠️ WARNING: Cops (Bears) Are Setting Traps!
Avoid fresh trades during news!
Trailing SL = Lock profits & run!
💥 BOOST THIS HEIST!
🔥 More boosts = Faster profits!
🚀 Daily robberies = Easy money!
Stay tuned—next heist coming soon! 🤑💎 (Like & Follow for more loot!)

$ETH - Scalps to Victory ~ 3011Scalps of eth which is missed and going to $3011 but it already moved from the point of movement! Touching soon!
You Seek Profit, they seek you !who?Every time you think the market’s about to crash, it pumps.
And when you’re sure it’s time to enter, it dumps.
Maybe it’s time to ask a serious question: Who’s really hunting whom?
Hello✌
Spend 3 minutes ⏰ reading this educational material.
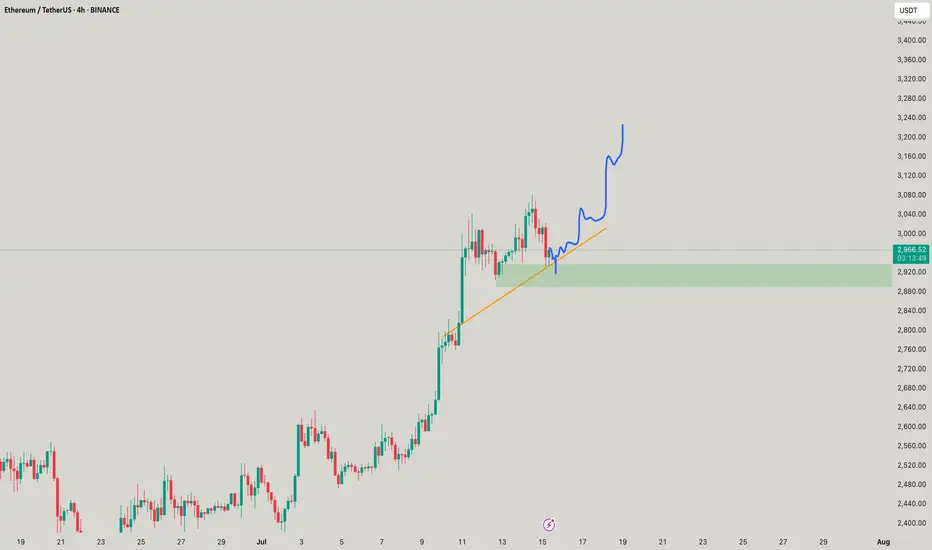
🎯 Analytical Insight on Ethereum:
As noted earlier, after several days of sideways action, BINANCE:ETHUSDT has confidently broken above its parallel channel. 🚀 This breakout sets the stage for a potential gain of at least 10%, targeting around 3200. There is also a chance for a retest of the channel’s upper boundary before continuing higher. 🔄
Now, let's dive into the educational section,
🎯 The Modern Market Hunters
Markets today aren’t simple anymore. Behind every candle lies a strategy, an algorithm designed for one thing:
Profiting from your fear and greed.
In crypto, liquidations have turned from a mere term to a deadly tactic. When you enter a position, exchanges know exactly where your stops are. Often, price moves are designed to trigger liquidations of traders like you.
🛠 TradingView’s Tools to Spot the Traps
In a market where hunters are always one step ahead, TradingView’s default tools can be your secret weapon. You just need to know where and what to check:
Volume Profile (Range & Fixed): Shows where real money volume has entered, not just pretty candles.
Liquidity Zones Indicators: Pinpoints exact areas where stops cluster the prime hunting grounds.
Order Block Detection Scripts: Marks zones where whales place heavy orders, always moving against retail trader sentiment.
Set these tools on 1H to 4H timeframes and focus on overlapping areas. This way, you can spot traps before they activate, not after.
🔬 How Are Traps Actually Set?
Markets first build a nice trend, making everyone FOMO in. Then, a sudden shadowy candle crashes the party.
This is called a liquidity sweep or stop hunt.
Signs are clear:
Sudden volume spikes
Positions quickly flipping to profit or loss
Long shadows on candles signaling stop grabs
This is exactly where Open Interest and Liquidity Maps come in handy. They reveal the hunting map before your eyes.
🧠 Your Mind Is The Biggest Liquidity Map
The biggest traps are built inside traders’ minds. When the market moves against you, you panic and set stops.
But that’s exactly the lesson market makers want you to learn: don’t react emotionally.
Instead, a pro trader uses others’ behaviors as cues before market moves.
While you focus on profit, whales focus on your biggest fear: stop loss.
🔄 Your Greed Is Their Data
Every stop you set is a data point for them. You chase profit, they chase your surrender.
Lots of long volume in one zone? Price gets dragged down.
Everyone’s short? Expect a fake pump.
Volume is a footprint, and they track emotional traders like a bloodhound.
🚧 Escape The Trap, Don’t Predict The Market
Pro trader’s formula:
Don’t try to predict track.
When you realize the market isn’t moving naturally but hunting orders, your mindset shifts. You become a tracker, not a soothsayer.
📉 Every Candle Can Be A Killer If You’re Unaware
When a big opposing candle hits your position, ask:
Are we all thinking the same thing?
If yes, you’re likely the next target.
📌 Final Summary
If you only chase profit, you miss the fact the market is hunting you.
The only way out: know they play with your info, not just the charts.
Trading blindfolded is walking into the wolf’s den.
✅ What To Do Next?
Learn to analyze other traders’ moves, not just price action.
Use TradingView tools to see behind the candles.
You’re not here to be hunted you’re here to hunt. So this time, guess where everyone’s stop will be before entering!
✨ Need a little love!
We pour love into every post your support keeps us inspired! 💛 Don’t be shy, we’d love to hear from you on comments. Big thanks , Mad Whale 🐋
📜Please make sure to do your own research before investing, and review the disclaimer provided at the end of each post.

Ethereum Idea and Buying Plan⚪️ CRYPTOCAP:ETH
We mentioned earlier that our goal is 3290 - 3473 which is the gap formed in CME contracts
⭕️ Currently, for speculative thinking or looking to enter the support range after all this rise is between 2789.57 to 2685.87
🚨 The important thing is to stay above 2326 to support the continuation of the rise strongly
🔼 The key to the rise will be maintaining movement above 3000 on the 4h and 1d frames
📄 The closest targets for this model, upon meeting the conditions, are 3356 reaching the range of 3567 - 3857

ETHUSDTHere is a great move for ETH after a long time.
So I can recommend some levels to trade and bullish move has been started.
good luck
DYOR!

ETH New Analysis (12H)This analysis is an update of the analysis you see in the "Related publications" section
The previous analysis is still valid | its timeframe is higher, but in this update, we've moved to the lower timeframes.
It seems a valid bottom has been formed on Ethereum, and we may not see a lower low, provided that the price doesn't move higher first but instead drops directly into our support zone. If that happens, the price could potentially move upward from there.
Ethereum seems to be searching for a support zone to reach higher levels. The marked area could potentially launch the price upward.
In this analysis, the support zone, targets, and invalidation level have been updated.
For risk management, please don't forget stop loss and capital management
When we reach the first target, save some profit and then change the stop to entry
Comment if you have any questions
Thank You

ETH Long / Buy SetupAs of many times mentioned that, will short eth above 3k or 3k, but it still shows Bullish momentum no sign of weakness, maybe this entry triggers during weekend due too low volume, search for ifvg, if any 1D or 4hr Bullish fvg truns into bearish ifvg then will take short on ETH. For now will take long with SL and proper risk management.
