Why You Still Lose Money Even With Perfect AnalysisYour setup was on point, your entry was clean, your stop-loss was tight.
Everything looked perfect.
And yet, you still lost.
Maybe the real issue isn’t in your chart, maybe it’s in your head.
Hello✌
Spend 3 minutes ⏰ reading this educational material.
🎯 Analytical Insight on Ethereum:
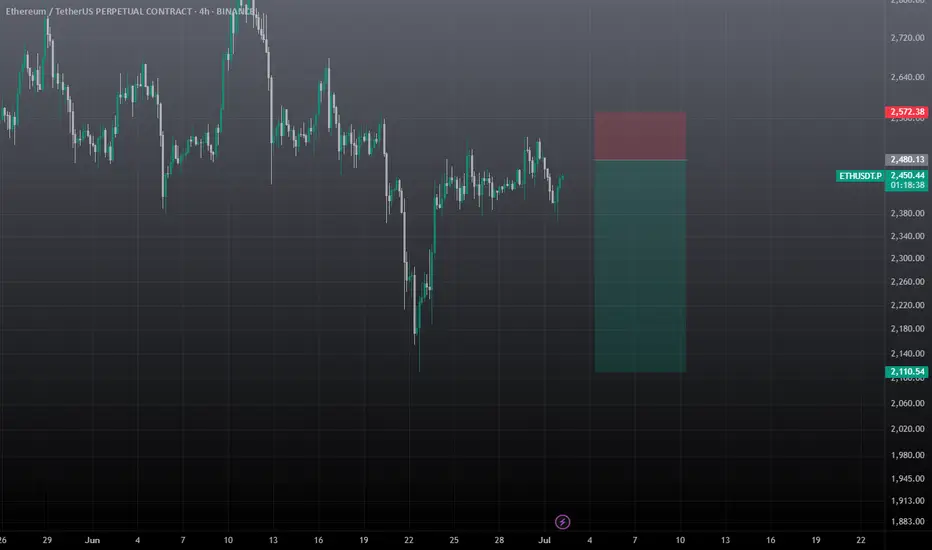
BINANCE:ETHUSDT is currently trading inside a well-defined parallel channel 📈. It is approaching a key daily support level that coincides with an important ascending trendline. A breakout above this channel could lead to a bullish move, targeting at least a 16% gain with a primary resistance zone near $2900 🚀. Monitoring how price reacts around this area will be critical for confirming the next leg up.
Now , let's dive into the educational section,
🧠 Analysis Is Half the Game
Having a clean technical analysis doesn’t guarantee anything if your behavior ruins it.
Most traders change their minds mid-trade because of fear, hope, or noise from other sources.
Market psychology doesn’t always respect your Fibonacci retracement. You might be right and still lose because you couldn’t hold on to the plan.
🕒 Don’t Enter Before the Market Does
Timing is underrated. Many traders get in too early. Your analysis may predict a breakout, but price isn’t ready yet.
Zoom out. A solid setup on the 1-hour chart might need confirmation from the 4-hour or daily.
A great trade is not just where you enter, but when.
😤 It’s Not the Chart — It’s Your Mind
Many times, the chart setup is perfect. But when price wobbles a bit, you lose confidence.
Imagine this: a clean uptrend, higher highs forming, but a small retracement hits and you close the trade. Why? Fear. Not logic.
You lost not because of analysis, but because you couldn’t handle being right under pressure.
📊 TradingView Tools: More Than Just Indicators
If all you're using in TradingView are the typical RSI or MACD indicators, you're barely scratching the surface.
Tools like Bar Replay can simulate real-time reactions to past price action, not just for backtesting, but for testing your discipline under real psychological pressure.
Try this: pick a point where you lost money despite solid analysis. Use Bar Replay and “re-live” the chart without knowing what happens next. Was your entry early? Did you panic exit? Or did your stop-loss placement ignore structure zones?
Also, use the Long/Short Position Tool to visually plan your risk/reward, and adjust your bias if the chart structure doesn’t validate it.
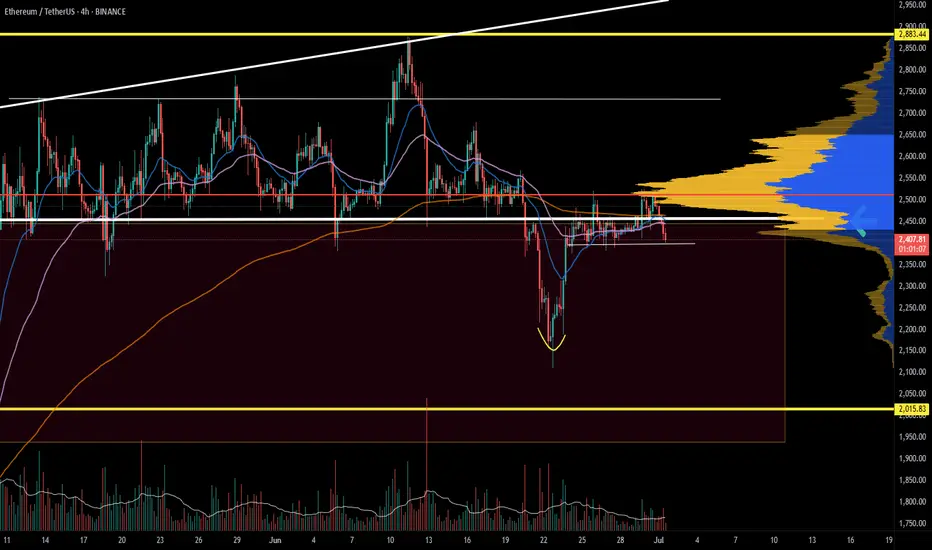
For those wanting a deeper layer, add Volume Profile Fixed Range to identify value zones, where whales are active, and overlay it with your own trade setup.
TradingView isn’t just a charting platform. It’s a behavioral mirror. You don’t just look at the chart, it shows how you act when money’s on the line.
🎯 Your Stop-Loss is for the Chart, Not Your Emotions
If your stop-loss is placed based on what feels safe rather than key market structure, you’re not trading the chart. You’re managing anxiety.
Let structure dictate where your risk lies, not your nerves.
😬 Not Executing = Not Trading
If you don’t follow through with your own trade plan, your analysis is meaningless.
Did you cut early just because a big red candle scared you? Or because someone tweeted a bearish take?
That’s not discipline, that’s reactive trading. It has nothing to do with your original logic.
📉 Losses Are Part of Trading… But Not These Ones
There’s a difference between calculated losses and emotional mistakes.
The first is expected, even professional. The second will drain your account and confidence.
Take losses when the plan fails, not when your emotions freak out.
🔍 Reverse-Engineer Your Entry Logic
Next time you trade, take a screenshot and write down your full reasoning.
Why this entry? What did you see? How will you exit?
Later, go back and compare it to what actually happened.
This habit alone can fix more issues than a dozen trading books.
💡 Perfect Analysis ≠ Profitable Trading
Analysis opens the door, but execution and consistency keep you in the room.
Most traders think the problem is their indicator, but it’s usually the part of themselves that doesn’t listen to the indicator at the critical moment.
🧠 The Power of “Logged Experience”
The real difference between amateurs and veterans isn’t screen time. It’s tracked behavior.
Use TradingView’s built-in Note feature, place icons or comments on every trade setup, and keep a record of your actual thought process.
That feedback loop is gold. It builds self-awareness, the rarest edge in trading.
📺 Make It Visual to Make It Stick
Don't rely solely on indicators.
Use Chart Pattern Drawing Tools, head and shoulders, flags, triangles, and reinforce visual memory.
Also, by managing Visibility Settings, you can keep your charts clean while viewing different structures across timeframes.
The result? You start to see the story behind price, not just numbers.
🔚 Final Thought
If you're still losing money with accurate analysis, maybe it’s time to analyze your reactions instead.
TradingView gives you the tools, but the real upgrade is learning to trust your system under stress.
✨ Need a little love!
We put so much love and time into bringing you useful content & your support truly keeps us going. don’t be shy—drop a comment below. We’d love to hear from you! 💛
Big thanks , Mad Whale 🐋
📜Please remember to do your own research before making any investment decisions. Also, don’t forget to check the disclaimer at the bottom of each post for more details.
ETHUSDT

Ethereum $5,791 followed by $8,500 Late 2025Ethereum is due a major, major bullish wave. No new highs since March 2024. Double-top December 2024.
The bear market ended June 2022. April 2025 marks a long-term higher low.
So the peak remains flat, March 2024 vs December 2024. While the bottom is rising, June 2022 vs April 2025.
You could say the top is a lower high of course, November 2021 vs 2024. This is also valid. Even with a lower high top a bullish wave is due leading to a minimum of around $3,800 or $4,000; back to baseline.
Now, if we really want to talk about minimum because we really don't care about worst case scenario, the fundamentals are improving and everything is getting better, consider $5,791. This would be the minimum. With the Ethereum ETFs and the 2025 bull market, we then open up $8,500 and so on. Growth potential is unlimited and we will have to use our imagination. These numbers are good though and definitely a strong level where action will happen. You will see some resistance, some something going on when Ethereum reaches these numbers.
Ethereum is due a major, major bullish wave. It is not a question of "if," it is a question of "when." When will it happen? "If it happens?" No! When, will it happen?
It will happen in 2025. You can be certain about it... Just watch!
....
Ethereum (ETHUSDT) has been consolidating two months above support. Support being $2,425. One week it broke below this level just to recover the next week. More than 8 weeks sideways wicking lower and higher.
The 7-April low, candle and rounded bottom, as well as long-term higher low makes this date a clear bottom. From the bottom we grow. Once the bottom is hit, the trend changes. The trend has been bearish since March 2024. A long time in Crypto term. We are in the bull market year, 2025. What is not happening now, is what will happen next.
The market was bearish for a long time and that's ok. The good news are the waves within cycles... We just came out of a strong correction; we have a small recovery and consolidation. The initial breakout is being consolidated before additional growth.
Lots of thinking, lots of reasoning, lots of studying... Everything you need to know is already present on the chart. Ethereum will grow. Mark by words. It is already happening.
Thank you for reading.
Namaste.

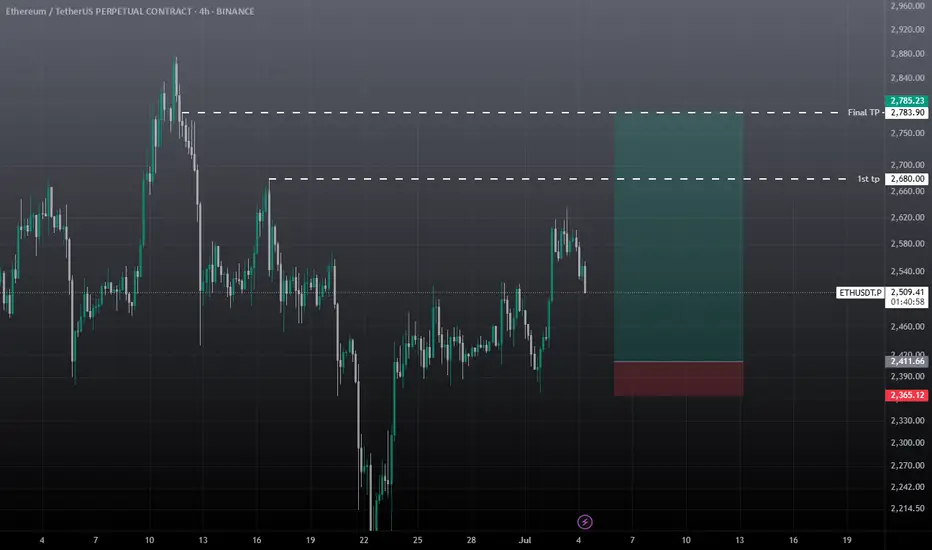
ETHUSD POTENTIAL LONGETHUSD potential bullish setup ↗️
ETH still showing bullish momentum. Might bounce on the bullish trend line, for now it’s hasn’t done the third touch so expect it go lower to the trendline first. A strong bullish confirmation would be a signal to go LONG. Share your thoughts on this in comment section.

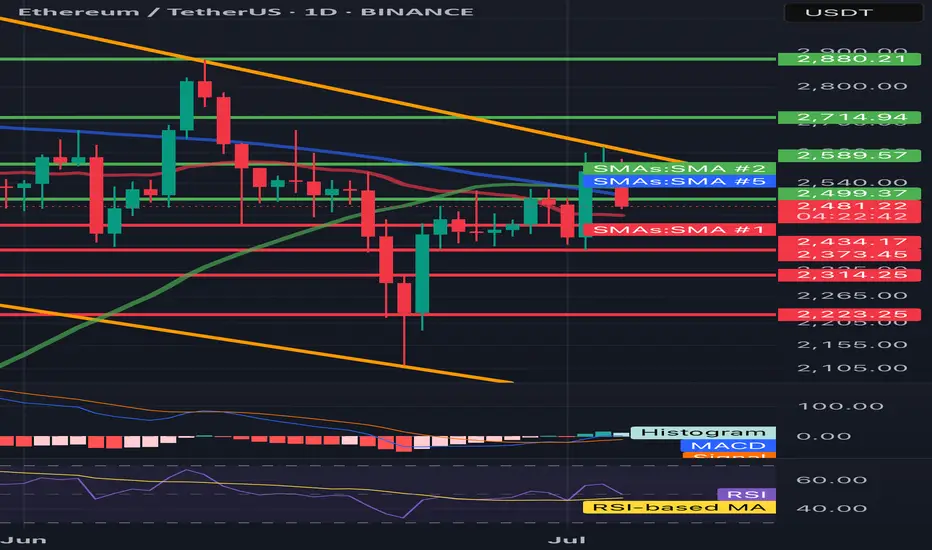
ETH/USDT 1D🔍 ETH/USDT - technical analysis (1D interval):
📉 Price: 2478 USDT (-4.36%)
🔧 Resistance:
• SMA 200 (green): ~ 2589
• Resistance zone: ~ 2715 → 2880 USDT
• SMA 100 (blue): ~ 2500 (just rejected)
🔧 Support:
• SMA 50 (red): ~ 2434 - currently tested
• Strong support: 2373, 2314, 2223 USDT
📊 indicators:
• MacD: freshly intersected, but the momentum is weakening
• RSI: ~ 45 - neutral/weak, under 50 (no bull strength)
• Trend: Still in the downward channel (yellow trend lines)
⸻
⚠️ Conclusions:
• Price rejected from 2500 (SMA 100) and flies down.
• If 2434 falls, a further discount is possible to 2373–2314.
• Lack of bulls with key resistance - the inheritance scenario dominates.
• Watch behavior at 2434 - this is now a key level.
ETH/USDT#ETH
The price is moving within a descending channel on the 1-hour frame and is expected to break and continue upward.
We have a trend to stabilize above the 100 moving average once again.
We have a downtrend on the RSI indicator that supports the upward break.
We have a support area at the lower limit of the channel at 2440, acting as strong support from which the price can rebound.
We have a major support area in green that pushed the price upward at 2440.
Entry price: 2500.
First target: 2545.
Second target: 2539.
Third target: 2641.
To manage risk, don't forget stop loss and capital management.
When you reach the first target, save some profits and then change your stop order to an entry order.
For inquiries, please comment.
Thank you.

ETH SWING TRADEETH Showing strong momentum against BTC, July is also good for eth and some alts, maybe we see correction in Aug, September but before expected pullback towards 2.9k-3k. Must use SL as market is very Volatile these days.
HolderStat┆ETHUSD correctedKUCOIN:ETHUSDT is moving inside a rising wedge after reclaiming support near $2,500. Recent breakout from consolidation supports a continuation push toward $2,720–$2,760. The current trendline structure and bullish price action suggest upside potential.

Ethereum in JULYEthereum should close above $3000 by the end of July to stay in the bull run, Monthly candle is so important now.

TRBUSDT Setup – Staggered Exits, Smart Profits📌 Entry: 36.70
🎯 TP1: +10% → Secure 50% of position
🛡️ Move to risk-free after TP1 to protect capital
🎯 TP2: Take 50% of remaining volume
🎯 TP3: Close all remaining volume
Calculated exits. Risk-managed. Momentum-ready.

$ETH Wave 3 of 3 Underway?CRYPTOCAP:ETH is back into the range EQ as alt coins pump on the back of CRYPTOCAP:BTC breakout
Price caught a strong bid after testing quadruple support: the major High Volume Node (HVN), daily 200EMA, 0.5 Fibonacci Retracement and daily S1 Pivot. Last week I posted about this area holding to kick off wave 3.
There is still work to do to overcome the recent swing high at HVN major resistance but things are certainly looking bullish. The daily pivot point sits at $3150 as the next target.
Long term terminal target for wave 3 is still the R4 daily pivot at $7340, I don't expect the terminal wave 5 to extend much beyond this, perhaps a wick above to trap retail at the top with a lot of media hype attached.
Analysis is invalidated if we fall below wave (2) swing low $2050.
Safe trading

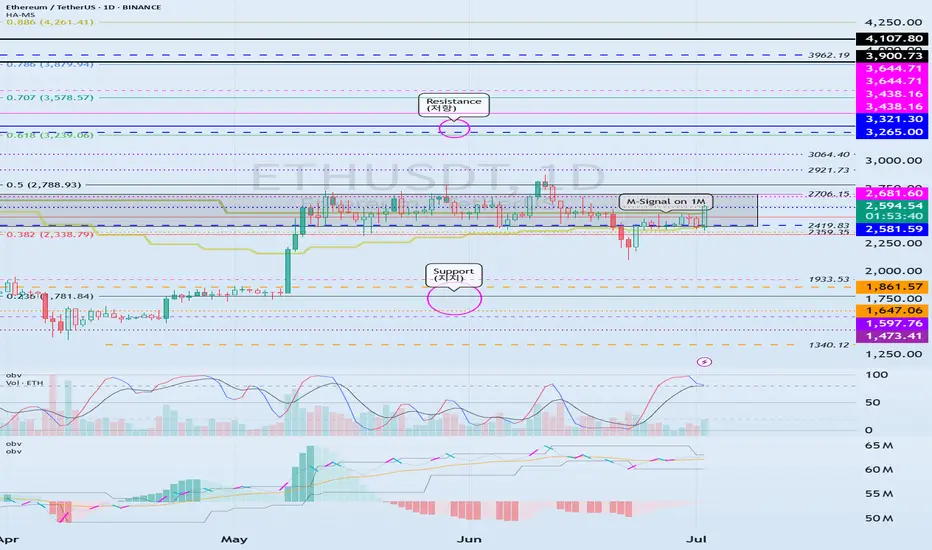
Important Support and Resistance Areas: 2419.83-2706.15
Hello, traders.
Please "Follow" to get the latest information quickly.
Have a nice day today.
-------------------------------------
(ETHUSDT 1D chart)
The key is whether ETH can find support in the 2419.83-2706.15 area and rise.
This is because this section is the section that needs to be supported in order for a full-fledged uptrend to begin.
Therefore, if you are trading ETH, you can proceed with a purchase when support is confirmed in the 2419.83-2706.15 section.
-
Thank you for reading to the end.
I hope you have a successful transaction.
--------------------------------------------------
- Here is an explanation of the big picture.
(3-year bull market, 1-year bear market pattern)
I will explain the details again when the bear market starts.
------------------------------------------------------
Ethereum - ETH - Heading towards the CME Gap - 3200 Target+ After a significant crash, Ethereum has shown a strong recovery.
+ A large CME gap exists between $2,880 and $3,270.
+ Historically, 90% of CME gaps tend to get filled sooner or later.
+ Current price action suggests Ethereum is heading directly toward this gap.
+ High probability that the CME gap will be filled during this move.
+ Next target for ETH: $3,200.
Stay tuned for more updates.
Cheers,
GreenCrypto

ETH/USDT : Gearing Up for a Major Breakout? (READ)By analyzing the Ethereum chart on the weekly timeframe, we can see that the price has started rising just as expected and is now approaching the first target. For now, ETH faces major resistance in the $2,600–$2,900 zone.
If price breaks above this key area, I expect a strong bullish move from Ethereum!
Based on the main analysis, the short-term targets are $2,700 and $2,890, while the mid-term targets are $3,100 and $4,100.
Please support me with your likes and comments to motivate me to share more analysis with you and share your opinion about the possible trend of this chart with me !
Best Regards , Arman Shaban

ETHUSDT SWING TRADE SetupWait for the entry and must use sl, if sl hits then wait for candle closure, candle managed to close above the SL, still there is lot of supply zone for eth till 2.7k, So fakeout also possible. I will comment the update, SO closely follow me.
ETH 30min: Bearish Triangle Forming After RSI Divergencehelo guys
Ethereum is currently trading within a clear range, and recently formed a bearish triangle pattern near the top of the consolidation. A visible RSI divergence confirmed the loss of bullish momentum as price made a higher high, but RSI printed a lower high — a common sign of exhaustion.
Now, ETH is moving downward within the triangle, and pressure is building near the lower edge of the range. If the pattern breaks down as expected, the next likely move is a drop toward the support zone around $2,370–2,380, which marks the bottom of the range.
This setup shows a typical structure:
Divergence → Triangle → Breakdown toward range low
Unless price reclaims the triangle top quickly, bears have the upper hand in the short term.

ETH ANALYSIS🔮 #ETH Analysis 🚀🚀
💲💲 #ETH is trading between support and resistance area. There is a potential rejection again from its resistance zone and pullback from support zone. If #ETH closes above 2500$ then we would see a bullish move
💸Current Price -- $2,462
⁉️ What to do?
- We have marked crucial levels in the chart . We can trade according to the chart and make some profits. 🚀💸
#ETH #Cryptocurrency #DYOR

SUI/USDT Short Setup (2025-07-25)SUI/USDT Short setup for day traders.
Please enter with confirmation in 5M time frame.
⚠️ This Analysis will be updated ...
👤 Sadegh Ahmadi: GPTradersHub
📅 2025.Jul.2
⚠️(DYOR)
❤️ If you apperciate my work , Please like and comment , It Keeps me motivated to do better

ETH/USDT ETH/SDT 1W The market has priced in most scenarios. At this point, the chart tells the story — and it’s playing out as expected

ETH needs support now. ETH is holding up by a thread. There are signs of weakness in the market, and if the Ethereum price breaks below support, it is likely we will see follow-through.
Full TA: Link in the BIO
ethusdt no trade zoneETH is stuck in a range, wait for the sweep of range high, then closing below the range high and take the short, target weekly low. 2nd scenario is wait for to take out the weekly low and any daily candle closing failed to close below this level take the long entry and target the range high. Otherwise expecting this week choppy mean sideways. no major move. Will update if found any good trade.

Ethereum Leveling Map — ETH/USDT 1DNo directional bias for Ethereum, but will use levels to spot entries for intraday.
Right now located at POC and seems balanced for both sides.
Potential Adam&Eve setup in development.
Quality levels for support $2150, 2000, 1800, 1500.
Resistances $2700, 3000, 3500, 4000
Keep in mind it will follow BTC price action by most of time.
Happy trading

2/6/17 BIG SHORT ETH MEGA DUMPI expect the strongest fall in bitcoin and ether, so I take such a trade with a profit risk ratio of 1k12 as part of a classic pattern stop over the 3 top

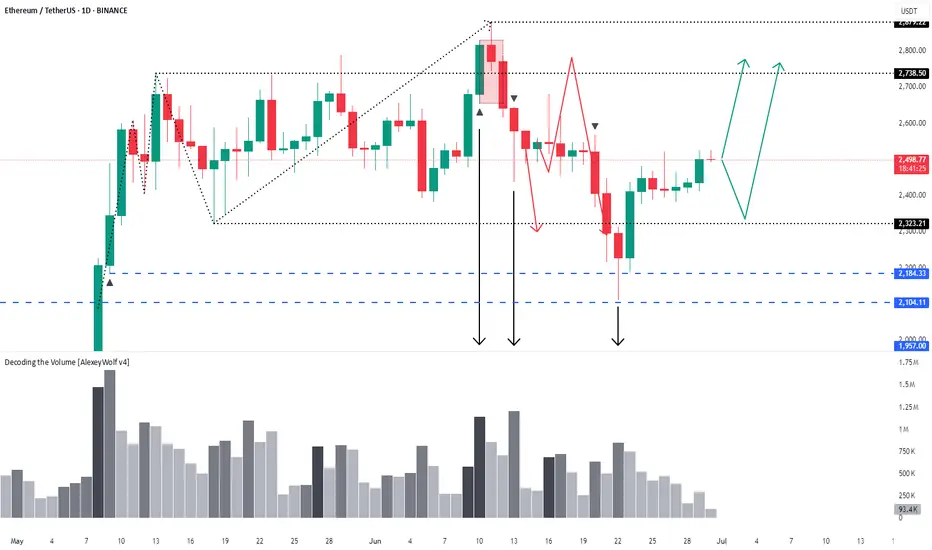
Ethereum – 1D timeframe overview with Initiative AnalysisHey traders and investors!
The seller has reached their target.
A buyer started buying from the 2184 level and now holds the initiative.
Targets are on the chart.
This analysis is based on the Initiative Analysis concept (IA).
Wishing you profitable trades!