ETH didn’t rally — it cleared inefficiency and pausedThis isn’t the move. This is the setup for the move.
ETH tagged 2658.22 — premium — and stalled right where Smart Money pauses before redistributing or rotating.
Here’s how this lines up:
Price swept into the 0 fib (2658.22), then hesitated — that’s not weakness, that’s precision
Just below sits a clean FVG at 2594–2575, right between the 0.382–0.5 fibs
Below that: OB near 2527–2492 — last line of defense before momentum flips
Right now, ETH is offering a reactive pullback opportunity. If bulls hold 2594–2575 with a bounce, we rotate higher again. But if they don’t — 2527 becomes the decision zone.
Execution lens:
Ideal re-entry zone: 2594–2575
Invalidation: sustained close below 2555 = expect OB tap
If FVG holds, expect revisit of 2658 → extension toward 2680s
This setup isn’t done. It’s developing. Wait for price to speak — not hope.
For more plays built like this — mapped in advance, not after the fact — check the profile description
ETHUSDT


ETH/USDTWe have talked about Ethereum many times and said that the main goal of Ethereum is 3000. Ethereum has had an upward movement and is now in a channel. The last movement it had led to a failure and it went back inside. I think Ethereum is bullish. Comment your opinion.

Ethereum Weekly Chart Shows Strength Above Key SupportEthereum is showing strong structure on the higher time frame. After rejecting lower levels, price has reclaimed the mid support/resistance zone, and is now consolidating just above it.
What’s key here is the long-term rising trendline, which has held beautifully since 2020 and once again acted as a springboard for the recent bounce. This kind of confluence — trendline + zone flip — adds weight to the current price structure.
If ETH maintains this zone, we could see accumulation continue, followed by a breakout toward the upper resistance line. For now, the chart leans bullish, but patience is key as consolidation plays out.
DYOR, NFA


Let the Market Teach You PatienceEvery red candle has a reason. Every drawdown has a lesson.
In this journey, it's not just about profits, it's about who you become.
As traders, we don’t just manage risk, we grow through it. Let patience, discipline, and humility shape you in silence, just like the markets do.
This is the mindset behind the candles.
#PEACE

Ethereum. Daily Timeframe. Seller initiativeHey traders and investors!
📍 Context
• Market phase: Sideways range
• Current control: Seller initiative
📊 Key Price Action:
The price broke above the upper boundary of the range (2738) with a buyer KC candle, touching the 50% retracement level (2874) of the last weekly seller initiative (1).
However, the seller absorbed the buyer’s candle and pushed the price back inside the range (2), forming an IKC candle (3) — the highest volume candle within the seller’s initiative.
This sequence presents three bearish signals that support a potential continuation to the downside.
🎯 Trade Idea
Likely scenario: price tests the lower boundary of the range at 3,323.
🔸 In the meantime, it’s reasonable to look for short setups on lower timeframes within the current seller initiative.
🔸 If price reaches 3,323 and valid buyer patterns appear, this zone may offer a good opportunity for long entries.
This analysis is based on the Initiative Analysis concept (IA).
Wishing you profitable trades!

Ethereum Weekly: Bullish & Bearish ExplainedEthereum has been sideways five weeks straight. Market conditions here are bullish and bearish short-term. Let me explain.
The market has bearish potential because of resistance. Ethereum has been facing resistance and fails to move forward for more than one month, but the bias isn't bearish, this is just a potential based on short-term price action.
The market has bullish potential because of a strong recovery after the 7-April low; because it trades above the August 2024 low and because there is very little retrace since the 5-May break of resistance in the form of EMA34 and MA200.
Ethereum is bullish because it trades above MA200 and remains above this level.
We are seeing bullish consolidation. There was an advance recently and after this advance the market went sideways. This means bullish.
While there can be a retrace short-term, market conditions remain bullish for this pair; ETHUSDT.
The bulls have the upper-hand and the majority of signals are bullish. Ethereum will continue to grow.
There is no scenario where Ethereum moves and closes weekly below its 3-Feb and 24-Feb lows ($2,075). It is simply consolidating before additional growth. It is going to go up, sooner rather than later.
Thanks a lot for your continued support.
Namaste.

ETH ANALYSIS📊 #ETH Analysis : Update
✅As we said earlier, #ETH performed same. Now we can see that #ETH is trading in a bullish flag pattern and its a bullish pattern. We could expect around 10% bullish move if it sustain above its major support.
👀Current Price: $2555
🚀 Target Price: $2815
⚡️What to do ?
👀Keep an eye on #ETH price action and volume. We can trade according to the chart and make some profits⚡️⚡️
#ETH #Cryptocurrency #TechnicalAnalysis #DYOR

eth in 45minas you can see we have a bullish trend and strong support for eth.the price will go up and push for orders in higher price.follow me for more....

Ethereum VS $2800The 20MA on monthly timeframe for Ethereum is still working as a strong resistance, and Ethereum is running out of time to break it.
Maximum June or July..

Ethereum Set To Continue Lower, How Long?The drop is now confirmed and yet, it is still early...
Good afternoon my fellow traders, all is good when we consider the chart, Ethereum's price and the bigger picture, nothing changes. But we are witnessing a retrace. This retrace will end in a higher low and I am thinking of time now, duration.
Initially I was thinking about the Fed meeting and this event being the catalyst for change, but the Cryptocurrency market is following its own cycle and for it to be super bullish later this year, all bearish action, all weak hands, needs to be removed now, today.
So the bearish action can fluctuate between just a few days, 3-5 days, to 1-2 weeks. That's my analysis based on past history, chart data and experience.
The retrace might not last that long though, market conditions continue to improve and Ethereum might not produce a lower low compared to Bitcoin. Bitcoin is trading pretty high and a correction can develop any day. Since Ethereum is already low compared to its ATH, there is less room for prices to move lower, makes sense?
The downside is always limited, SHORTing is riskier than going LONG. It is wise to wait for a new entry before buying more. Experienced traders are recommended to SHORT. This chart setup will change in a matter of days, and then the market will turn bullish again, long-term.
Thank you for reading.
Namaste.

Bitcoin's Price Action Reveals A Bearish Ethereum—Back To BasicsBitcoin is bearish, top confirmed; we know Ethereum and Bitcoin move together in the exact same way. This means that Ethereum will also move lower.
Here we have a higher high but lacking strength, volume is dropping. There will be a continuation of the retrace.
Consider waiting (SHORT) until after the FED decision result. The market can remain slightly bearish until after the event. The drop will open the doors for new entry prices. Market conditions can always change.
We are live with a 20X SHORT on Bitcoin, Ethereum will do the same. Just a small drop (can be a strong drop) ending in a higher low followed by a new wave of growth. Not all charts/pairs/projects are the same. Some will move down while others move up. Sell at resistance, buy at support.
Namaste.

Where is Ethereum's target? (1D)This analysis is an update of the analysis you see in the "Related publications" section
The previous analysis has expired, and the price moved up without any correction. This type of movement is usually intended to attract liquidity, and once liquidity is absorbed, the price often goes through a correction.
From the point where we placed the green arrow, Ethereum has entered a bullish phase.
It now appears that we are in wave B of this bullish phase. The price may get rejected from the red zone.
Price can be rejected from the red box.
Do not enter any positions without confirmation, as the price may even continue moving up to the top of the red box.
For risk management, please don't forget stop loss and capital management
When we reach the first target, save some profit and then change the stop to entry
Comment if you have any questions
Thank You

Ethereum's Road to $7500 – Strategic Entries & Profit Optimizati🔵 Entry Zone: My first position is placed at $2225.5, aligning with a strong support level, while a secondary entry at $1857.5 serves as an additional safeguard against unexpected market swings—lowering my average purchase price and protecting capital.
💰 Profit-Taking Strategy: For low-risk traders, securing a 40% profit from the first entry is a prudent move to lock in gains early. However, my long-term target remains ambitious.
🚀 Main Target: Based on valuation models and fundamental news, Ethereum’s upside potential points toward $7500. However, I personally plan to secure 90% of my holdings at $6000, ensuring strong profit realization while leaving room for further upside.
This setup balances risk management, smart positioning, and strategic profit optimization. Let’s see how ETH’s trajectory unfolds!
Entry1: 2225.5
Entry 2: 1857.5
If your second entry is successful, you are required to withdraw 50 to 70 percent of your capital to maintain your capital. I will definitely update this setup.

ETHUSDT.P H1 : Short-Term CorrectionBy analyzing the 1-hour timeframe, we can see that the price may drop from the 2780–2820 zone down to 2600

Ethereum Looks Identical to Early-Day AmazonToday I look at Ethereum versus early-day Amazon and the similarities between the internet bubble and the 2021 crypto bubble. Everyone talks about how the internet bubble popped, but few people talk about what came afterward. There was a strong recovery in the markets, and the internet was mass adopted by the public—along with the technology of home computers.
I believe we are heading into a mass adoption phase for crypto. We've had a bubble-and-pop scenario, and now that major institutions are investing in crypto, we are set up for mass adoption—very similar to what happened with home computing and the internet as a technology. I see Ethereum as being the "Amazon" of this new wave, and Bitcoin as being the "Apple." Big things are coming in these markets.
As always, stay profitable.
– Dalin Anderson

ETHEREUM: THE NEW BOND OF THE DIGITAL WORLDPrice isn’t the goal. Price is the side effect.
Meanwhile, BlackRock - a black hole with a trust-backed logo - just absorbed 42,000 ETH more.
Yesterday, you may have read this "regular" headline:
BlackRock increases its Ethereum exposure to $4 billion, adding $109.5 million via ETFs.
But here’s what you missed: there are no random numbers on the market.
When a player like this moves - it’s not hype. It’s a blueprint for the future.
Ethereum is no longer an altcoin.
It’s no longer speculation. It’s a financial infrastructure, already recognized by law, exchanges, and institutions.
What does this mean?
💡 Ethereum is now a digital bond - with yield flowing from blocks.
Profit is no longer built on promises, but on the structure of the chain itself.
Trust lies not in faces, but in code.
Growth is not artificial — it’s architectural.
And here’s why this is terrifyingly beautiful:
While you sleep, they are building an era.
Each ETF purchase removes ETH from circulation - permanently. Because:
✅ This ETH is gone from the open market
✅ It won’t be panic-sold
✅ It becomes income-bearing collateral, not a speculative asset
Still waiting for an entry signal?
The big players are already in.
This is no longer crypto - this is cash flow infrastructure, embedded into the digital economy.
And when pension funds, insurers, and sovereign investors move into Ethereum - they will come via ETFs.
Not because it’s trendy, but because it’s regulated, stable, and profitable.
📉 When institutional demand meets vanishing supply - the price won’t simply rise. It will explode, not as growth, but as a structural liquidity shift.
Ethereum is:
💸 Staking = passive yield
🔗 Backbone of DeFi
🖼 Fuel for NFTs
⚙️ Millions of transactions per second
⚖️ A regulated ETF asset
This is the new digital bond system, where the bet isn’t on the dollar - it’s on ETH as an income-producing asset.
💥 While you're reading this, the game is already on.
ETFs are rewriting the rules of time-ownership.
No hype. Just filings. Just intention.
Best regards EXCAVO

ETH Bullish Setup: Pullback to 200_SMA(D) May Launch Next Rally Ethereum ( BINANCE:ETHUSDT ) seems to have finally managed to break the Resistance lines and the 200_SMA(Daily) in the fifth attack . However, the number of Resistance lines inside the Heavy Resistance zone($2,929_$2,652) is high, and Ethereum will find it difficult to break through them.
In terms of Elliott Wave theory , it seems that Ethereum is completing microwave 4 , and we should wait for this wave to complete. Microwave 4 could act as a pullback to the resistance lines and 200_SMA(Daily) .
I expect Ethereum to start rising from the Support zone($2,745_$2,650) again and rise to at least the Potential Reversal Zone(PRZ) .
Note: If Ethereum touches $2,537 , we can expect further declines.
Please respect each other's ideas and express them politely if you agree or disagree.
Ethereum Analyze (ETHUSDT), 1-hour time frame.
Be sure to follow the updated ideas.
Do not forget to put a Stop loss for your positions (For every position you want to open).
Please follow your strategy and updates; this is just my Idea, and I will gladly see your ideas in this post.
Please do not forget the ✅' like '✅ button 🙏😊 & Share it with your friends; thanks, and Trade safe.

ETHUSDTEthereum could move from these two price areas to 2852.08,
It seems like a definite move at that price. BINANCE:ETHUSDT

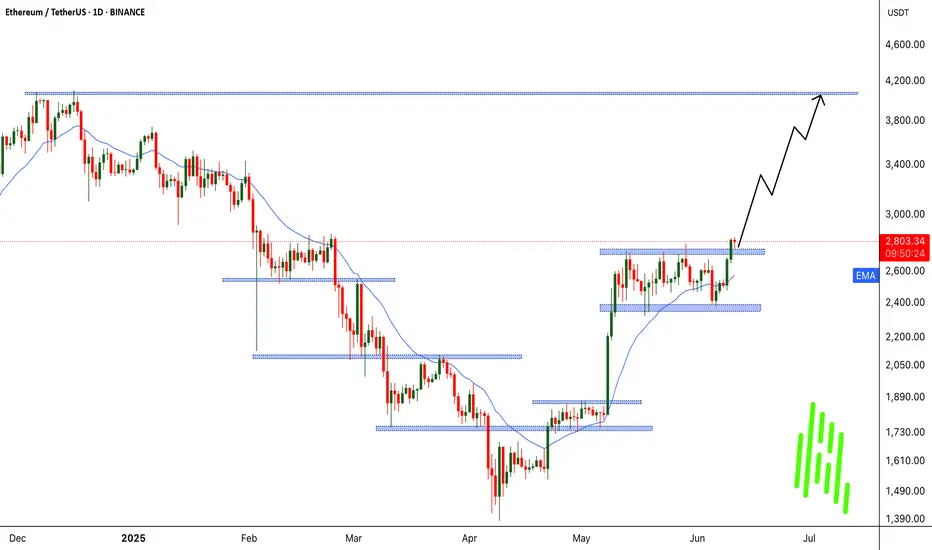
Bad Time Over for ETH? Second Wave Toward $4,000 Incoming!!🟢 Bad Time Over for ETH? Second Wave Toward $4,000 Incoming
MARKETSCOM:ETHEREUM ( CRYPTOCAP:ETH ) appears to be leaving its consolidation phase behind, and all signs point to a fresh bullish wave. After outperforming Bitcoin in recent days, CRYPTOCAP:ETH has now broken out of a key structure — signaling the potential start of a major uptrend.
We’re also witnessing rising CRYPTOCAP:ETH inflows, suggesting growing investor confidence. This kind of accumulation behavior has historically led to significant rallies. Previously, ETH consolidated between $1700–$1800 before a strong move up. More recently, it ranged between $2400–$2700, and now that it’s broken out, we’re anticipating another powerful leg — possibly the second wave of this trend.
If the current momentum continues, a move toward $4000 looks likely, and with enough strength, even a new all-time high isn’t off the table.
BINANCE:ETHUSDT Currently trading at $2795
Buy level : Above $2750
Stop loss : Below $2305
Target : $4000
Max leverage 3x
Always keep stop loss
Follow Our Tradingview Account for More Technical Analysis Updates, | Like, Share and Comment Your thoughts
Ethereum (ETH/USDT) – Ascending Triangle Breakout Incoming?ETH is pressing against the upper resistance of a long-forming ascending triangle on the 4H chart — historically a bullish continuation pattern.
Previous Move:
Last breakout saw a +49.7% move, and the structure suggests we could see a similar surge again!
Key Levels:
Support: $2,242.98
Breakout Zone: $2,850
Resistance/Target 1: $3,419
Major Target 2: $4,282 (+49.7%)
RSI: 70.5 — strong momentum, near overbought but in breakout territory.
Volume seems to be increasing near resistance, a breakout could be imminent.
Potential Upside: +49.7% if triangle breaks cleanly.
Bias: Bullish
Timeframe: 4H
Watch for: Rejection at $2,850 or breakout retest for entry confirmation.
This is not financial advice, please do your research before investing, as we are not responsible for any of your losses or profits.
Please like, share, and comment on this idea if you liked it.
#ETH #Ethereum #ETHUSDT
