ETHUSDT – Trade Recap & Daily Bias for June 21Trade Recap (June 20):
I. First thing I did was mark out a DOL on the daily — price was hovering near a swing low, and I started noticing trend-side liquidity building up on the lower timeframes.
So my directional bias for today was short.
II. I marked the daily open.
III. With a short bias in mind, I waited for a Turtle Soup setup right above the daily open.
IV. The equal highs above were clean and obvious — textbook liquidity.
V. Once that liquidity was swept, I dropped to the M15 to watch how price reacted — waited for a clean displacement away from that zone before getting involved.
Daily Bias (June 21):
Still leaning short. We’re pretty close to a weekly FVG, which might act as a magnet.
If price forms liquidity during the day and takes it out in-session, I’ll look to short again.
Bread and Butter & Turtle Soup
ETHUSDT

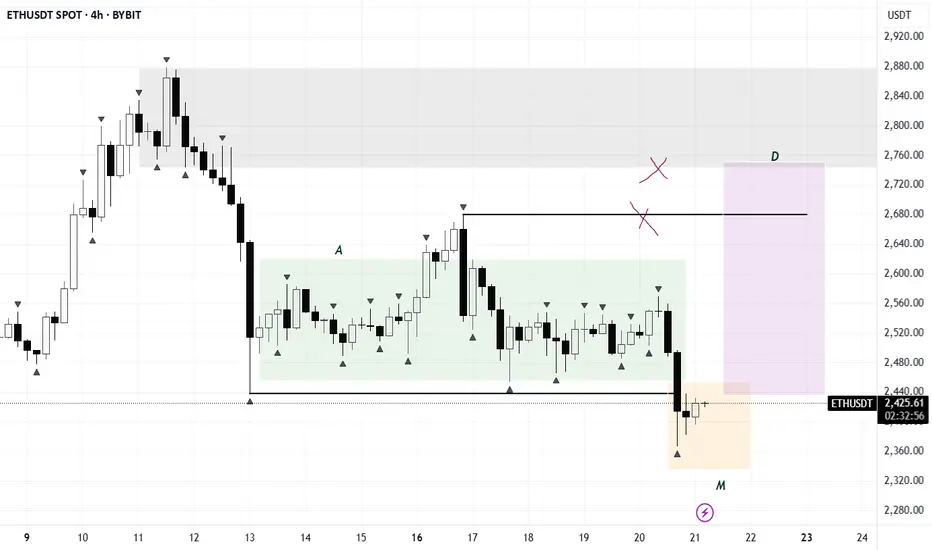
ETH/USDTFollowing the consolidation phase, we’ve seen a clear manipulation move — the structure closely resembles an AMD setup. As long as the pattern holds, upside targets are in the $2700–$3000 range.
ETHUSDT – LAST HOPE FOR BULLS!Hey Traders!
If you’re finding value in this analysis, smash that 👍 and hit Follow for high-accuracy trade setups that actually deliver!
ETH has officially broken below the ascending channel support and is now testing the final demand zone (highlighted in green). This zone also aligns with the 200 EMA on the 12H timeframe — historically a strong dynamic support.
📉 If ETH fails to hold this green box, it could trigger a deeper correction, potentially dragging the price back towards the $2,200–$2,100 range.
✅ Bullish Case: A quick reclaim of the $2,460–$2,500 area followed by strong volume could invalidate this breakdown and bring back momentum toward $2,800.
🚨 Bearish Confirmation: A clean close below $2,400 on the 12H/Daily with rejection wicks would open the floodgates for lower targets.
💡 This is a make-or-break moment. Bulls need to defend this zone with strength — or risk handing over full control to the bears.
📍 Levels to Watch:
Support: $2,360 / $2,280 / $2,120
Resistance: $2,500 / $2,660 / $2,800
📊 Stay cautious, stay prepared. Follow for real-time crypto breakdowns & setups.

Ethereum at PRZ: Bullish Setup _ Short termEthereum ( BINANCE:ETHUSDT ) reacted from the Potential Reversal Zone (PRZ) around the confluence of key Fibonacci levels , the Important Support line and 50_SMA(Daily) .
From an Elliott Wave point of view , we can identify a Expanding Flat (ABC/3-3-5) structure ending right above the Support zone ($2,474-2,437) .
The structure also hints at the formation of a new upward leg , potentially leading ETH toward the Resistance zone ($2,564-$2,524) and the upper line of the Ascending Channel .
I expect Ethereum to test the 38.2%($2,531=First Target) - 50%($2,561) Fibonacci retracement levels on the way to a potential retest of the previous swing highs .
Note: Stop Loss (SL) = $2,451= Worst Stop Loss(SL)
Please respect each other's ideas and express them politely if you agree or disagree.
Ethereum Analyze (ETHUSDT), 15-minute time frame.
Be sure to follow the updated ideas.
Do not forget to put a Stop loss for your positions (For every position you want to open).
Please follow your strategy and updates; this is just my Idea, and I will gladly see your ideas in this post.
Please do not forget the ✅' like '✅ button 🙏😊 & Share it with your friends; thanks, and Trade safe.

Ethereum, Bullish Breakout Expected Any Moment Now!Look at this, the first peak for Ethereum happened 13-May after the start of the recovery and the end of the downtrend. The lowest point happened five days later on 18-May and there has been no new lows since. Ethereum has been in a bullish consolidation pattern, a classic bullish flag.
This kind of dynamic clearly reveals a bullish bias and certainly, Ethereum is already trading pretty low compared to its last high.
A new and most interesting signal comes from the stock COIN, for Coinbase. This stock went ahead and produced a very strong bullish breakout yesterday with a green candle reaching +16%. COIN's chart and ETH are almost identical, exactly the same. Since these two move together, we can expect Ethereum to follow suit and do the same. We can expect a bullish breakout to happen any day now. Consolidation has been going long enough. It is time for the market to grow.
Some of the smaller altcoins continue to move forward, this is a signal that should not be ignored.
Namaste.

ETH - BOOM or Toink?Okay Mostly boom down, but a toink to get over most peoples liquidity and get sorted up, the probable move is this as per me

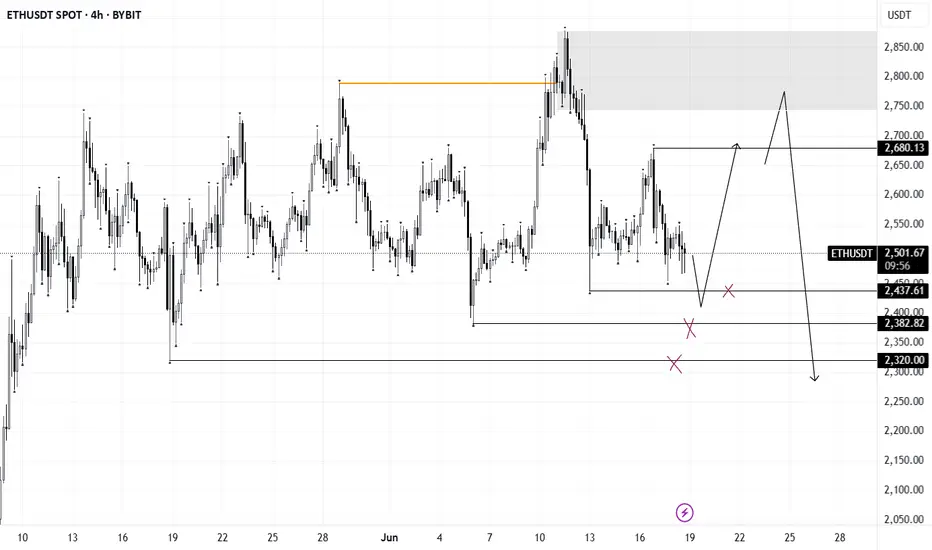
ETH/USDTETH remains in a consolidation phase. Attention is on the nearest liquidity zone — a sweep or reaction here could signal the next move. Failure to reclaim and hold above the $2600 level on the weekly close opens the door for a potential drop into the $2000–$2300 range, aligning with a possible manipulation phase before reversal.
Longs or shorts only considered upon clear confirmation and valid setup. No rush — let the market come to you.
ETH – Rounded Distribution Before the Punch Higher?What we’re seeing here is a potential fakeout setup within a value zone.
Notice the rounded top formation — looks bearish — but price refuses to break the low. This often sets the stage for a sharp reversal.
Structure Breakdown:
Volume profile shows acceptance in current range
Rounded top shape implies weakness — but no breakdown = trap potential
Price holds a higher low inside the range = absorption
Green box marks ideal long entry area — well-defined invalidation below
Bullish case:
We’re watching for that reclaim of the mid-level → quick push into the upper range
Target zone = 2,618 (clean inefficiency fill + local top)
Bearish trap scenario invalidated if price closes below red box (stop hunt level)
Strategy bias:
This is a compression-reversal trap — fake weakness to trap shorts, then launch.
Patience pays here — if it reclaims and consolidates at the mid, it’s time to ride.
📊 More setups like this, early in structure, are shared inside the account description. Tap in for the breakdowns.

ETH | BULLISH Pattern | $3K NEXT ??Ethereum has established a clear bullish pattern in the daily as we're seeing an inverse H&S:
The war issues across the globe must also be considered. So far, it's been bullish for crypto but this can also change overnight since it's a very volatile situation - and crypto being a very volatile asset.
For the near term, I believe ETH is due for another increase - at least beyond the current shoulder. This is IF we hold the current support zone:
It seems to be a bit of a slow burn with ETH for this season's ATH. In the ideal world, we'd either:
📢 consolidate under resistance (bullish)
📢make a flag (bullish)
📢OR smash right through the resistance.
But there's likely going to be heavy selling pressure around that zone.
__________________________
BINANCE:ETHUSDT

ETH at critical levelsCRYPTOCAP:ETH is at the bottom of the structure, great risk-to-reward ratio. However, the bearish thesis needs to consider a dip to 2kish level. To make the DCA strategy work best, buying on dips is vital.
Full TA: Link in the bio

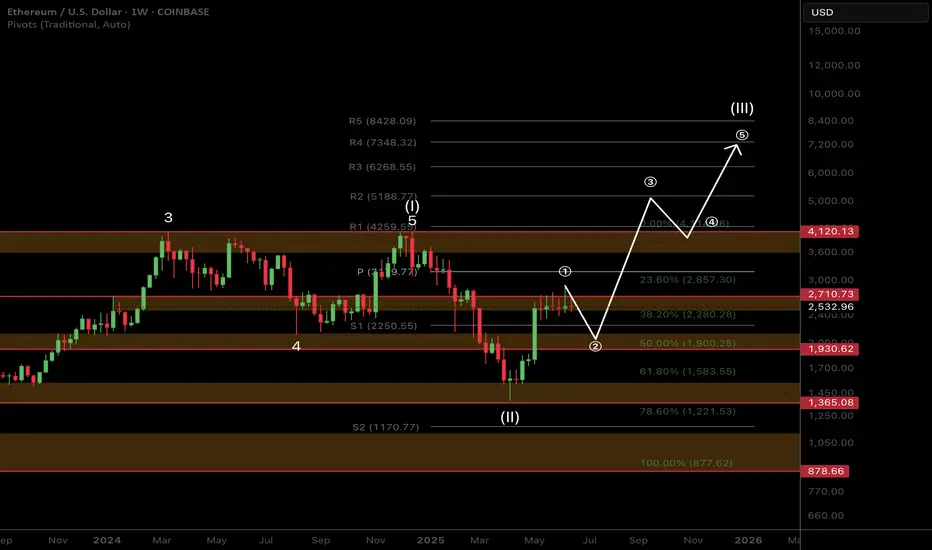
ETH Macro Analysis☕ 𝙂𝙈. CRYPTOCAP:ETH Macro analysis update...
📈 𝙇𝙤𝙣𝙜 𝙩𝙚𝙧𝙢 outlook remains unchanged and recent price action printing a doji. Target is still $7k for this cycle.
📉 𝙎𝙝𝙤𝙧𝙩 𝙩𝙚𝙧𝙢 outlook has investors looking lower towards the $1900 target but this isn't guaranteed to be reached and price action may front tat $2200.
War escalation's and retail selling are keeping price suppressed. ETF inflows and staking continue to grow!
The time for patience continues. Money is made in the sitting, weathering volatility, not flipping in and out of trades on every bit of news and price movement
𝙏𝙚𝙘𝙝𝙣𝙞𝙘𝙖𝙡 𝘼𝙣𝙖𝙡𝙮𝙨𝙞𝙨
Price is consolidating at its recent highs. Consolidation under resistance has high probability of breaking out, the longer it remains the higher the probability.
Elliot Wave (EW) analysis suggests a motif wave ended at the $2700 resistance, with a wave 2 retracement underway, likely a shallow one.
Safe trading
Ethereum (ETH/USDT) – Breakdown From Ascending TriangleEthereum failed to hold above the crucial resistance of $2,849 and has broken down from the ascending triangle on the 4H timeframe — invalidating the bullish breakout structure.
It seems to be consolidating and moving sideways in the range. The move is possible only if we break the channel either upside or downside.
Key Observations:
Ascending triangle fakeout followed by sharp rejection
RSI dropped from overbought (~70) to neutral zone (~46), showing weakening momentum
Current price: $2,537, testing local support at $2,384.90
Next major support zones: $2,242.98 and $1,852.48
Watch for further weakness below $2,384 — could accelerate downside toward $2,242 or lower.
Caution advised: Wait for the structure to rebuild before positioning it long.
This is not financial advice, please do your research before investing, as we are not responsible for any of your losses or profits.
Please like, share, and comment on this idea if you liked it.
#ETH #Ethereum #ETHUSDT

Breakout point: 2706.15
Hello, traders.
If you "follow", you can always get the latest information quickly.
Have a nice day today.
-------------------------------------
(ETHUSDT 1D chart)
The key is whether the price can rise above the important support and resistance area of 2419.83-2706.15 and maintain it.
Therefore, when the 2706.15 point is broken upward, it can be said that a breakout trade is possible.
The conditions for a breakout trade are:
- OBV must rise above the High Line and be maintained,
- OBV oscillator must show an upward trend,
- StochRSI indicator must show an upward trend.
However, it is better if StochRSI indicator has not entered the overbought zone.
When the rise begins, the resistance zone is expected to be around 3265.0-3321.30.
-
Although funds are continuously flowing into the coin market, it may feel like the trading volume has decreased.
The reason for this is thought to be that BTC dominance is generally showing an upward trend.
The meaning of BTC dominance rising means that funds in the coin market are concentrated toward BTC.
Therefore, I think that the overall trading volume has decreased because more funds are needed for the price to rise.
When the altcoin bull market begins, more transactions will occur, which will make you think that liquidity has increased in the coin market.
Therefore, for the altcoin bull market to begin, the BTC dominance must fall below 55.01 and remain there or continue to fall.
If the USDT dominance remains below 4.97 or continues to fall, the coin market is likely to rise.
At this time, depending on the BTC dominance mentioned earlier, you can distinguish whether the rise is focused on BTC or whether the altcoin is also rising.
If the BTC dominance continues to rise, most altcoins are likely to gradually move sideways or fall.
Therefore, if you are trading altcoins in this situation, I think it would be useful to increase the number of coins (tokens) corresponding to profit while responding quickly and briefly.
In other words, it means selling the purchase amount (+including transaction fees) when the price rises by purchase price, leaving the number of coins (tokens) corresponding to profit.
The coins (tokens) increased in this way are coins (tokens) with an average purchase price of 0, which will reduce the psychological burden when the altcoin bull market begins, allowing you to obtain a good average purchase price.
-
Thank you for reading to the end.
I hope you have a successful transaction.
--------------------------------------------------
- This is an explanation of the big picture.
(3-year bull market, 1-year bear market pattern)
I will explain more details when the bear market starts.
------------------------------------------------------

Ethereum Holds the Line – Is $2,300 the Key to the Next Rally?By examining the #Ethereum chart on the weekly (logarithmic) timeframe, we can see that after rising to $2,880, the price faced selling pressure and corrected down to $2,500. This upward move created a large Fair Value Gap (FVG) between $1,870 and $2,300, which is likely to be filled in the medium term if the price drops further.
However, as long as Ethereum continues trading above the $2,300 level and does not close below it, we can still expect further bullish movement.

ETH didn’t rally — it cleared inefficiency and pausedThis isn’t the move. This is the setup for the move.
ETH tagged 2658.22 — premium — and stalled right where Smart Money pauses before redistributing or rotating.
Here’s how this lines up:
Price swept into the 0 fib (2658.22), then hesitated — that’s not weakness, that’s precision
Just below sits a clean FVG at 2594–2575, right between the 0.382–0.5 fibs
Below that: OB near 2527–2492 — last line of defense before momentum flips
Right now, ETH is offering a reactive pullback opportunity. If bulls hold 2594–2575 with a bounce, we rotate higher again. But if they don’t — 2527 becomes the decision zone.
Execution lens:
Ideal re-entry zone: 2594–2575
Invalidation: sustained close below 2555 = expect OB tap
If FVG holds, expect revisit of 2658 → extension toward 2680s
This setup isn’t done. It’s developing. Wait for price to speak — not hope.
For more plays built like this — mapped in advance, not after the fact — check the profile description


ETH/USDTWe have talked about Ethereum many times and said that the main goal of Ethereum is 3000. Ethereum has had an upward movement and is now in a channel. The last movement it had led to a failure and it went back inside. I think Ethereum is bullish. Comment your opinion.

Ethereum Weekly Chart Shows Strength Above Key SupportEthereum is showing strong structure on the higher time frame. After rejecting lower levels, price has reclaimed the mid support/resistance zone, and is now consolidating just above it.
What’s key here is the long-term rising trendline, which has held beautifully since 2020 and once again acted as a springboard for the recent bounce. This kind of confluence — trendline + zone flip — adds weight to the current price structure.
If ETH maintains this zone, we could see accumulation continue, followed by a breakout toward the upper resistance line. For now, the chart leans bullish, but patience is key as consolidation plays out.
DYOR, NFA


Let the Market Teach You PatienceEvery red candle has a reason. Every drawdown has a lesson.
In this journey, it's not just about profits, it's about who you become.
As traders, we don’t just manage risk, we grow through it. Let patience, discipline, and humility shape you in silence, just like the markets do.
This is the mindset behind the candles.
#PEACE

Ethereum. Daily Timeframe. Seller initiativeHey traders and investors!
📍 Context
• Market phase: Sideways range
• Current control: Seller initiative
📊 Key Price Action:
The price broke above the upper boundary of the range (2738) with a buyer KC candle, touching the 50% retracement level (2874) of the last weekly seller initiative (1).
However, the seller absorbed the buyer’s candle and pushed the price back inside the range (2), forming an IKC candle (3) — the highest volume candle within the seller’s initiative.
This sequence presents three bearish signals that support a potential continuation to the downside.
🎯 Trade Idea
Likely scenario: price tests the lower boundary of the range at 3,323.
🔸 In the meantime, it’s reasonable to look for short setups on lower timeframes within the current seller initiative.
🔸 If price reaches 3,323 and valid buyer patterns appear, this zone may offer a good opportunity for long entries.
This analysis is based on the Initiative Analysis concept (IA).
Wishing you profitable trades!

Ethereum Weekly: Bullish & Bearish ExplainedEthereum has been sideways five weeks straight. Market conditions here are bullish and bearish short-term. Let me explain.
The market has bearish potential because of resistance. Ethereum has been facing resistance and fails to move forward for more than one month, but the bias isn't bearish, this is just a potential based on short-term price action.
The market has bullish potential because of a strong recovery after the 7-April low; because it trades above the August 2024 low and because there is very little retrace since the 5-May break of resistance in the form of EMA34 and MA200.
Ethereum is bullish because it trades above MA200 and remains above this level.
We are seeing bullish consolidation. There was an advance recently and after this advance the market went sideways. This means bullish.
While there can be a retrace short-term, market conditions remain bullish for this pair; ETHUSDT.
The bulls have the upper-hand and the majority of signals are bullish. Ethereum will continue to grow.
There is no scenario where Ethereum moves and closes weekly below its 3-Feb and 24-Feb lows ($2,075). It is simply consolidating before additional growth. It is going to go up, sooner rather than later.
Thanks a lot for your continued support.
Namaste.
