#ETH: FORMING THIS H&S PATTERN!!Hi guys, This is CryptoMojo, One of the most active trading view authors and fastest-growing communities.
Do consider following me for the latest updates and Long /Short calls on almost every exchange.
I post short mid and long-term trade setups too.
Let’s get to the chart!
I have tried my best to bring the best possible outcome in this chart, Do not consider it as financial advice.
Welcome to this ETH update.
ETH does not look good here. Forming an I head and shoulder pattern in a 4hr time frame. Currently, trying to break the neckline of the head&shoulder it will pump hard.
If you like this idea then do support it with like and follow.
Also, share your views in the comment section.
Thank You!
This chart is likely to help you in making better trade decisions if it did consider upvoting this chart.
Would also love to know your charts and views in the comment section.
Thank you
ETHUSDTPERP

Ethereum (ETH) - August 26Hello?
Welcome, traders.
If you "follow", you can always get new information quickly.
Please also click "Like".
Have a good day.
-------------------------------------
(ETHUSDT 1W Chart)
Considering the relationship between the HA-Low and HA-High indicators mentioned in the BTC analysis article, it seems that the second wave of rising is in progress from a mid- to long-term perspective.
In order for the uptrend 3 wave to proceed, the HA-High indicator must rise above the HA-High indicator, so it is necessary to make the HA-High indicator fall.
To do that, you need to wiggle up and down.
(1D chart)
Therefore, the key question is whether it can rise above 1741.38 and find support.
It is expected to turn into an upswing wave if it shakes up and down while maintaining the price above 1741.38, causing the HA-High indicator on the 1W chart to decline.
------------------------------------------------------------ -------------------------------------------
** All descriptions are for reference only and do not guarantee a profit or loss in investment.
** The MRHAB-T indicator, which is inactive on the chart, contains indicators that indicate support and resistance points.
** Background color of Long/Short-S indicator: RSI oversold and overbought sections
** Background color of CCI-C indicator: When the short-term CCI line is below -100 and above +100, oversold and overbought sections are displayed.
** The OBV indicator was re-created by applying a formula to the DepthHouse Trading indicator, an indicator disclosed by oh92. (Thanks for this.)
(Short-term Stop Loss can be said to be a point where profit and loss can be preserved or additional entry can be made through split trading. It is a short-term investment perspective.)
---------------------------------

#ETH UPADTE Hi guys, This is CryptoMojo, One of the most active trading view authors and fastest-growing communities.
Do consider following me for the latest updates and Long /Short calls on almost every exchange.
I post short mid and long-term trade setups too.
Let’s get to the chart!
I have tried my best to bring the best possible outcome in this chart, Do not consider it as financial advice.
ETH BREAKDOWN HIS RISING WEDGE PATTERN AND CURRENT RETESTING THE SECOND RESISTNCE.
ETH SORT TRADE SETUP
ENTRY: CMP and add up to $1660
SL: $1695
TARGET: 27%
This chart is likely to help you in making better trade decisions if it did consider upvoting this chart.
Would also love to know your charts and views in the comment section.
Thank you

Symmetrical Triangle (Bearish) 15MIN ETH-USDTAppears to be a bearish symmetrical triangle on the 15 minute timeframe.
Can also be seen on smaller timeframes and up to several hour timeframe.
Hoping for a breakout at 1840 for short position. And take profit around 1740 area.
Anyone else seeing and expecting this to play out too?
:D


Bearish BiasEthusdt is still quite bullish on the lower TF. However, price is possibly forming a head and shoulder pattern. The neckline is still intact though. A break below the neckline and below the current trendline as shown in the chart would invalidate this idea. However, until that happens, we will continue to trade level by level with a bullish bias.
#NFA

ETH: Should hold this support!!Hi guys, This is CryptoMojo, One of the most active trading view authors and fastest-growing communities.
Do consider following me for the latest updates and Long /Short calls on almost every exchange.
I post short mid and long-term trade setups too.
Let’s get to the chart!
I have tried my best to bring the best possible outcome in this chart, Do not consider it as financial advice.
Ethereum is in an upward price channel. Together with the support of the channel passes the trend line MA 200, which marks a strong zone for us. Below the channel, strong support from May 2021 is forming.
On the chart, we see a strong intraday downward momentum that could herald a correction. I think it could reach the support zone of the price channel, after which an upward move could continue.
The target for Ethereum could be both the resistance of 2300 and the trend line, which originates from November 2021.
This chart is likely to help you in making better trade decisions if it did consider upvoting this chart.
Would also love to know your charts and views in the comment section.
Thank you

ETHUSDT 12h How long will the growth of Ethereum continue?Three weeks ago, before the current uptrend became mainstream) We published a long medium-term trade for the ETHUSDT trading pair
And we are very sorry if you are still not subscribed to us and lost the opportunity to record +50% profit as of now.
But this is not the end, let's analyze the current situation on the ETHUSD chart
For today, there is still a chance of a minimal ETH price correction, but preferably not deeper than $1550,
Well, then the continuation of the upward movement of the Ethereum price, towards the goals we indicated 3 weeks ago. They are relevant and as of today - they are $1750 and $2000
In this liquidity zone $1750-2000, it is better to fix part of the long positions and take a look around, which will generally be moods on the crypto market at that time.
In this liquidity zone there will be two important battles: between buyers and sellers of ETH and between your cold mind and greed :)
And also look at our ideas on Tradingview for at least the last month, you can find a lot of interesting things there to suit your "taste")
_______________________________
Since 2016 , we have been analyzing and trading the cryptocurrency market.
We transform our knowledge, trading moods and experience into ideas. Each "like under the idea" boosts the level of our happiness by 0.05%. If we help you to be calmer and richer — help us to be happier :)

#ETH: LOOK GOOD TO LONG!!Hi guys, This is CryptoMojo, One of the most active trading view authors and fastest-growing communities.
Consider following me for the latest updates and Long /Short calls on almost every exchange.
I post short mid and long-term trade setups too.
Let’s get to the chart!
I have tried my best to bring the best possible outcome to this chart, Do not consider it a financial
ETH UPADTE
ETH is forming this bullish pennant pattern we can long after the confirmed breakout of this pattern with SL: If any candle closes below the lower support of this pattern
I would also love to know your charts and views in the comment section.
Thank you

eth looks donenew moon has arrived and eth may have topped out
correction fits nicely in this channel and w5/wave C target has been hit using the subwave impulse

⚡️ETH 4HR CHART UPDATE⚡️Hello, traders welcome you all to this exclusive ETH 4hr chart update.
If you find my updates helpful and productive, hit the like button follow and comment your view in the comment section, this motivates me to bring this kind of update regularly.
Let’s look into the chart,
As we can see that according to our previous update ETH moving upside well, it bounce right from the lower trend line in support of the triangle pattern and gained above.
In the current scenario, ETH is trading on a support level and higher chance to grow above from current level until ETH holds this level.
Candle close below lower trend line support will lead ETH to drop down towards the lower trend green support level.
NOTE: If you find this update helpful, hit the like button and follow for this kind of regular update.
If you have anything to ask about this analysis you can ask in the comment section.
This is not financial advice. This is for education purposes only. I am not responsible for the profits or losses you generate from your investments.
DO YOUR RESEARCH BEFORE MAKING ANY TRADES.
Thank you.

⚡️ETH 4HR CHART UPDATE⚡️Hello, traders welcome you all to this exclusive ETH 4hr chart update.
If you find my updates helpful and productive, hit the like button follow and comment your view in the comment section, this motivates me to bring this kind of update regularly.
Let’s look into the chart,
As ETH is trading inside a rising parallel channel for the last 46days it got rejected from upper trend line resistance and continuously dropped downside after breakdown to the green support level of $1660.
In the current scenario, ETH heading towards the lower mid-trend line support which ETH needs to hold to regain upright, candle close below trend line support will lead ETH to drop to a lower green support level of $1450.
If it breaks down the lower trend line support then it can move down to the lower support zone.
Let’s see how the price reacts in the upcoming hours.
Here we need a trend reversal to go long until then stay aside and wait for the right time to get in.
NOTE: If you find this update helpful, hit the like button and follow for this kind of regular update.
If you have anything to ask about this analysis you can ask in the comment section.
This is not financial advice. This is for education purposes only. I am not responsible for the profits or losses you generate from your investments.
DO YOUR RESEARCH BEFORE MAKING ANY TRADES.
Thank you.

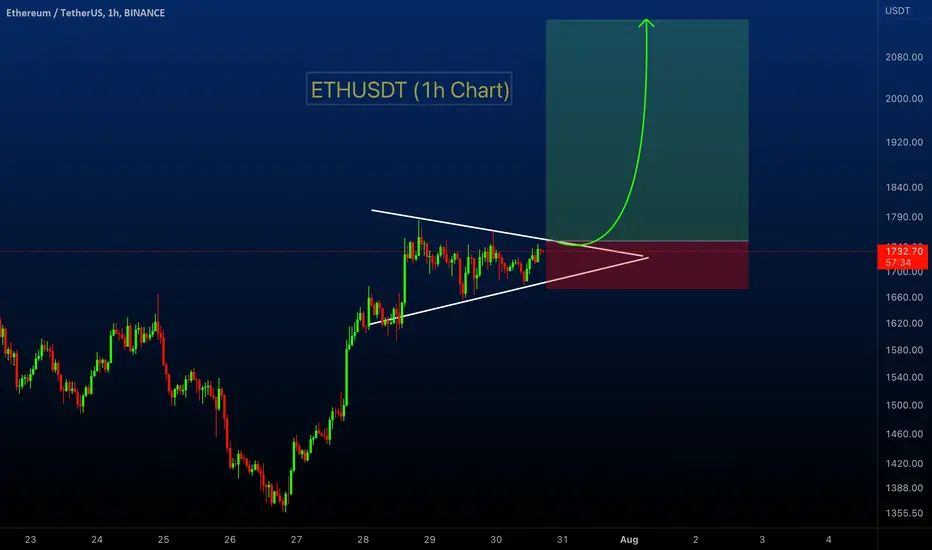
ETHUSDT Forming Flag/Pennant Pattern!!ETHUSDT (1h Chart) Technical analysis
ETHUSDT (1h Chart) Currently trading at $1734
Buy level: Above $1745 (Buy after breakout)
Stop loss: Below $1670
Target 1: $1780
Target 2: $1875
Target 3: $2000
Target 4: $2150
Max Leverage 3x
Always keep Stop loss
Follow Our Tradingview Account for More Technical Analysis Updates, | Like, Share and Comment Your thoughts
ETH: Should hold this support!!Hi guys, This is CryptoMojo, One of the most active trading view authors and fastest-growing communities.
Consider following me for the latest updates and Long /Short calls on almost every exchange.
I post short mid and long-term trade setups too.
Let’s get to the chart!
I have tried my best to bring the best possible outcome to this chart, Do not consider it a financial
ETH breakout this flag pattern but it is currently at the resistance let's see if it will be able to break out this resistance or not.
I would also love to know your charts and views in the comment section.
Thank you

#ETHUSDT: Will we keep falling?Hi guys, This is CryptoMojo, One of the most active trading view authors and fastest-growing communities.
Consider following me for the latest updates and Long /Short calls on almost every exchange.
I post short mid and long-term trade setups too.
Let’s get to the chart!
I have tried my best to bring the best possible outcome to this chart, Do not consider it a financial
On the chart we can see the descending channel, in which the price broke through upwards for the first time and is trying to consolidate above the level, earlier this boundary was worked out by the price very clearly and the price reacted strongly to it.
We can see that there is a battle for the side in the 1500-1600 area, either the bears or the bulls.
My guess is that the bears may prevail and bring the price back under the 1438 level, as there are no hints that the price will rise yet. The short-term target is support at 1438 and the medium-term target is the border of the lower range at 1264.
This chart is likely to help you make better trade decisions if it does consider upvoting it.
I would also love to know your charts and views in the comment section.
Thank you

ETH is heading towards its next support - 1H chartBINANCE:ETHUSDT is continuing its downward momentum.
the next target for BINANCE:ETHUSDTPERP is at-least 1286$
Once it reaches the 1286 range we can expect a next major decision at that range.
We can make our next trade base on how whether it bounces back or continues its downward momentum.
Follow for more free analysis.
VA

#ETH/USDT TRADE SUTUP Hi guys, This is CryptoMojo, One of the most active trading view authors and fastest-growing communities.
Consider following me for the latest updates and Long /Short calls on almost every exchange.
I post short mid and long-term trade setups too.
Let’s get to the chart!
I have tried my best to bring the best possible outcome to this chart, Do not consider it a financial
ETH looks good But in a shorter time frame.
Entry range:-CMP AND ADD MORE UP TO $1508
Target:- %30
SL: CLOSE LONG POSITION if ETH breaks down this lower support
Lev:- 20x to 10x
This chart is likely to help you make better trade decisions if it does consider upvoting it.
I would also love to know your charts and views in the comment section.
Thank you

ETH USD ETHEREUM printing a W formation on weekly chart
There a opportunity of short to the neck line
.
.
RISK DISCLOSURE: The Information provided on, from or through this channel is general in nature and is solely for educational purposes. The generic market recommendations provided by us are based solely on our personal judgment and should be considered as such. You're advised to enter into any transactions relying on your OWN judgment. Any market recommendations provided by us are generic only and may or may not be consistent with the market positions or intentions of our channel and/or our affiliates. Any opinions, news, research, analyses, prices, or other information contained on this channel are provided as general market commentary, and do not constitute an investment advice. All information contained herein should be independently verified and confirmed. We are not register anywhere. We do not accept any liability for any loss or damage whatsoever caused in reliance upon such information or services. Please be aware of the risks involved with any trading done in any financial market. Do not trade with money that you cannot afford to lose.

ETHUSDT 4h ANALYSISETHUSDT 4h Analysis
ETHUSDT raised the order block support, and the upward trend is very strong.
Even if it does not follow the upward trend, there is a very high probability that it will rise with support from the Order Block right below.

ETH: Is at resistance!!Hi guys, This is CryptoMojo, One of the most active trading view authors and fastest-growing communities.
Consider following me for the latest updates and Long /Short calls on almost every exchange.
I post short mid and long-term trade setups too.
Let’s get to the chart!
I have tried my best to bring the best possible outcome to this chart, Do not consider it a financial
#ETH UPDATE
Update: ETH form this big channel in 2d time frame.
Currently, ETH is facing two resistance one is this horizontal resistance and the second this the middle of this channel.
ETH need to break this resistance if it reject then it will go test $1280.
Let’s see how the market will react.
Let me know in the comments. Do show your support with your likes and if you don't want to miss any updates then follow my channel.
This chart is likely to help you make better trade decisions if it does consider upvoting it.
I would also love to know your charts and views in the comment section.
Thank you

🔃✅💲Short term reversal for $ETH confirmed! #Ethereum 🚀🔜✅This chart is meant to show the confirmation of the reversal in the $ETH price. This is shown on the BYBIT:ETHUSDT chart, because of the higher (more speculation based) trading volume. It is currently showing strong confidence in traders for #Ethereum.
As shown, during the downtrend that $ETH has been in, there were multiple closes below the lower Bollinger band. These each signaled further $ETH price suppression at the time. After finding a possible bottom, then ranging sideways in what is now the current range of support, $ETH price finally broke out above the top of the range. This is very likely due to a short squeeze, however I believe that it being in conjunction with the recent bounce in $BTC and other cryptos, has allowed for confidence to be restored in $ETH price growth(at least for the short-term). Breaking above the range, with very tightened Bollinger bands, $ETH price managed to close above the upper Bollinger band multiple times. This is the first time this has happened on the daily chart since we had one (very brief) close above it, in October last year. To me this signals a (possibly very strong) reversal for #Etherem.
Going forward, I would personally expect a move up to the current strong resistance level around $2,100-$2,200, then a retest of the previous range-high/resistance, flipped to support. After that would be when I would assess everything to see if this confirmation truly has the merit that I personally believe it has.
Any strong close above $2,500 would be a very strong confirmation of this theory, and a close below $1,100 would possibly invalidate this whole theory.
**This is all my opinion, based on chart data. This is not financial advice.**

#ETH/USDT UPDATE!!Hi guys, This is CryptoMojo, One of the most active trading view authors and fastest-growing communities.
Consider following me for the latest updates and Long /Short calls on almost every exchange.
I post short mid and long-term trade setups too.
Let’s get to the chart!
I have tried my best to bring the best possible outcome to this chart, Do not consider it a financial
#ETH UPDATE
Update: ETH lately, showed some greens which were suitable for the market. The current scenario of ETH is under a bullish expanding triangle which technically is bullish. It is testing the resistance at $1240. This is quite a decisive moment for ETH. If it successfully breaks and closes above the resistance level then we can expect some good rally. But if it gets rejected from the resistance, the trend will get reversed and we may see some drops.
Fundamentals: ETH is having a conference meeting on the 19th of July 2022. The Ethereum Community Conference (EthCC) is the largest annual European Ethereum event focused on technology and community.
What is your opinion about ETH? Do you think it will rally higher or will it drop badly?
Let me know in the comments. Do show your support with your likes and if you don't want to miss any updates then follow my channel.
This chart is likely to help you make better trade decisions if it does consider upvoting it.
I would also love to know your charts and views in the comment section.
Thank you

ETH: Should hold this support!!Hi guys, This is CryptoMojo, One of the most active trading view authors and fastest-growing communities.
Consider following me for the latest updates and Long /Short calls on almost every exchange.
I post short mid and long-term trade setups too.
Let’s get to the chart!
I have tried my best to bring the best possible outcome to this chart, Do not consider it a financial
#ETH UPDATE
ETH is forming this symmetrical triangle pattern and currently, it is bouncing from the lower support of this triangle pattern but we have $1075 to $1090 as a local resistance.
if break down this lower support of this triangle then the chart will be invalided.
This chart is likely to help you make better trade decisions if it does consider upvoting it.
I would also love to know your charts and views in the comment section.
Thank you
