ETHUSD: Wait confirmation before enter shortWe wait a break of uptrend line before go short. A descending channel in formation
Ethusdtrade

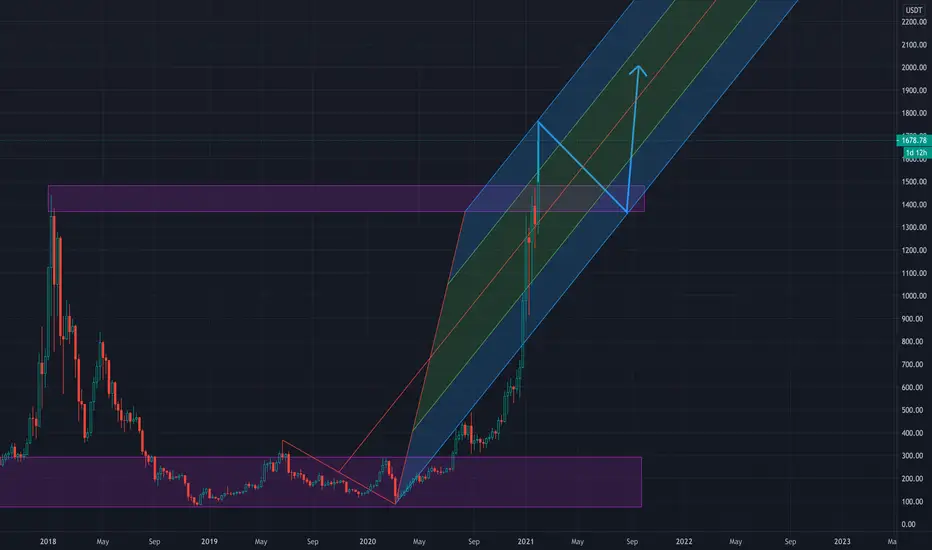
ETHUSDT - accumulation cyclePreconditions:
- accumulation
- key level
- buy after break out
- global uptrend
- local uptrend
You will learn the best place where we can trade this instrument at low risk.
Write in the comments all your questions and instruments analysis of which you want to see.
Friends, push the like button, write a comment, and share with your mates - that would be the best THANK YOU.
P.S. I personally will open entry if the price will show it according to my strategy.
Always make your analysis before a trade

ETHUSD Broke Nearest Resistance (1880.00)Price testing this level as support now. In my opinion ETH can pull back and continue uptrend. If this will happen, we will have good chance to open long position. Next resistance (2045.00) can be our target.

ETHUSDT - new accumulation cycleHow about this?
And bitcoin will go down then.
it's all fantasy.
Or reality?
Y ou will learn the best place where we can trade this instrument at low risk.
Write in the comments all your questions and instruments analysis of which you want to see.
Friends, push the like button, write a comment, and share with your mates - that would be the best THANK YOU.
P.S. I personally will open entry if the price will show it according to my strategy.
Always make your analysis before a trade

ETHUSDT - buy the dip I don't understand why we have to fall.
I don't understand why we have to grow.
It's better not to open trades at times like this.
Newly printed money is a reason for growth.
I think we will grow.
You will learn the best place where we can trade this instrument at low risk.
Write in the comments all your questions and instruments analysis of which you want to see.
Friends, push the like button, write a comment, and share with your mates - that would be the best THANK YOU.
P.S. I personally will open entry if the price will show it according to my strategy.
Always make your analysis before a trade

ETHUSD Shorting OpportunityComment Below your opinions.
Follow for more daily forex content and education.
Good luck to you!
Don't forget to like and share, it really helps.
Stay tuned.
This is just an idea, not financial advice

💰ETHUSDT - waiting growthAbove is the local resistance level of $1590.
At the bottom there are two levels from which we can expect the reaction of the buyer - $1440 and $1512.
You will learn the best place where we can trade this instrument at low risk.
Write in the comments all your questions and instruments analysis of which you want to see.
Friends, push the like button, write a comment, and share with your mates - that would be the best THANK YOU.
P.S. I personally will open entry if the price will show it according to my strategy.
Always make your analysis before a trade

ETHUSDTLet's see what happens.
Whoever agrees or disagrees, kindly share your views in the comment box.


ethusdHi, I am Milad Ekrami. We have found this ceiling considering our trading style, and surely this area will be touched.

25/2/2021 ETHUSDT Might sky rocket but there is a cautionBINANCE:ETHUSDT Today I'm come up with an ETHUSDT analysis.
First of all, I want to say that last 3 days were bad day for Crypto market
but I guess this is a good time for buying crypto currencies and here is why (base on ETHUSDT)
1D chart
As you can see this is the first time in three month that the day candle touch EMA24 since 23 DEC 2020 and at that time after the touching the price was sky rocket.
It also forming pinbar with lower volumn
1h chart
In one hour chart Boilinger band and Stoch which are showing votility and momentum are oversold and also make a higher high so I think there are posibility that the price are about to get back up
Caution
The ADX indicator showing that barish trend power is increasing so in my point of view
there is still a posibility that the price will continuously drop if the next few day it can't close higher than 1687.36
ps. this is my 3rd public analysis so sorry if this is not accurate :)

ETHUSDT fall after reaching resistance zoneThe price is in bullish trend now but it will fall when touches the resistance line.
If it crosses the resistance line forming a stable candle then the price enter into the channel again.
Make sure you should exit when the price touches the resistance zone and form bearish candle.

ETHUSDT - buy the dip the price has come to the zone of interest!
33% correction or discount.
Did you have time to buy it?
You will learn the best place where we can trade this instrument at low risk.
Write in the comments all your questions and instruments analysis of which you want to see.
Friends, push the like button, write a comment, and share with your mates - that would be the best THANK YOU.
P.S. I personally will open entry if the price will show it according to my strategy.
Always make your analysis before a trade

ETHUSDT the beginning of the cascade for further growth ETHUSDT the beginning of the cascade for further growth
❤️ If you find this helpful and want more FREE forecasts in TradingView
. . . . . Please show your support back,
. . . . . . . . Hit the 👍 LIKE button,
. . . . . . . . . . . Drop some feedback below in the comment!
❤️ Your Support is very much 🙏 appreciated!❤️
💎 Want us to help you become a better Forex trader?
Now, It's your turn!
Be sure to leave a comment let us know how do you see this opportunity and forecast.


Bitcoin vs Ethereum - fractal 2020 and now.Do you think history will repeat itself?
Push like if you think this is a useful idea!
Thanks for your support!

Short correction, temporalWe have three downside factors for short correction to the support level:
-Negative divergence at high times
-Khrvj of the wedge
- Out of the temporal dimension in descending order
In case of reaching the level and the two specified points, it is the purchase and entry position, and after that, start climbing and registering a new ATH.


ETHUSDT continued growth to the level of 2000ETHUSDT continued growth to the level of 2000
✅ If you like my analytics bet 👍
Subscribe to keep abreast of my predictions.
I would also be glad to see your comments under the idea, what do you think about this

ETHUSDT - two scenarioI'm thinking more of a short position.
The long scenario is relevant.
I need more confirmation for a long position.
Push like if you think this is a useful idea!
Before to trade my ideas make your own analysis.
Write your comments and questions here!
Thanks for your support!

ETHUSDTIt seems the next wave on eth is begining :D
and pullback is on board and u can get a good profit on it if it stays above the zone ;)
