ETHUSDTDue to the failure of the uptrend in the weekly time frame, its value will decrease to $ 1900
Ethusdtshort

ETHUSDTWe want to sell ETH but in the right place when others try to buy fakeouts ... keep watching what's going on... if you are losing money this retrace is a good place to exit buy orders .
BINANCE:ETHUSDT

Neutral#signal
#ETH
#ETHUSDT
Wait for failure and act with it 👌
If the failure scenarios are clear from above.
If it breaks from the bottom, the scenarios are clear, but in the past, Atrium has usually failed due to these situations, so consider this as well.

LONGHi guys, it seems that Atrium is moving in the ascending canal and after flooring in the canal floor, the primary target is the canal midline.

#ETHUSDT looks imminent for $6k Here's Why!Welcome to this another Update on ETHUSDT.
In my last update when I posted the buy signal around $3800. It rallied to almost $4800+.
This dip was a blessing.
ETH Chart looks really simple!
Can you call it bearish? I don't know your bias! I just don't see any bearish signs yet.
It's a classic Cup and Handle Breakout with the most important support around $3.8k and a local resistance around $4.5k!
The lowest we can expect is $3870 where I have placed a ton of buy orders.
Almost 14% of my portfolio is in ETH and will stay that way.
The pattern gives us a $6k+ Target by the end of this year.
Do you think it's possible?
Or, do you think we will see more corrections?
Do hot the like button if you want me to keep this chart updated and share your views in the comment section.
Thank you
#PEACE

ETHUSDT , Becareful if you are in sell position Hello everybody
In here , According to trend we expect that the price can support in first supp and can rise the price
If the market cant support the price in first supp it can drop to other support that shown on chart
Guys please becareful and dont take any position without taking signal in lower time frame
I think everything is shown on chart and there is nothing to explain but if you guys need any help send me messages
Previous analysis :
Good Luck
Abtin

Ethereum can be dead There is a breakdown from a triangle pattern as if it breaks down from the pattern we can see ethereum support at 100 moving average which is a very important support for ETH, If it fake its breakdown from this triangle we can see the above breakout for Eth and it can grow at a higher rate

Ethereum price analysis * Ethereum in 1D time frame is moving in a Ascending channel or Rising Channel pattern
* Rising channel appears when the price moves between two parallel ascending trendlines. forming higher-highs and higher-lows.
* To continue the uptrend Ethereum needs to move within the channel.
* If the price breaks the below trendline support we can expect a drop till $4450 support and a bounce back


ETH/USD Upcoming MoveThis head and shoulders is about to play out and we're going to go down and re-test the breakout of the macro triangle. I can tell because of the bearish divergence on the 4 hour on Market Cipher B - bearish head and shoulders always have this kind of divergence between the left shoulder and head. Here are the places that we will bounce on the way down

Retrace would be healthy ETH is at the top of raising channel
Momentum is down, so I am entering short here

ETHUSDT RIP Crypto , what a joke. wait for it. im gonna laugh till end
also you retards think its about choosing side , bullish , ...
BUT SADLY
RIP MARKET.
Now Have FUN with This Abyss.
The New Moon is Coming , Also NEW CYCLE.
11/4/2021 , The End of Trend.


#ETHUSDT to $6,275 ? , Massive Pattern BrokeoutWelcome to this quick update, everyone.
ETHUSDT looks really bullish here.
I know the market looks scary here but this chart says otherwise.
The Cup and Handle pattern has broken out.
If the upcoming weekly closes above the 42k level it's highly likely we will see a 6k+ ETH by the end of this year.
just to clear your doubt:- There's always a shakeout before every big rally and I believe the current market is in that situation.
We can have some long wicks to the downside which will eventually be bought by the bulls.
The target of this pattern is $6275 roughly a 55% Rally.
21D MA is the indicator that you need to follow for the invalidation of this chart.
Any close below 21D MA will either invalidate or delay this rally.
This is not financial advice, DYOR before taking any trading action.
What do you think about this chart?
Do hit that like button and share your views in the comment section.
Thank you
#PEACE

ETHUSDT , We are in buy zone ...Hello guys
According to our previous analysis , the market moved exactly to our way
At this time from the past we are in upward channel and we are near the base trendline and we need to take signal and watch carefully to take signal and take position and buy
Maybe it can break the base of trendline like BTCUSDT chart that we published but its not have high chance for it
Previous analysis :
Dont forget use stop loss and attention to money management
Be with us and sleep comfortably
Good Luck
Abtin

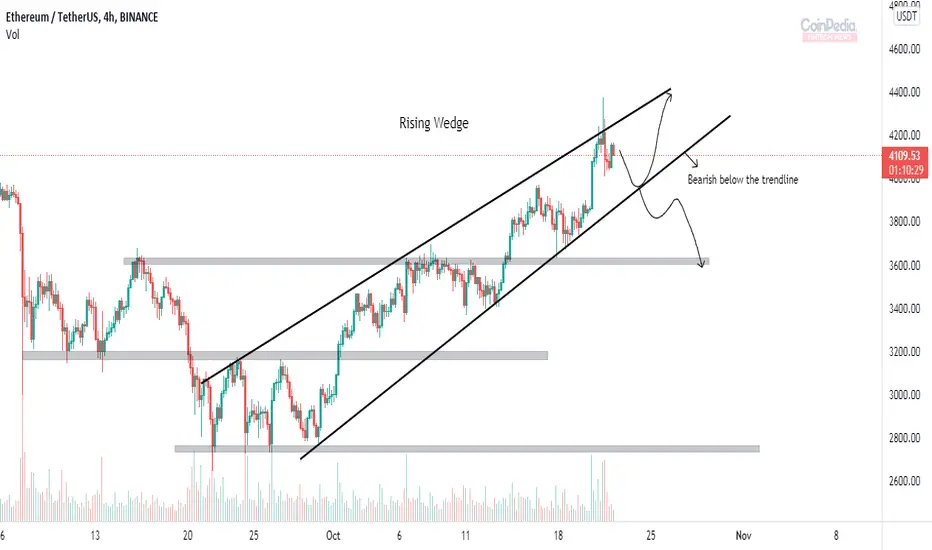
Rising wedge pattern in Ethereum* Ethereum in 4H time frame appears with Rising Wedge pattern.
* Rising wedge occurs when the price moves between two trendlines forming higher-highs and higher-lows. The lower trendline works as support for the price and the upper trendline works as resistance.
* Rising wedge appears with wide bottom and as the price moves higher the range becomes narrow.
* Ethereum can test the lower trendline ( support ) and bounce back, but if it break the support we can expect a drop till below support zone.

ETHUSDTEthereum is making a head and shoulder pattern and also there is a cross in Ichimoku indicator

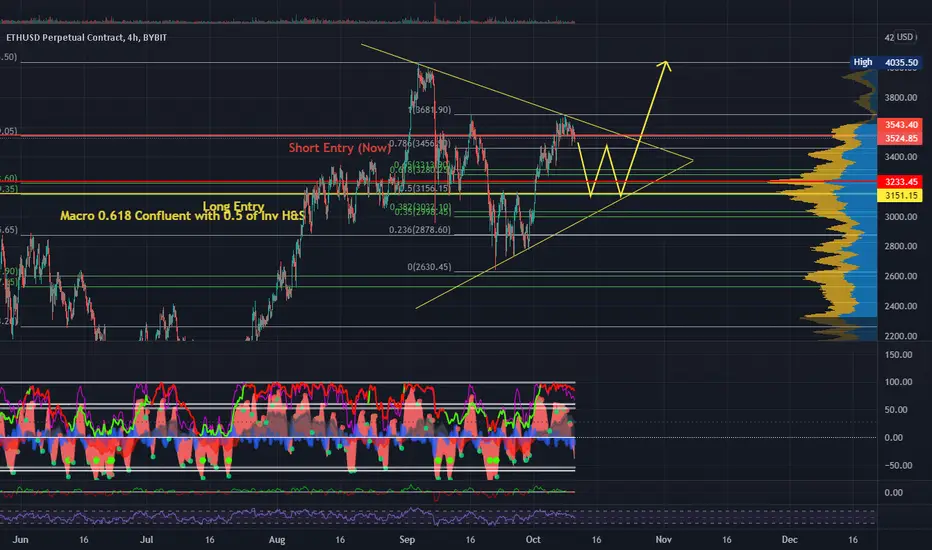
My ETH/USD Plan - Short Now, Long LaterWe are currently rolling over after hitting the neckline of this inverse head and shoulders. We will create the right shoulder and reverse to the upside when price hits the macro 0.618 which is perfectly confluent with the 0.5 level of the inverse head & shoulders. Any proper inverse head and shoulders should never pass the 0.5 line with the shoulders and the macro 0.618 reinforces the heavy support in that area along with the lower trendline. I'm currently short from the 0.786 line (marked in red) and I will take profits and enter a long at the yellow line. I'm expecting a mirror image from the other side, so the right shoulder should look something like a W/double bottom.
ETH re-distribution phaseAfter checking ETH and again compairing with BTC roundtrip prediction we can expect short moves for next days.
Also indicators and supports/resistances confim those moves.

#ETHUSDT Looks ready for another rally after the retest!!Welcome to this quick Update, everyone.
If you are reading my updates for the first time do follow me to get more complex charts in a very simplified way.
I also post altcoin setups on Spot, Margin, and Futures.
ETHUSDT Looks promosing here,
Broke out of the channel .
I personally accumulated ETH around $2900 and holding on low leverage.
I expect some retracement here $3045 to $3185 and then continuation.
Upper resistance levels are:-
$3333
$3325
$3615
$3900
IF ETH IS ABLE TO BREAK THE 4K AREA AGAIN, IT'S HIGHLY LIKELY WE WILL SEE A NEW ATH!!
What's your thought on this?
Do you think this correction is over?
Do you think ETH could easily pump from here?
Do hit the like button if you like this update and share your views in the comment section.
Thank you
#PEACE

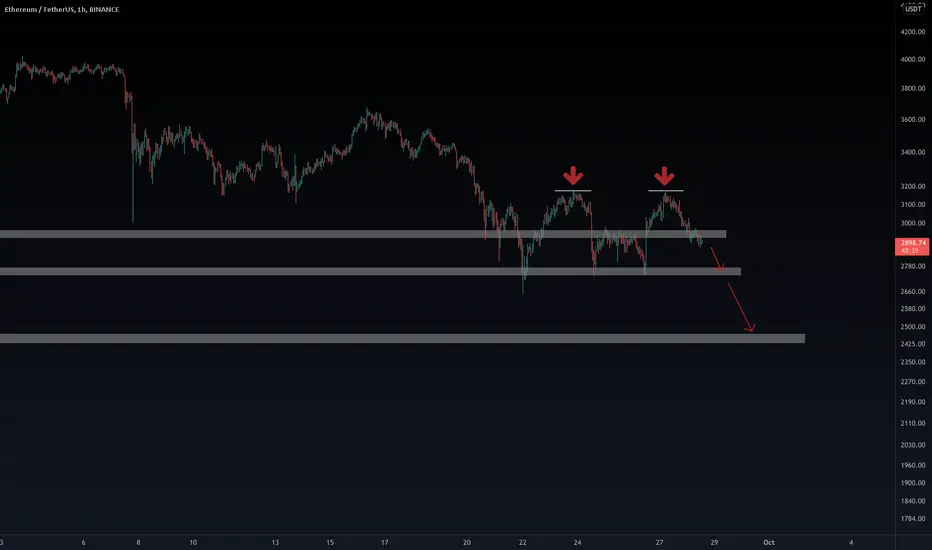
Ethereum- Sell for a break of supportSince the recent 4k top, EthUsd is in a downtrend
In the last 10 days, the cryptocurrency has traded in a range between 3200 and 2750, and, in my opinion, the break will be to the downside.
3200 acts like strong resistance at this point and only price above this figure would mean that the trend has changed
My targets for short selling are 2750 followed by 2300 zone

Cryptocurrencies, Bitcoin, Daily Chart, Trading Signal, BTC,ETHETH Double top and under the all important $3k mark…
Those itching to short can target $2750 and possibly $2450