Bullish Butterfly Pattern (Daily)The Bulls have an opportunity to regain control from the Bears. Having entered on the right shoulder of the Bearish H&S pattern back on October 21st, the Bears have not quite hit their first target for the pattern.
The initial harmonic reaction to the Bullish Butterfly entry is a good sign for the Bulls, I would expect a retest of the entry before a further attempt to continue the Bullish move.
EU

Head & Shoulders Pattern - Entry 2 (Daily)The initial entry on the right shoulder of the pattern has not yet reached it's first target, having closed below the neckline the Bears now have confirmation for a second entry at the retest of the neckline.
The opportunity for the retest was created by the Bullish pressure of the Butterfly pattern linked to below.
Experienced traders should use the entries to hedge against each of the patterns. Closing 50% of each position at the opposing patterns entry will create risk free positions in both directions.

EURCHF Bullish trend ahead !Two patterns both bullish appeared on EURCHF
currency pair chart. T1-T2 for pattern wedge
and 3 dotted trendlines for pattern Sperandeo.
Green solid trendline is an expected movement
for next several days, also take in mind the
fibonacci levels . 50% Fibo (1.0705) will be the
first strongest resistance
Terms and short forms!
T - Trendlines (T1,T2... etc.)
S - Supprt levels (S1,S2... etc.)
R - Resistance levels (R1,R2... etc.)
TP - Take Profit
SL - Stop Loss
F - Fibo Levels (F23,F61... etc.)
Check out my next stream "Group from Moving averages based on Fibonacci numbers"
www.tradingview.com


RSI divergence on 4 hrsPrice is likely to reverse or pull back from 1.16500 due to RSI divergence at round figure. Target round figure of 1.1700 (weekly pivot which just 1.17144). Weekly pivot rarely get missed.

analysis EUhello traders, might be a potential sell in these area of 71 percent to 88 percent . It also have to do fill in that gap. But be aware of the election day, market will move up or down !

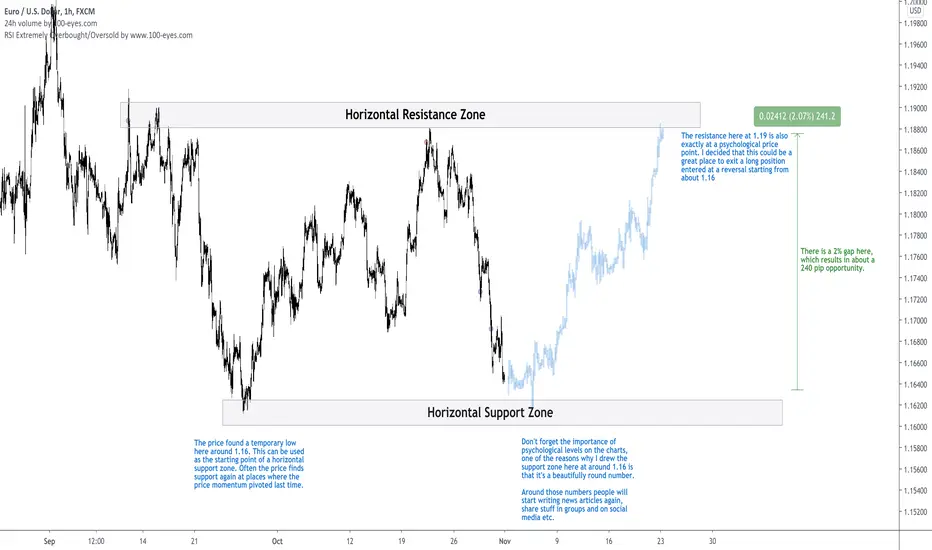
Support and Resistance - Most Important Zones for EUR/USDAll info can be found on the chart. DMs are open!
EURUSD 1H TRADING PLANI expect eur/usd to move very similar to how i have charted it out here, with a pullback then trend continuation. Final post! been a great 100 trades thousands of pips made! hope ive helped along the way! thanks for your support

EURUSD 1H TRADING PLANWALKTHROUGH AS SEEN IN CHART FOR RECENT EVENTS. brilliant week so far lots of pips in the bag over 500 and counting.
Bullish Deep Crab (4H)“ The Deep Crab pattern evolved from two patterns (invalid Bat patterns and a specific type of Crab pattern). It was developed by Scott Carney as a further refinement of the basic structure.
The Deep Crab is similar to the original Crab pattern, as it is a 5-point extension structure that utilizes exclusively a 161.8% XA projection for the defining level in the Potential Reversal Zone (PRZ).The difference can be found at the B point which must be an 88.6% XA retracement. In fact, the Deep Crab pattern usually possesses a B point that is beyond the 88.6% level but does not violate the initial point X.
The 88.6% B point requirement is special to the Deep Crab. When the structure is in the midst of completing the CD leg, the violation of the B point AND the X point typically creates a situation of severe price action. In essence, the price action is violating two important prior support or resistance points. When this happens, the result is frequently a sharp move that quickly extends to the 161.8% XA projection.
Another difference in the Deep Crab pattern is the AB=CD structure. The AB=CD pattern is a more important consideration in the Deep Crab, although the structure typically possesses the 127%AB=CD alternate variation it is common for these structures to possess equivalent AB=CD patterns in certain circumstances. ”

EURUSD outlookPrice covered the previous inefficiencies (a little bit left to the downside but no space to go short short-term).
I would look for temporarily long (countertrend). And then when we cover the existing inefficiency I would go short again.
Euro rarely leaves such inefficient moves behind. Whenever you see a series of long candles with no pullbacks (illiquid runs on low volume, as price "gaps through" in search for liquidity and once it hits counterparty that fills all the demand price slowly drains back to where it busted from) - be sure price will come back to fill them. This and more is explained in great detail on - protradersclub.com

Eu buyFrom 1.17950 or 1.17900 depending on candlesticks
Tp 1 30 pips
Tp 2 50 pips
For educational purposes only:)
Let me know what you think


Bearish ButterflyThe Butterfly pattern , is a harmonic pattern discovered by Bryce Gilmore using his Wave trader software program.
The pattern structure was further refined using specific Fibonacci levels by Scott Carney which he outlined in his book 'The Harmonic Trader', published in 1998.
The Butterfly pattern must include an AB=CD pattern to be a valid signal. In general, the AB=CD Pattern will possess an extended CD leg that is 127.2% or 161.8% of the AB leg.
Due to the hectic day on EU I am late in publishing this pattern. However, the Butterfly pattern much like the Crab is a reversal pattern and as such we should expect price to at the very least break below the pattern and potentially hit TP3 before the reversal concludes.
TP2 ...
TP3 ...

Bearish Bat Pattern 15mThe Bat Pattern , is a precise harmonic pattern discovered by Scott Carney in 2001
The pattern incorporates the 0.886XA retracement, as the defining element in the Potential Reversal Zone (PRZ).
The B point retracement must be less than a 0.618, preferably a 0.50 or 0.382 of the XA leg. The Bat utilizes a minimum 1.618BC projection.
In addition, the AB=CD pattern within the Bat pattern is extended and usually requires a 1.27 AB=CD calculation. It is an incredibly accurate pattern and requires a smaller stop loss than most patterns.
Due to the Hectic day on EU I am publishing this Pattern very late, the importance of this pattern is that I used it to enter the larger Butterfly pattern with a much smaller stop.
The Bat like the Gartley is a continuation pattern that will, upon completion, follow the trend.
The pattern has already hit all three TP's and I would expect the trade to continue further in line with the Butterfly pattern targets.
TP2:
TP3:

Bullish Shark Pattern (1H) Revised measurementsThe Shark Pattern was initially released in 2011 by Scott Carney in his Patterns into Profits course.
The pattern is the primary structure that precedes a 5-0 formation. This structure is outside the typical M and W framework. It possesses a unique formation called an Extreme Harmonic Impulse Wave that retests defined support/resistance while converging in the area of the 88.6% retracement – 113% extension of XC.
In all cases, the completion point must include the powerful 88.6% support/retracement as a minimum requirement. In addition, the unique extreme Harmonic Impulse Wave employs a minimum 161.8% extension of the BC leg.
This combination with the 88.6% retracement defines a unique structure that possesses two profound harmonic measures to define the minimum level. In many cases, the price action will retest the initial starting point of the pattern and define excellent opportunities to take advantage of a market that has moved to far too fast within a limited period of time.
This pattern frequently defines excellent opportunities but these reversals are often sharp and require specific management strategies to capitalize on the phenomenon. In many situations, the price action will retest the prior support/resistance level and typically result in a limited counter trend move.
The measurements are now IMO correct. If you entered a trade on the previously published shark pattern I would advise taking full profits either immediately or at the very latest the neckline of the Head & Shoulders pattern (1H) .
The new measurements reflect the current Head & Shoulders pattern in a more logically structured manner.

Bullish Shark Pattern (1H)The Shark Pattern was initially released in 2011 by Scott Carney in his Patterns into Profits course.
The pattern is the primary structure that precedes a 5-0 formation. This structure is outside the typical M and W framework. It possesses a unique formation called an Extreme Harmonic Impulse Wave that retests defined support/resistance while converging in the area of the 88.6% retracement – 113% extension of XC.
In all cases, the completion point must include the powerful 88.6% support/retracement as a minimum requirement. In addition, the unique extreme Harmonic Impulse Wave employs a minimum 161.8% extension of the BC leg.
This combination with the 88.6% retracement defines a unique structure that possesses two profound harmonic measures to define the minimum level. In many cases, the price action will retest the initial starting point of the pattern and define excellent opportunities to take advantage of a market that has moved to far too fast within a limited period of time.
This pattern frequently defines excellent opportunities but these reversals are often sharp and require specific management strategies to capitalize on the phenomenon. In many situations, the price action will retest the prior support/resistance level and typically result in a limited counter trend move.
Now the Head & Shoulders (1H) has reached beyond TP1 for the first entry, I expect price to retest the neckline for the second more conservative entry.
I will use this Bullish Shark pattern long entry to cover (hedge) my remaining short position from the H&S.
The target for the Shark falls within the zone for the H&S second entry.

Bullish Alternate Bat Pattern (15M)The Alternate Bat pattern is a precise harmonic pattern discovered by Scott Carney in 2003. The pattern incorporates the 113% XA retracement, as the defining element in the Potential Reversal Zone (PRZ). The B point retracement must be a 38.2% retracement or less of the XA leg. The Alternate Bat utilizes a minimum 200% BC projection. In addition, the AB=CD pattern within the Alternate Bat is always extended and usually requires a 161.8% AB=CD calculation.
I am publishing this idea late again due to the Hectic day on EU yesterday.
The Alternate bat like the Butterfly and Crab is a reversal pattern that should if not followed by a reversal pattern counter to its direction break above/below the pattern.
However in this instance I believe there to be a Bearish butterfly pattern being formed within the target levels of this pattern. I will attempt to publish this butterfly pattern prior to entry.
The confluence of factors, the Head and Shoulders (1H), the previous Butterfly (15m) should apply enough bearish pressure to stop the Alt Bat from reaching TP3 or even breaking above the pattern.

Bearish Butterfly Pattern (15M)The Butterfly pattern , is a harmonic pattern discovered by Bryce Gilmore using his Wave trader software program.
The pattern structure was further refined using specific Fibonacci levels by Scott Carney which he outlined in his book 'The Harmonic Trader', published in 1998.
The Butterfly pattern must include an AB=CD pattern to be a valid signal. In general, the AB=CD Pattern will possess an extended CD leg that is 127.2% or 161.8% of the AB leg.
As mentioned in the Alternate Bat pattern Idea, (linked below) this Butterfly pattern has formed within the target zone of the Alt Bat.
TP2:
TP3:

Bearish Head & Shoulders Pattern (1H)There are many interpretations of the Head & Shoulders Pattern.
After much research and back testing I have created a simple process using bespoke levels to objectively identify and trade the pattern.
Through extensive research into Harmonic patterns (in particular the Butterfly ) I have discovered how to accurately predict where the H&S pattern will occur.
The Butterfly Pattern Forms the structure of most H&S patterns.
