EUR/CHF:NEW FIBO SWING OPPORTUNITY|DOWNTREND|SHORT SETUP 🔔After our previous Idea with Take profits Reached , there is a new opportunity of trend trading continuations. The chart now show a new sideways area . We are waiting for a breakout to see the price definitely continue to fall down...
Check the Links on BIO and If you LIKE this analysis, Please support our page by hitting the LIKE 👍 button
Traders, if you like this idea or have your own opinion about it, please write your own in the comment box . We will be glad for this.
Feel free to request any pair/instrument analysis or ask any questions in the comment section below.
Have a Good Day Trading !
Eur-chf

BUY EURCHFHello, my fellow traders hope you all are making some profits. We are here with our new analysis so that we can increase those profits for you. Let’s get into it.
As we can see, the pair is inside DESCENDING CHANNEL and has made an INVERTED HEAD AND SHOULDER. Wait for the breakout
Let us know your views on this in the comment section. Thank you all.
There is good news for our followers. We will be analyzing on-demand.
So let us know which pair you want our analysis on, and we will get it for you. Do like and follow us.

UPDATE! EURCHF for a lower low 🦐EURCHF on the 4h chart moved as expected.
The price broke below the strong support and retest it with a retracement move to the 0.382 Fibonacci level.
Currently, the market is moving to the minor support and according to Plancton's strategy if the price will break below we can set a nice short order.
–––––
Follow the Shrimp 🦐
Keep in mind.
• 🟣 Purple structure -> Monthly structure.
• 🔴 Red structure -> Weekly structure.
• 🔵 Blue structure -> Daily structure.
• 🟡 Yellow structure -> 4h structure.
• ⚫️ Black structure -> >4h structure.
Here is the Plancton0618 technical analysis , please comment below if you have any question.
The ENTRY in the market will be taken only if the condition of the Plancton0618 strategy will trigger

COT CURRENCY REPORTAUD, NZD & CAD:
It’s important to keep in mind that since the RBNZ meeting took place on Tuesday, we won’t see a lot of the upside in the currency we had this past week reflected in the CFTC data as yet. After the hawkish tilt by the bank as well as the solid beat in Q2 CPI data, expectations for hikes this year have risen substantially, and barring any major risk off tones we would expect a favourable environment for the NZD going into the August meeting.
For the CAD, the fact that we it was one of the biggest position unwinds makes a lot of sense, as it shared a similar fate with the other two biggest net long currencies among the majors (EUR and GBP). The bias for the CAD remains tilted to the upside, but with a lot of the positives already reflected in the price, it will take a lot more positive news to see more meaningful upside in the currency.
For the AUD, the virus situation is a negative driver to keep on the radar. Two of the largest cities in the country is already in snap-lockdowns, and further aggravation of the situation could develop into a key sentiment driver in the short-term, so definitely one to watch.
JPY, CHF & USD:
The JPY saw quite a sizeable lift in terms of positioning, with another big batch of short positions being dumped. The hefty increases in short-term positioning over the past few weeks was arguably driven by the fundamental outlook, partly driven by summer liquidity ramping up carry trade activity.
Thus, the currency is always going to be vulnerable to see some of that unwind, especially when we have bouts of risk off flows as we’ve seen occur over the past two weeks.
For the US Dollar, as the fundamental bias remains neutral and as we are well within the summer liquidity period, the main driver for the USD has been the incoming economic events as expected. This past week we had Fed Chair Powell’s testimony where his persistent dovish tone, despite rising inflation data, saw some minor downside in the greenback, but retail sales also saw some additional excitement.
This week will be a very quiet one for the Dollar in terms of events, so be on the lookout for Fed speak, and also keep track of the overall risk sentiment.
GBP:
Doves turning into hawks. This past week saw some very interesting comments coming out from the more dovish leaning members of the BoE, with BoE’s Saunders paving the way expectations that the bank could announce an early end to their QE program at their next meeting.
This saw decent upside in Sterling, as it confirmed the market’s ongoing expectations that the BoE will be reducing accommodative policy in the weeks ahead, but also due to the fact that these hawkish comments came from a dovish member of the bank.
This week we look to comments from BoE’s Haskel who is considered as the most dovish member of the bank. If he paints a similar picture to that of Saunders, the markets will arguably be quick to price in a tapering announcement for the upcoming meeting.
Keep in mind the upside in Sterling occurred at the latter part of the week which means the CFTC data does not reflect it. The big reduction in net-longs is in line with more unwind in the biggest net-long positions versus the US Dollar.
EUR:
Despite the big reductions we’ve seen in EUR net-long positioning, the currency remains the biggest net-long position versus the greenback among the majors. With the Dollar’s fundamental outlook turning more neutral, the outlook for the EUR remains tilted to the downside.
Majority of the upside in the EUR from expectations about a EU economic recovery going in Q3 was already reflected in the price before the recent FOMC meeting, which left the EUR exposed to lots of downside from a positioning point of view.
Even though the bias for the EUR remains weak bearish, the amount of one-sided price action post the June FOMC meeting has seen the currency lose a lot of ground, which means we do want to be mindful of some reprieve from some possible mean reversion.
This week we have the July policy meeting which was made more important by comments from ECB President Lagarde who stated that markets can expect updated forward guidance at the meeting in line with their new strategic framework, even though Friday sources pieces suggest otherwise.
*This report reflects the COT data updated until 13 July 2021.

EUR/CHF - ShortPotential for a short on EURCHF
Technicals:
- Rejection at previous support and resistance of descending channel (both highlighted yellow)
-In line with the current down trend
- Bearish confluence among indacotrs
- Rejection at 0.5 fib level

EURCHF could have the potential to reverse up from here!Watch out for the turn if any!
Hello there!
If you like my analysis and it helped you ,do give me a thumbs ups on tradingview!
And if you would like to show further support for me, you can gift me some coins on tradingview!
Thank you!
Disclaimers:
The analysis shared through this channel are purely for educational and entertainment purposes only. They are by no means professional advice for individual/s to enter trades for investment or trading purposes.
The author/producer of these content shall not and will not be responsible for any form of financial/physical/assets losses incurred from trades executed from the derived conclusion of the individual from these content shared.
Thank you, and please do your due diligence before any putting on any trades!
💡Don't miss the great buy opportunity in EURCHFTrading suggestion:
". There is a possibility of temporary retracement to the suggested support line (1.0833).
. if so, traders can set orders based on Price Action and expect to reach short-term targets."
Technical analysis:
. EURCHF is in a range bound, and the beginning of an uptrend is expected.
. The price is below the 21-Day WEMA, which acts as a dynamic resistance.
. The RSI is at 69.
Take Profits:
TP1= @ 1.0848
TP2= @ 1.0861
TP3= @ 1.0884
TP4= @ 1.0907
TP5= @ 1.0921
SL= Break below S2
❤️ If you find this helpful and want more FREE forecasts in TradingView
. . . . . Please show your support back,
. . . . . . . . Hit the 👍 LIKE button,
. . . . . . . . . . Drop some feedback below in the comment!
❤️ Your support is very much 🙏 appreciated!❤️
💎 Want us to help you become a better Forex / Crypto trader?
Now, It's your turn!
Be sure to leave a comment; let us know how you see this opportunity and forecast.
Trade well, ❤️
ForecastCity English Support Team ❤️

💡Don't miss the great buy opportunity in EURCHFTrading suggestion:
". There is a possibility of temporary retracement to the suggested support line (1.0833).
. if so, traders can set orders based on Price Action and expect to reach short-term targets."
Technical analysis:
. EURCHF is in a range bound, and the beginning of an uptrend is expected.
. The price is below the 21-Day WEMA, which acts as a dynamic resistance.
. The RSI is at 69.
Take Profits:
TP1= @ 1.0848
TP2= @ 1.0861
TP3= @ 1.0884
TP4= @ 1.0907
TP5= @ 1.0921
SL= Break below S2
❤️ If you find this helpful and want more FREE forecasts in TradingView
. . . . . Please show your support back,
. . . . . . . . Hit the 👍 LIKE button,
. . . . . . . . . . Drop some feedback below in the comment!
❤️ Your support is very much 🙏 appreciated! ❤️
💎 Want us to help you become a better Forex / Crypto trader ?
Now, It's your turn !
Be sure to leave a comment; let us know how you see this opportunity and forecast.
Trade well, ❤️
ForecastCity English Support Team ❤️


BLACKHOLE SETUP we can see the same BLACKHOLE area was the the heavy buyers volume as a support
now we expect the same level become a strong resistance as i called BLACKHOLE RESISTANCE
as shown on the chart

EUR/CHF Bounce at key level supportEUR/CHF bounce at key level support. Wait for one swing low to confirm:
Momentum: Bullish divergence
Pattern: Bullish Flag
Price: TP at 1.10850. RR 1:2
Time: approximately 1 month to hit expected target price.

EURCHF Sell the flag.EURCHF - Intraday - We look to Sell a break of 1.0919 (stop at 1.0929)
Broken out of the channel formation to the downside.
Daily signals are mildly bearish.
Trading volume is increasing.
The previous swing low is located at 1.0921.
A break of bespoke support at 1.0920, and the move lower is already underway.
Price action is forming a bearish flag which has a bias to break to the downside.
Our profit targets will be 1.0889 and 1.0879
Resistance: 1.0945 / 1.0950 / 1.0970
Support: 1.0933 / 1.0920 / 1.0900

EUR/CHF Signal - CHF Foreign Currency Reserves - 7 Jul 2021EURCHF has found support today prior to the CHF Foreign Currency Reserves data, which shows the amount of foreign currency held in the SNB reserves. Technically the pair has found support and we anticipate upside as a mean reversion, into the 1.0955 level.

EURCHF testing a daily support 🦐EURCHF on the 4h chart has recently tested and rejected by the weekly resistance.
The price broke the minor ascending channel and now looking for a break of the support area.
According to Plancton's strategy if the price will break and retest the support we will set a nice short order.
–––––
Follow the Shrimp 🦐
Keep in mind.
• 🟣 Purple structure -> Monthly structure.
• 🔴 Red structure -> Weekly structure.
• 🔵 Blue structure -> Daily structure.
• 🟡 Yellow structure -> 4h structure.
• ⚫️ Black structure -> >4h structure.
Here is the Plancton0618 technical analysis , please comment below if you have any question.
The ENTRY in the market will be taken only if the condition of the Plancton0618 strategy will trigger

EUR CHF Scalp Longeur chf
after bouncing off 15 minute trendline we retest the zone range and reject with pinbar followed by a bullish engulfing candle we will scalp up
first confirmation bounce of trendline
second confirmation rejection wick from zone
third confirmation bull engulf candlestick
we long scalp

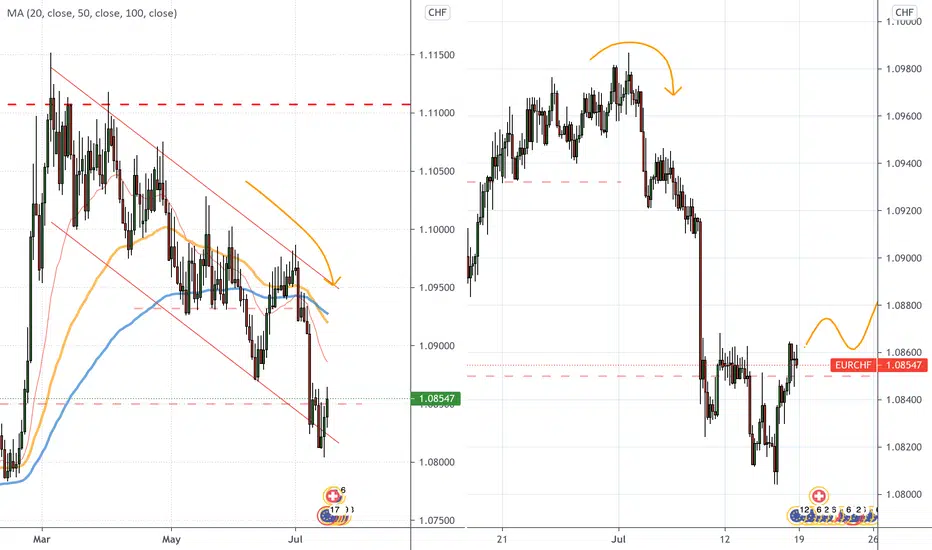
EURCHF looking for short 🦐EURCHF on the daily chart is moving in a long retracement channel.
The price after the test of the upper trendline has turned for a break of the support.
According to Plancton's strategy if the price will break and retest the support we will set a nice short order.
–––––
Follow the Shrimp 🦐
Keep in mind.
• 🟣 Purple structure -> Monthly structure.
• 🔴 Red structure -> Weekly structure.
• 🔵 Blue structure -> Daily structure.
• 🟡 Yellow structure -> 4h structure.
• ⚫️ Black structure -> >4h structure.
Here is the Plancton0618 technical analysis , please comment below if you have any question.
The ENTRY in the market will be taken only if the condition of the Plancton0618 strategy will trigger

EURCHF FXCM🌟another request for our generous donator, this pair has trapped in a descending channel and there is a good opportunity to get a 100 pip profit out of its movements ins SELL position
👉This idea has the confirmation of "advanced price action" 👍
👉For more information don't be shy and get in private chat of trading view 👍
👉Hit share and spread the information in public chats or your twitter for everybody to get profit 👍

EURCHF Globally, EURCHF is moving in an upward channel. We had tested the support level and bounced off of it. Locally, we are near the resistance line of the descending channel. The accumulation process is taking place here. I expect further growth and maybe the formation of a potential Head and Shoulders pattern.
Best regards EXCAVO

Strong & Weekness End Of 26 Jun 2021Time Frame D1 (Find your right pairing coming soon)
USD - Stroger
GOLD - Stoger
GBP - Medium
AUD - Medium
CAN - Medium
EUR - Weekness
CHF - Weekness


EUR/CHF Nice Buy SteupEUR/CHF is getting ready for a big up movement.
The down correction is done, now it is time to start buying for long term.
The buying target is the red line.


