EURNZD: Steep Channel continuation setupEURNZD continues to rise within a steep ascending channel, maintaining a well-structured sequence. No signs of exhaustion are evident yet, as bullish momentum remains strong and price action continues to respect both the midline and lower boundary of the channel.
This ongoing strength suggests that buyers remain in control, and unless we see a clear shift in structure, such as a break below channel support or loss of momentum, the trend remains intact.
🟢 Trend Bias: I remain bullish on EURNZD while price stays within this channel. Any pullbacks toward the lower channel boundary or previous breakout zones may offer continuation opportunities.
🎯 Target: My upside target is 1.983 , which aligns with the projected upper boundary of the ascending channel and makes a good technical target if the structure continues to hold.
🟥 Invalidation: A confirmed breakdown below the channel with follow-through would challenge this bias and signal the possibility of a deeper corrective move.
For now, the structure favors trend continuation over reversal.
Just sharing my thoughts on support and resistance, this isn’t financial advice. Always confirm your setups and manage your risk properly.
Disclosure: I am part of Trade Nation's Influencer program and receive a monthly fee for using their TradingView charts in my analysis.
EUR (Euro)

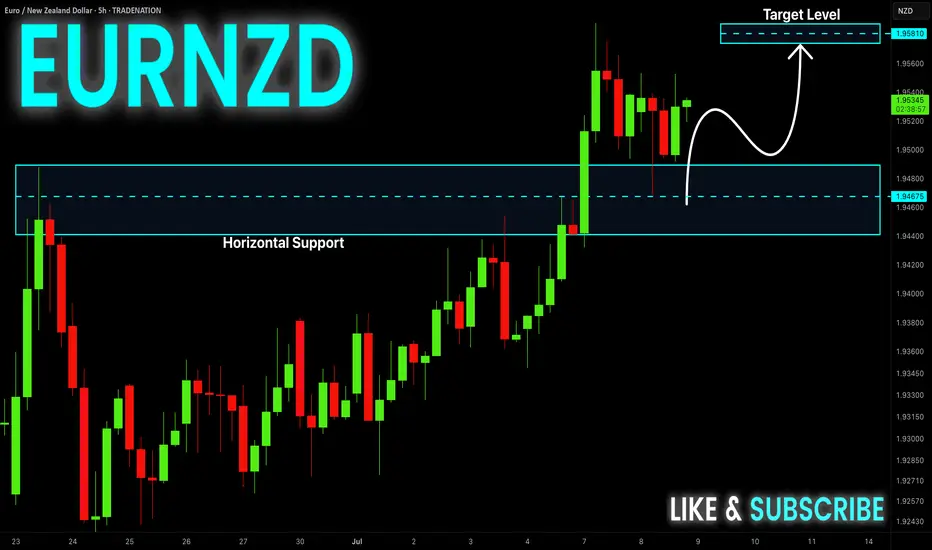
EUR-NZD Will Keep Growing! Buy!
Hello,Traders!
EUR-NZD keeps growing in a
Strong uptrend and the pair
Made a retest and a rebound
From the horizontal support
Of 1.9480 so we are bullish
Biased and we will be expecting
A further bullish move up
Buy!
Comment and subscribe to help us grow!
Check out other forecasts below too!
Disclosure: I am part of Trade Nation's Influencer program and receive a monthly fee for using their TradingView charts in my analysis.
What’s EURUSD Telling Us on the 30-Minute Chart?🌅 Good morning, my friends,
EURUSD just made a pullback within the last 30 minutes, so I entered a sell position based on that move.
🎯 Targets:
- TP1: 1.17607
- TP2: 1.17475
- TP3: 1.17174
🛑 Stop Loss: 1.17938
📊 Risk/Reward Ratio: 2.00
Your likes and support are what keep me motivated to share these analyses consistently.
Huge thanks to everyone who shows love and appreciation! 🙏

EURUSD Bounce on the 4H MA100 eyes 1.2000.The EURUSD pair has been trading within a Channel Up pattern since the May 12 Low. Right now it is expanding its 3rd Bearish Leg of this structure, with the previous two reaching at least either the 4H MA100 (green trend-line) or the 0.5 Fibonacci retracement level before rebounding.
As a result, we expect a rebound soon around the 1.16500 level to start the new Bullish Leg. The last two peaked on the 1.5 Fibonacci extension, which gives us a clear Target at 1.2000.
Notice also that every time the 4H MACD formed a Bullish Cross below the 0.0 mark, it was a confirmed buy signal. Use that to your advantage.
-------------------------------------------------------------------------------
** Please LIKE 👍, FOLLOW ✅, SHARE 🙌 and COMMENT ✍ if you enjoy this idea! Also share your ideas and charts in the comments section below! This is best way to keep it relevant, support us, keep the content here free and allow the idea to reach as many people as possible. **
-------------------------------------------------------------------------------
Disclosure: I am part of Trade Nation's Influencer program and receive a monthly fee for using their TradingView charts in my analysis.
💸💸💸💸💸💸
👇 👇 👇 👇 👇 👇

EURGBP SHORT DAILY FORECAST Q3 D8 W28 Y25EURGBP SHORT DAILY FORECAST Q3 D8 W28 Y25
Professional Risk Managers👋
Welcome back to another FRGNT chart update📈
Diving into some Forex setups using predominantly higher time frame order blocks alongside confirmation breaks of structure.
Let’s see what price action is telling us today! 👀
💡Here are some trade confluences📝
✅Daily Order block identified
✅4H Order Block identified
✅1H Order Block identified
🔑 Remember, to participate in trading comes always with a degree of risk, therefore as professional risk managers it remains vital that we stick to our risk management plan as well as our trading strategies.
📈The rest, we leave to the balance of probabilities.
💡Fail to plan. Plan to fail.
🏆It has always been that simple.
❤️Good luck with your trading journey, I shall see you at the very top.
🎯Trade consistent, FRGNT X

XAU/EUR Bear Raid – High-Risk, High-Reward Short!🔥 XAU/EUR GOLD HEIST – BEARISH BREAKOUT ALERT! 🚨💰
🌟 Greetings, Market Pirates & Profit Raiders! 🌟
(Hola! Oi! Bonjour! Hallo! Marhaba!)
🤑 TRADE IDEA: XAU/EUR (Gold vs. Euro) – BEARISH SWING PLAY
Based on the 🔥Thief Trading Style🔥, we’re plotting a strategic heist on Gold! Our analysis signals a short entry with high-risk, high-reward potential. The market is oversold, consolidating, and primed for a reversal trap—bullish traders are about to get ambushed!
🎯 TRADE SETUP (SWING/DAY TRADE)
📉 ENTRY:
"The Heist Begins!" Wait for Neutral Zone breakout near 2800.00 (Bearish confirmation).
Pro Tip: Place sell-stop orders above neutral OR sell-limit near swing highs/lows (15-30 min timeframe).
📌 Set an ALERT! Don’t miss the breakout moment.
🛑 STOP LOSS:
"Stop right there, cowboy! 🤠"
If using a sell-stop, set SL only after breakout (don’t get faked out!).
Thief SL Zone: 2870.00 (4H swing high).
⚠️ Adjust based on your risk & lot size! (Your money, your rules—but trade smart!).
🎯 TARGET:
2720.00 (or escape early if momentum fades).
🚨 CRITICAL ALERTS:
📰 News = Volatility! Avoid new trades during major releases.
🔒 Lock profits with trailing stops—don’t let winners turn to losers!
📉 Market Context: Bearish trend fueled by .
💥 BOOST THIS HEIST! 👊
🔥 Like & Boost to fuel our next Thief Trading raid!
🚀 More profitable setups coming—stay tuned!
(Disclaimer: Trade at your own risk. This is not financial advice.)

EURUSD Below 1.1745 – Bearish Bias in PlayFX:EURUSD Technical Outlook
EURUSD maintains bearish momentum as long as the price remains below 1.1745, with a near-term target at 1.1684.
A confirmed breakout above 1.1745 would shift the trend to bullish, opening the path toward 1.1808 and 1.1883.
On the downside, a 1H or 4H candle close below 1.1684 would reinforce the bearish trend, likely extending losses toward 1.1627, and possibly 1.1557.
Support: 1.1684 / 1.1627 / 1.1557
Resistance: 1.1808 / 1.1883

#EURNZD:Price accumulated now time for distribution! Price completed accumulated and now we expecting a strong bullish price distribution. Next week we can see price going and crossing our target with strong bullish volume kicking in the market. Price may go beyond 2.20 region; let's see how it goes.
Good luck and trade safe!
Team Setupsfx_

Bearish drop for the Fiber?The price is rising towards the pivot which acts as an overlap resistance and could drop to the 1st support.
Entry: 1.1743
1st Support: 1.1631
1st Resistance: 1.1833
Risk Warning:
Trading Forex and CFDs carries a high level of risk to your capital and you should only trade with money you can afford to lose. Trading Forex and CFDs may not be suitable for all investors, so please ensure that you fully understand the risks involved and seek independent advice if necessary.
Disclaimer:
The above opinions given constitute general market commentary, and do not constitute the opinion or advice of IC Markets or any form of personal or investment advice.
Any opinions, news, research, analyses, prices, other information, or links to third-party sites contained on this website are provided on an "as-is" basis, are intended only to be informative, is not an advice nor a recommendation, nor research, or a record of our trading prices, or an offer of, or solicitation for a transaction in any financial instrument and thus should not be treated as such. The information provided does not involve any specific investment objectives, financial situation and needs of any specific person who may receive it. Please be aware, that past performance is not a reliable indicator of future performance and/or results. Past Performance or Forward-looking scenarios based upon the reasonable beliefs of the third-party provider are not a guarantee of future performance. Actual results may differ materially from those anticipated in forward-looking or past performance statements. IC Markets makes no representation or warranty and assumes no liability as to the accuracy or completeness of the information provided, nor any loss arising from any investment based on a recommendation, forecast or any information supplied by any third-party.

EURAUD - Bearish... but not for long!Hello TradingView Family / Fellow Traders. This is Richard, also known as theSignalyst.
As per our last EURAUD analysis, attached on the chart, it rejected the upper bound of the blue channel and traded lower.
What's next?
📈EURAUD is now retesting the lower bound of the channel.
Moreover, the blue zone is a strong demand.
🏹 Thus, the highlighted blue circle is a strong area to look for buy setups as it is the intersection of the lower blue trendline and demand.
📚 As per my trading style:
As #EURAUD is around the blue circle zone, I will be looking for bullish reversal setups (like a double bottom pattern, trendline break , and so on...)
📚 Always follow your trading plan regarding entry, risk management, and trade management.
Good luck!
All Strategies Are Good; If Managed Properly!
~Rich
Disclosure: I am part of Trade Nation's Influencer program and receive a monthly fee for using their TradingView charts in my analysis.

Bearish reversal off Fibonacci confluence?The Fiber (EUR/USD) is rising towards the pivot and could reverse to the 1st support.
Pivot: 1.1905
1st Support: 1.1577
1st Resistance: 1.2152
Risk Warning:
Trading Forex and CFDs carries a high level of risk to your capital and you should only trade with money you can afford to lose. Trading Forex and CFDs may not be suitable for all investors, so please ensure that you fully understand the risks involved and seek independent advice if necessary.
Disclaimer:
The above opinions given constitute general market commentary, and do not constitute the opinion or advice of IC Markets or any form of personal or investment advice.
Any opinions, news, research, analyses, prices, other information, or links to third-party sites contained on this website are provided on an "as-is" basis, are intended only to be informative, is not an advice nor a recommendation, nor research, or a record of our trading prices, or an offer of, or solicitation for a transaction in any financial instrument and thus should not be treated as such. The information provided does not involve any specific investment objectives, financial situation and needs of any specific person who may receive it. Please be aware, that past performance is not a reliable indicator of future performance and/or results. Past Performance or Forward-looking scenarios based upon the reasonable beliefs of the third-party provider are not a guarantee of future performance. Actual results may differ materially from those anticipated in forward-looking or past performance statements. IC Markets makes no representation or warranty and assumes no liability as to the accuracy or completeness of the information provided, nor any loss arising from any investment based on a recommendation, forecast or any information supplied by any third-party.

EURNZD – Bearish Reversal Expected from Channel Top ResistanceEURNZD has reached the upper boundary of a well-defined ascending channel on the 2H chart and printed a rejection wick, suggesting exhaustion and potential for a pullback. The pair is likely to retrace toward the channel midline or base, with downside targets near 1.9423 and 1.9264, assuming confirmation follows.
🧠 Fundamentals:
EUR Drivers:
ECB remains cautious with weak Eurozone inflation and rising recession risks.
Recent German and Eurozone data (retail sales, factory orders) disappointed.
Political instability in France and ECB’s dovish tone are capping upside momentum in the euro.
NZD Drivers:
RBNZ remains one of the more hawkish central banks, reiterating restrictive stance despite slowing inflation.
Dairy auctions improved recently, adding strength to NZD fundamentals.
China exposure is a double-edged sword — optimism helps, but slowdown risk remains.
🔍 Technical Structure:
Clear ascending channel from mid-June remains intact.
Price rejected perfectly at the upper trendline near 1.9585.
Strong bearish divergence may form if rejection persists.
Bearish scenario targets the 1.9423 zone first (support + midline), then 1.9264 (bottom of channel).
Invalid if price breaks and closes above 1.9600 on strong volume.
⚠️ Risk Factors:
A sudden euro bid from safe-haven demand or ECB surprise could break the channel.
NZD weakness could emerge if China disappoints or RBNZ shifts tone unexpectedly.
🔁 Leader/Lagger Dynamics:
EURNZD often lags risk-sensitive NZD pairs (like NZDJPY, NZDCAD), especially during Asia session moves. However, during European hours, EUR’s tone can dominate due to ECB speeches or EU data.
✅ Trade Bias: Bearish
TP1: 1.9423
TP2: 1.9264
SL: Above 1.9600
Event to Watch:
ECB speakers this week
China CPI/PPI (affects NZD)
US CPI (indirect cross-pressure on both currencies)
📌 Look for bearish confirmation on the 2H/4H candle close below 1.9540. Risk-reward favors a tactical short if the channel structure holds.

"Euro vs Kiwi Heist - Bullish Loot Opportunity!🔥 EURNZD BULL HEIST! Euro vs Kiwi Raid Plan (Swing/Day) 🚨💰
🌟 Attention, Market Bandits! 🌟
"The vault is cracked—time to grab the loot!"
🔮 Thief’s Intel (TA + FA):
EURNZD is flashing BULLISH signals, but beware—overbought traps & police (bears) lurk near resistance!
🎯 ENTRY POINTS (Where to Strike!)
🟢 LONG RAID (Bullish Thieves):
"Swipe the loot on pullbacks!"
Buy limit orders (15-30min TF) near swing lows/highs.
Aggressive heist? Enter any price—but watch for traps!
🛑 STOP-LOSS (Escape Plan)
📍 SL at recent swing low (2H TF) = 1.93500 (Adjust based on risk!)
💰 TAKE-PROFIT (Cash Out Before Cops Arrive!)
🎯 TP = 1.98500 (Or escape early near red zones!)
⚠️ WARNING: Police (Bears) Ahead!
Overbought + Consolidation = Reversal risk!
News = High alert! Avoid new trades during volatility.
Trailing SL = Your getaway car!
📡 FUNDAMENTAL BACKUP (Why This Heist Works)
Bullish momentum from COT data, macro trends & sentiment.
Check full analysis for targets & intermarket clues!
💥 BOOST THIS HEIST! 💥
Like & Share to strengthen our crew! More alerts = More profits!
🚨 Next raid coming soon… Stay tuned, thieves! 🚨

EUR/CHF BEARS WILL DOMINATE THE MARKET|SHORT
Hello, Friends!
EUR/CHF pair is trading in a local downtrend which know by looking at the previous 1W candle which is red. On the 1H timeframe the pair is going up. The pair is overbought because the price is close to the upper band of the BB indicator. So we are looking to sell the pair with the upper BB line acting as resistance. The next target is 0.934 area.
Disclosure: I am part of Trade Nation's Influencer program and receive a monthly fee for using their TradingView charts in my analysis.
✅LIKE AND COMMENT MY IDEAS✅

Bearish drop for the Fiber?The price has rejected off the pivot and could drop to the 50% Fibonacci support.
Pivot: 1.1748
1st Support: 1.1631
1st Resistance: 1.1833
Risk Warning:
Trading Forex and CFDs carries a high level of risk to your capital and you should only trade with money you can afford to lose. Trading Forex and CFDs may not be suitable for all investors, so please ensure that you fully understand the risks involved and seek independent advice if necessary.
Disclaimer:
The above opinions given constitute general market commentary, and do not constitute the opinion or advice of IC Markets or any form of personal or investment advice.
Any opinions, news, research, analyses, prices, other information, or links to third-party sites contained on this website are provided on an "as-is" basis, are intended only to be informative, is not an advice nor a recommendation, nor research, or a record of our trading prices, or an offer of, or solicitation for a transaction in any financial instrument and thus should not be treated as such. The information provided does not involve any specific investment objectives, financial situation and needs of any specific person who may receive it. Please be aware, that past performance is not a reliable indicator of future performance and/or results. Past Performance or Forward-looking scenarios based upon the reasonable beliefs of the third-party provider are not a guarantee of future performance. Actual results may differ materially from those anticipated in forward-looking or past performance statements. IC Markets makes no representation or warranty and assumes no liability as to the accuracy or completeness of the information provided, nor any loss arising from any investment based on a recommendation, forecast or any information supplied by any third-party.

EURCHF SHORT DAILY FORECAST Q3 D8 W28 Y25EURCHF SHORT DAILY FORECAST Q3 D8 W28 Y25
Professional Risk Managers👋
Welcome back to another FRGNT chart update📈
Diving into some Forex setups using predominantly higher time frame order blocks alongside confirmation breaks of structure.
Let’s see what price action is telling us today! 👀
💡Here are some trade confluences📝
✅Daily Order block identified
✅4H Order Block identified
✅1H Order Block identified
🔑 Remember, to participate in trading comes always with a degree of risk, therefore as professional risk managers it remains vital that we stick to our risk management plan as well as our trading strategies.
📈The rest, we leave to the balance of probabilities.
💡Fail to plan. Plan to fail.
🏆It has always been that simple.
❤️Good luck with your trading journey, I shall see you at the very top.
🎯Trade consistent, FRGNT X

EURCHF previous support now resistance at 0.9370The EURCHF pair is currently trading with a bearish bias, aligned with the broader downward trend. Recent price action shows a retest of the resistance, suggesting a temporary relief rally within the downtrend.
Key resistance is located at 0.9370, a prior consolidation zone. This level will be critical in determining the next directional move.
A bearish rejection from 0.9370 could confirm the resumption of the downtrend, targeting the next support levels at 0.9310, followed by 0.9290 and 0.9280 over a longer timeframe.
Conversely, a decisive breakout and daily close above 0.9370 would invalidate the current bearish setup, shifting sentiment to bullish and potentially triggering a move towards 0.9380, then 0.9400.
Conclusion:
The short-term outlook remains bearish unless the pair breaks and holds above 0.9370. Traders should watch for price action signals around this key level to confirm direction. A rejection favours fresh downside continuation, while a breakout signals a potential trend reversal or deeper correction.
This communication is for informational purposes only and should not be viewed as any form of recommendation as to a particular course of action or as investment advice. It is not intended as an offer or solicitation for the purchase or sale of any financial instrument or as an official confirmation of any transaction. Opinions, estimates and assumptions expressed herein are made as of the date of this communication and are subject to change without notice. This communication has been prepared based upon information, including market prices, data and other information, believed to be reliable; however, Trade Nation does not warrant its completeness or accuracy. All market prices and market data contained in or attached to this communication are indicative and subject to change without notice.

EURCHF LONG DAILY FORECAST Q3 D7 W28 Y25EURCHF LONG DAILY FORECAST Q3 D7 W28 Y25
Professional Risk Managers👋
Welcome back to another FRGNT chart update📈
Diving into some Forex setups using predominantly higher time frame order blocks alongside confirmation breaks of structure.
Let’s see what price action is telling us today! 👀
💡Here are some trade confluences📝
✅Daily Order block identified
✅4H Order Block identified
✅1H Order Block identified
🔑 Remember, to participate in trading comes always with a degree of risk, therefore as professional risk managers it remains vital that we stick to our risk management plan as well as our trading strategies.
📈The rest, we leave to the balance of probabilities.
💡Fail to plan. Plan to fail.
🏆It has always been that simple.
❤️Good luck with your trading journey, I shall see you at the very top.
🎯Trade consistent, FRGNT X

EUR/NZD – Macro Outlook & Why It’s a Conviction LongMacro Thesis:
EUR/NZD presents one of the clearest long opportunities this week, supported by a sharp divergence in macro fundamentals, a favorable positioning landscape, and confirmation across sentiment and structural models.
🔍 Key Drivers:
1. Macro Fundamentals (ENDO):
The euro area maintains a relatively stable inflationary outlook with moderate growth, while the ECB remains cautious but not overly dovish.
In contrast, New Zealand is showing consistent deflationary pressure – inflation data is softening, M2 growth is stagnant, and real activity (PMI, Retail Sales, NFP) continues to cool. This creates a clean fundamental divergence in favor of the euro.
2. COT Positioning:
There is no excessive long build-up on the EUR side, and NZD remains weak across institutional positioning metrics. This opens the door for further upside without the risk of crowded positioning.
3. Z-Score (Positioning Extremes):
Z-Score data highlights NZD as sitting at an extreme negative reading (Z_Long < –1.7), suggesting it is fundamentally oversold and under institutional pressure. EUR, by contrast, is neutral.
This imbalance further validates the long EUR/NZD setup, particularly from a flow and momentum continuation standpoint.
4. EXO Models (Score, RR_w, Interest Rate Bias):
The pair scores well in weekly RR analysis, supported by strong ENDO/EXO bias convergence. NZD continues to lose monetary support (dovish IR & Overnight trends), while EUR stays relatively neutral.
From a structural model perspective, the bias is clearly long.
5. Sentiment Environment:
The global risk-on tone continues, but it’s paired with relative softness in commodity currencies like NZD. That dynamic adds additional fuel to the long side of EUR/NZD, especially while EUR remains resilient and stable.
✅ Summary & Trading Plan:
Bias: Long EUR/NZD
Conviction Level: High (9/10 – multi-layer confirmation)
Holding Horizon: 1–3 weeks
Invalidation: Exit on reversal of NZD macro tone or shift to risk-off globally
Why This Pair?
EUR/NZD offers one of the clearest expressions of fundamental divergence in the current macro environment.
You have stable inflation and steady growth in Europe versus a weakening macro pulse in New Zealand.
There are no major positioning risks, sentiment supports the setup, and structurally the pair aligns with the broader market tone.
Clean macro. Clean structure. No crosswinds.

EUR-NZD Risky Short! Sell!
Hello,Traders!
EUR-NZD made a retest
Of the local horizontal resistance
Of 1.9485 so despite the uptrend
We are locally bearish biased
And we will be expecting a
Local bearish correction
On Monday
Sell!
Comment and subscribe to help us grow!
Check out other forecasts below too!
Disclosure: I am part of Trade Nation's Influencer program and receive a monthly fee for using their TradingView charts in my analysis.

EURNZD: Bears Will Push Lower
Balance of buyers and sellers on the EURNZD pair, that is best felt when all the timeframes are analyzed properly is shifting in favor of the sellers, therefore is it only natural that we go short on the pair.
Disclosure: I am part of Trade Nation's Influencer program and receive a monthly fee for using their TradingView charts in my analysis.
❤️ Please, support our work with like & comment! ❤️

EURNZD Is Bullish! Long!
Please, check our technical outlook for EURNZD.
Time Frame: 9h
Current Trend: Bullish
Sentiment: Oversold (based on 7-period RSI)
Forecast: Bullish
The market is approaching a key horizontal level 1.944.
Considering the today's price action, probabilities will be high to see a movement to 1.965.
P.S
The term oversold refers to a condition where an asset has traded lower in price and has the potential for a price bounce.
Overbought refers to market scenarios where the instrument is traded considerably higher than its fair value. Overvaluation is caused by market sentiments when there is positive news.
Disclosure: I am part of Trade Nation's Influencer program and receive a monthly fee for using their TradingView charts in my analysis.
Like and subscribe and comment my ideas if you enjoy them!

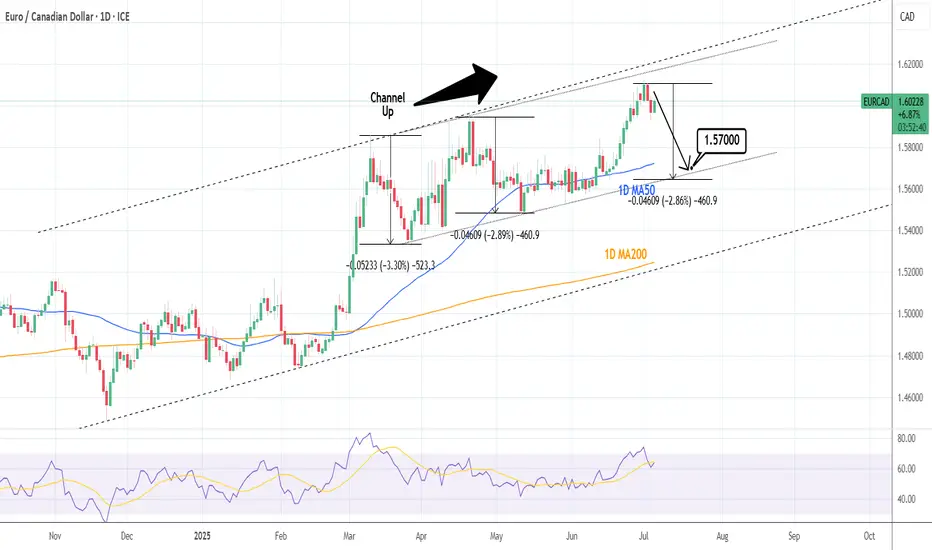
EURCAD: Sell signal on Double Channel Up Top.EURCAD is bullish on its 1D technical outlook (RSI = 63.955, MACD = 0.010, ADX = 41.562) having peaked on two Channel Up patterns at the same time. Technically it should now start the new bearish wave to test the bottom a little below the 1D MA50. Short, TP = 1.57000.
See how our prior idea has worked out:
## If you like our free content follow our profile to get more daily ideas. ##
## Comments and likes are greatly appreciated. ##