EURTRY - Inflation Beast is Back EURTRY :
Our first idea/post was on the Epic rebound of the Turkish Lira back in Dec 21st /2021
We had then calculated and prognosed with great precision the levels (rise to 15,7) :
The price has done us the favor then and normalized/consolidated around that level (15,7) :
At this stage, Central bank has kept the lira's rates unchanged (good news because every time they intervene there is panic amongst Turkish citizens and Lira holders) but Inflation is a BEAST out of control:
Turkey’s inflation rate soars to almost 70 percent : www.aljazeera.com
Turkey's role in the Ukraine crisis is something Erdogan can use nicely as long as he can balance between a 'neutral stance' with doors open to Russia and still in Nato' and part of the Western front. If the West wishes to shift him on one side though the Turkish lira might end up under severe pressure again.
Don't forget that there are elections next year and Erdogan is probably not feeling the safest at this moment.
Let's hope everything goes well in the world as well as in Turkey and that Turkey can play a peaceful role in ending the war in Ukraine.
This will be interesting to see.
One Love,
the FXPROFESSOR
EUR (Euro)

Bearish drop?EUR/AUD has rejected off the pivot and could potentially drop to the 1st support which is a pullback support that aligns with the 61.8% Fibonacci projection.
Pivot: 1.77322
1st Support: 1.74140
1st Resistance: 1.78883
Risk Warning:
Trading Forex and CFDs carries a high level of risk to your capital and you should only trade with money you can afford to lose. Trading Forex and CFDs may not be suitable for all investors, so please ensure that you fully understand the risks involved and seek independent advice if necessary.
Disclaimer:
The above opinions given constitute general market commentary, and do not constitute the opinion or advice of IC Markets or any form of personal or investment advice.
Any opinions, news, research, analyses, prices, other information, or links to third-party sites contained on this website are provided on an "as-is" basis, are intended only to be informative, is not an advice nor a recommendation, nor research, or a record of our trading prices, or an offer of, or solicitation for a transaction in any financial instrument and thus should not be treated as such. The information provided does not involve any specific investment objectives, financial situation and needs of any specific person who may receive it. Please be aware, that past performance is not a reliable indicator of future performance and/or results. Past Performance or Forward-looking scenarios based upon the reasonable beliefs of the third-party provider are not a guarantee of future performance. Actual results may differ materially from those anticipated in forward-looking or past performance statements. IC Markets makes no representation or warranty and assumes no liability as to the accuracy or completeness of the information provided, nor any loss arising from any investment based on a recommendation, forecast or any information supplied by any third-party.

Heading into 50% Fibonacci resistance?EUR/CAD is falling towards the pivot and could reverse to the 1st support which is a pullback support.
Pivot: 1.57044
1st Support: 1.54315
1st Resistance: 1.57990
Risk Warning:
Trading Forex and CFDs carries a high level of risk to your capital and you should only trade with money you can afford to lose. Trading Forex and CFDs may not be suitable for all investors, so please ensure that you fully understand the risks involved and seek independent advice if necessary.
Disclaimer:
The above opinions given constitute general market commentary, and do not constitute the opinion or advice of IC Markets or any form of personal or investment advice.
Any opinions, news, research, analyses, prices, other information, or links to third-party sites contained on this website are provided on an "as-is" basis, are intended only to be informative, is not an advice nor a recommendation, nor research, or a record of our trading prices, or an offer of, or solicitation for a transaction in any financial instrument and thus should not be treated as such. The information provided does not involve any specific investment objectives, financial situation and needs of any specific person who may receive it. Please be aware, that past performance is not a reliable indicator of future performance and/or results. Past Performance or Forward-looking scenarios based upon the reasonable beliefs of the third-party provider are not a guarantee of future performance. Actual results may differ materially from those anticipated in forward-looking or past performance statements. IC Markets makes no representation or warranty and assumes no liability as to the accuracy or completeness of the information provided, nor any loss arising from any investment based on a recommendation, forecast or any information supplied by any third-party.

Potential bearish drop?EUR/GBP has reacted off the pivot and could drop to the 1st support which acts as a pullback support.
Pivot: 0.8526
1st Support: 0.8447
1st Resistance: 0.8572
Risk Warning:
Trading Forex and CFDs carries a high level of risk to your capital and you should only trade with money you can afford to lose. Trading Forex and CFDs may not be suitable for all investors, so please ensure that you fully understand the risks involved and seek independent advice if necessary.
Disclaimer:
The above opinions given constitute general market commentary, and do not constitute the opinion or advice of IC Markets or any form of personal or investment advice.
Any opinions, news, research, analyses, prices, other information, or links to third-party sites contained on this website are provided on an "as-is" basis, are intended only to be informative, is not an advice nor a recommendation, nor research, or a record of our trading prices, or an offer of, or solicitation for a transaction in any financial instrument and thus should not be treated as such. The information provided does not involve any specific investment objectives, financial situation and needs of any specific person who may receive it. Please be aware, that past performance is not a reliable indicator of future performance and/or results. Past Performance or Forward-looking scenarios based upon the reasonable beliefs of the third-party provider are not a guarantee of future performance. Actual results may differ materially from those anticipated in forward-looking or past performance statements. IC Markets makes no representation or warranty and assumes no liability as to the accuracy or completeness of the information provided, nor any loss arising from any investment based on a recommendation, forecast or any information supplied by any third-party.

Bearish drop?EUR/USD has reacted off the pivot and could drop to the 1st support.
Pivot: 1.14245
1st Support: 1.1146
1st Resistance: 1.1569
Risk Warning:
Trading Forex and CFDs carries a high level of risk to your capital and you should only trade with money you can afford to lose. Trading Forex and CFDs may not be suitable for all investors, so please ensure that you fully understand the risks involved and seek independent advice if necessary.
Disclaimer:
The above opinions given constitute general market commentary, and do not constitute the opinion or advice of IC Markets or any form of personal or investment advice.
Any opinions, news, research, analyses, prices, other information, or links to third-party sites contained on this website are provided on an "as-is" basis, are intended only to be informative, is not an advice nor a recommendation, nor research, or a record of our trading prices, or an offer of, or solicitation for a transaction in any financial instrument and thus should not be treated as such. The information provided does not involve any specific investment objectives, financial situation and needs of any specific person who may receive it. Please be aware, that past performance is not a reliable indicator of future performance and/or results. Past Performance or Forward-looking scenarios based upon the reasonable beliefs of the third-party provider are not a guarantee of future performance. Actual results may differ materially from those anticipated in forward-looking or past performance statements. IC Markets makes no representation or warranty and assumes no liability as to the accuracy or completeness of the information provided, nor any loss arising from any investment based on a recommendation, forecast or any information supplied by any third-party.

EURUSD: Small bounce followed by a strong sell-off.EURUSD is bullish on its 1D technical outlook (RSI = 59.681, MACD = 0.0130, ADX = 48.626) but has turned sideways since the April 21st High with the 1D RSI getting rejected on March's Resistance back to the HL trendline. As you see this is roughly the same pattern as August 2024. After the RSI hit the HL trendline it pushed the price upwards back to the recent High only to get rejected heavily to the S1 level. Consequently, we are waiting for that rejection to be confirmed and take the short to the March 26th S1 level (TP = 1.07500).
## If you like our free content follow our profile to get more daily ideas. ##
## Comments and likes are greatly appreciated. ##

EURAUD H2 compression BUY/HOLD +150/300 pips🏆 EURAUD Market Update
📊 Technical Outlook
🔸Short-term: BEARS 7650/7700
🔸Mid-term: BULLS 8050/8150
🔸Status: compression wedge
🔸getting ready for a PUMP
🔸noteworthy compression in April
🔸Price Target Bears: 7650/7700
🔸Price Target BULLS: 8050/8150
📊 Forex & Gold Market Highlights – April 30, 2025
💶 EUR/USD Nears 1.1400
- Trading around 1.1390 amid softer U.S. economic data
- Investors await German economic indicators and U.S. PCE report
- April shows a 5.1% gain, the largest monthly increase since November 2022
💷 GBP/USD Hovers Near 1.3400
- Sterling trades at approximately 1.3379 after testing YTD highs
- U.S. JOLTS and Consumer Confidence data missed forecasts, fueling Fed rate cut speculation
🥇 Gold Retreats Below $3,310
- Spot gold at $3,302.58 per ounce, down 0.4%
- Decline follows easing trade tensions and a stronger U.S. dollar
- Investors focus on upcoming U.S. PCE data and non-farm payrolls report
📌 Market Outlook:
- EUR/USD: Potential to test 1.15 if German data supports euro strength
- GBP/USD: Eyes on U.S. economic data for direction; support around 1.3300
- Gold: Volatility expected; watch for U.S. economic indicators influencing Fed policy expectations

EurnzdAs we can see the market is on a uptrend we have a beautiful head and shoulder pattern onnthen4hr and on a 2 hr time frame so we had a break from the previous resistance so we are expecting market to pull back be4 the buy but I am on this trade already

Bearish drop?EUR/USD is reacting off the resistance level which is a pullback resistance that lines up with the 50% Fibonacci retracement and could drop from this level to our take profit.
Entry: 1.1427
Why we like it:
There is a pullback resistance level that lines up with the 50% Fibonacci retracement.
Stop loss: 1.1560
Why we like it:
There is a pullback resistance level.
Take profit: 1.1278
Why we like it:
There is a pullback support level.
Enjoying your TradingView experience? Review us!
Please be advised that the information presented on TradingView is provided to Vantage (‘Vantage Global Limited’, ‘we’) by a third-party provider (‘Everest Fortune Group’). Please be reminded that you are solely responsible for the trading decisions on your account. There is a very high degree of risk involved in trading. Any information and/or content is intended entirely for research, educational and informational purposes only and does not constitute investment or consultation advice or investment strategy. The information is not tailored to the investment needs of any specific person and therefore does not involve a consideration of any of the investment objectives, financial situation or needs of any viewer that may receive it. Kindly also note that past performance is not a reliable indicator of future results. Actual results may differ materially from those anticipated in forward-looking or past performance statements. We assume no liability as to the accuracy or completeness of any of the information and/or content provided herein and the Company cannot be held responsible for any omission, mistake nor for any loss or damage including without limitation to any loss of profit which may arise from reliance on any information supplied by Everest Fortune Group.

EURCHF INTRADAY resistance retest at 0.9430The pair is in a bearish trend, with recent price action showing a bounce (oversold rally) that was rejected near 0.9430, a key resistance level from previous consolidation.
This rejection suggests sellers are still in control.
Key Levels to Watch:
Resistance: 0.9430 (key level), then 0.9500 and 0.9600 if broken.
Support: 0.9155, followed by 0.9100 and 0.9050.
Trading Outlook:
Bearish scenario: If price fails to break above 0.9430, expect a move lower toward 0.9300, with extended downside to 0.9200 and 0.9130 over time.
Bullish scenario: A daily close above 0.9430 would invalidate the bearish view and could lead to a move toward 0.9500 and possibly 0.9600.
Conclusion: EUR/CHF remains bearish unless price breaks and holds above 0.9430. Traders may look for short opportunities below resistance or switch to a bullish bias on a confirmed breakout.
This communication is for informational purposes only and should not be viewed as any form of recommendation as to a particular course of action or as investment advice. It is not intended as an offer or solicitation for the purchase or sale of any financial instrument or as an official confirmation of any transaction. Opinions, estimates and assumptions expressed herein are made as of the date of this communication and are subject to change without notice. This communication has been prepared based upon information, including market prices, data and other information, believed to be reliable; however, Trade Nation does not warrant its completeness or accuracy. All market prices and market data contained in or attached to this communication are indicative and subject to change without notice.

Euro Under Mild Pressure Amid Policy Uncertainty and Weaker USD📌 EUR/USD Outlook: Euro Under Mild Pressure Amid Policy Uncertainty and Weaker US Dollar 📉
🌍 Fundamental Overview
EUR/USD is trading cautiously around 1.1400, as market sentiment remains sensitive to developments in the US-China trade situation and broader monetary policy expectations.
Despite recent USD weakness — where the greenback lost ground against all G10 currencies this April — the Euro is facing renewed selling pressure amid rising speculation about further ECB rate cuts.
ECB policymakers, including Olli Rehn and François Villeroy de Galhau, highlighted the increasing risks of missing the 2% inflation target, reinforcing the need for more monetary easing if necessary.
Meanwhile, mixed signals between Trump and Beijing over trade negotiations have kept uncertainty high, putting both USD and risk sentiment in flux.
📈 Key Economic Events to Watch
US Data:
JOLTS Job Openings
Q1 GDP Preliminary
ISM Manufacturing PMI
ADP Employment Change
Nonfarm Payrolls (NFP)
Core PCE Price Index (March)
Eurozone Data:
Q1 GDP Preliminary
April HICP Inflation
Recent weaker-than-expected Spanish GDP (0.6% vs. forecast 0.7%) also adds pressure on the broader Eurozone outlook.
📊 Technical Outlook – EUR/USD
Immediate Resistance: 1.1450 – 1.1475
Immediate Support: 1.1375 – 1.1340
The pair is now hovering near the 1.1400 psychological level, with slight bearish momentum:
A break below 1.1375 could open the path towards 1.1340.
On the upside, holding above 1.1400 and reclaiming 1.1450 would be needed to revive bullish momentum.
The Dollar Index (DXY) remains trapped around 99.20, hinting at limited immediate USD strength but vulnerable to macro catalysts.
🧠 Trading Strategy
Prefer short-term sell setups if EUR/USD fails to hold 1.1400 and breaks below 1.1375.
Bullish setups are only valid if Price closes firmly above 1.1450, aiming towards 1.1475 resistance.
⚡ Traders should stay cautious ahead of major data this week, especially US NFP and Core PCE, which could redefine short-term Dollar strength.
💬 Are you watching for a deeper pullback or waiting for a bounce above 1.1450? Let’s discuss! 👇👇👇

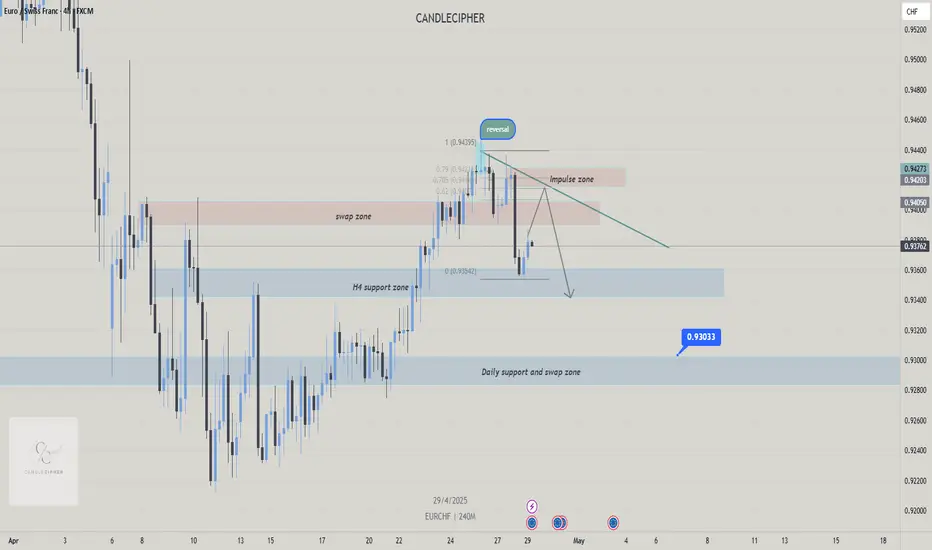
EURCHF Potential shortsFX:EURCHF
EURCHF has an overall bearish sentiment. The price reversal has created a shooting star on both the 4 Hour and daily timeframes. Price is on the fourth wave retracing back towards the swap zone, we can wait for price reaction when it taps into the impulse zone and look for another reversal signal before hopping onto sells. For the first target, we can look for sells back to the H4 support zone, if price breaks below the H4 support zone, we can then target to the strong daily support and swap zone below at 0.93033.
Potential bearish drop?The Fiber (EUR/USD) is reacting off the pivot and could drop to the 1st support.
Pivot: 1.1425
1st Support: 1.1146
1st Resistance: 1.1569
Risk Warning:
Trading Forex and CFDs carries a high level of risk to your capital and you should only trade with money you can afford to lose. Trading Forex and CFDs may not be suitable for all investors, so please ensure that you fully understand the risks involved and seek independent advice if necessary.
Disclaimer:
The above opinions given constitute general market commentary, and do not constitute the opinion or advice of IC Markets or any form of personal or investment advice.
Any opinions, news, research, analyses, prices, other information, or links to third-party sites contained on this website are provided on an "as-is" basis, are intended only to be informative, is not an advice nor a recommendation, nor research, or a record of our trading prices, or an offer of, or solicitation for a transaction in any financial instrument and thus should not be treated as such. The information provided does not involve any specific investment objectives, financial situation and needs of any specific person who may receive it. Please be aware, that past performance is not a reliable indicator of future performance and/or results. Past Performance or Forward-looking scenarios based upon the reasonable beliefs of the third-party provider are not a guarantee of future performance. Actual results may differ materially from those anticipated in forward-looking or past performance statements. IC Markets makes no representation or warranty and assumes no liability as to the accuracy or completeness of the information provided, nor any loss arising from any investment based on a recommendation, forecast or any information supplied by any third-party.

Heading into overlap resistance?EUR/NZD is rising towards the resistance level which is an overlap resistance level that is slightly above the 38.2% Fibonacci retracement and could drop from this level to our take profit.
Entry: 1.9286
Why we like it:
There is an overlap resistance level that is slightly above the 38.2% Fibonacci retracement.
Stop loss: 1.9500
Why we like it:
There is a pullback resistance level that lines up with the 71% Fibonacci retracement.
Take profit: 1.8813
Why we like it:
There is a pullback support level.
Enjoying your TradingView experience? Review us!
Please be advised that the information presented on TradingView is provided to Vantage (‘Vantage Global Limited’, ‘we’) by a third-party provider (‘Everest Fortune Group’). Please be reminded that you are solely responsible for the trading decisions on your account. There is a very high degree of risk involved in trading. Any information and/or content is intended entirely for research, educational and informational purposes only and does not constitute investment or consultation advice or investment strategy. The information is not tailored to the investment needs of any specific person and therefore does not involve a consideration of any of the investment objectives, financial situation or needs of any viewer that may receive it. Kindly also note that past performance is not a reliable indicator of future results. Actual results may differ materially from those anticipated in forward-looking or past performance statements. We assume no liability as to the accuracy or completeness of any of the information and/or content provided herein and the Company cannot be held responsible for any omission, mistake nor for any loss or damage including without limitation to any loss of profit which may arise from reliance on any information supplied by Everest Fortune Group.

EURCHF: Short Trade with Entry/SL/TP
EURCHF
- Classic bearish pattern
- Our team expects retracement
SUGGESTED TRADE:
Swing Trade
Sell EURCHF
Entry -0.9391
Stop - 0.9435
Take - 0.9313
Our Risk - 1%
Start protection of your profits from lower levels
Disclosure: I am part of Trade Nation's Influencer program and receive a monthly fee for using their TradingView charts in my analysis.
❤️ Please, support our work with like & comment! ❤️

EURCHF Builds Momentum Above Key Support as ECB Meeting LoomsEURCHF is trading above the previous breakout zone near 0.9396–0.9400, confirming a shift toward bullish structure. Price action shows a clean breakout from consolidation, aiming for the 0.9485–0.9546 resistance zones next, supported by strong momentum.
Support Zone: 0.9385–0.9400 (previous resistance turned support)
Immediate Resistance: 0.9485 (61.8% Fib level)
Target Zones:
TP1: 0.9485 (61.8% Fib retracement)
TP2: 0.9545 (78.6% Fib retracement)
Risk Level: Stop-loss below 0.9380 for protection.
✅ Bullish Factors:
Bullish break above mid-range structure and retesting successfully
Clean bullish market structure and higher lows developing
50% Fibonacci retracement break supports further upside momentum
Weak CHF fundamentals due to global risk appetite and cautious SNB stance
🧠 Fundamental Insights:
ECB Outlook:
ECB is heading toward a "complex June meeting" with Klaas Knot warning that while short-term tariffs may suppress inflation, long-term risks are two-sided.
Despite likely rate cuts, the ECB remains cautious due to trade war uncertainty and global pressures.
Eurozone Risks:
Upcoming GDP and CPI reports expected to show sluggish growth and cooling inflation, which could limit upside for EUR in medium term.
CHF Fundamentals:
Market sentiment favors risk assets, weakening the traditional safe-haven CHF.
No aggressive SNB tightening expected soon.
Recent Headlines:
US Treasury Sec Bessent highlights European concerns about Euro strength.
Weaker CHF amid global calm and stable financial markets.
📌 Trading Plan:
Bias: Bullish while holding above 0.9400
Entry: On dips near 0.9415–0.9420
Target 1: 0.9485
Target 2: 0.9545
Stop-loss: Below 0.9380
⚠️ Watch:
If EUR zone GDP or CPI disappoints heavily this week, expect sharp pullback risk.
A drop back below 0.9380 would invalidate the bullish breakout scenario.

EURUSD below its 4H MA50 signals more selling.The EURUSD pair broke last Wednesday below its 4H MA50 for the first time since the start of April and is now consolidating under it. Within its 3-month Channel Up, this has always been a signal of more downtrend to come as it was technically halfway through the Bearish Legs of the pattern.
Given that the 4H MA200 (orange trend-line) is the medium-term Support, our Target is at 1.12500, just above the Internal Higher Lows trend-line. Check also the 4H RSI sequences between these 3 Bearish Legs. It is exactly ranging between the levels it did half-way through those Legs.
-------------------------------------------------------------------------------
** Please LIKE 👍, FOLLOW ✅, SHARE 🙌 and COMMENT ✍ if you enjoy this idea! Also share your ideas and charts in the comments section below! This is best way to keep it relevant, support us, keep the content here free and allow the idea to reach as many people as possible. **
-------------------------------------------------------------------------------
💸💸💸💸💸💸
👇 👇 👇 👇 👇 👇

EURNZD strong daily demand level at 1.89. Long biasSupply and demand imbalances are the driving forces behind price movements in the Forex market. By identifying these key zones or imbalances, traders can anticipate high-probability reversal or continuation setups. Today, we’ll analyze the EURNZD cross pair, which has recently formed a strong demand imbalance at $1.89—the most significant impulse in months.
The Power of Supply & Demand Imbalances
Supply and demand trading revolves around identifying areas where price has made a strong, impulsive move (demand or supply zone) and then waiting for a retracement into that zone for a potential reversal or continuation.
Key Characteristics of a Strong Imbalance:
✅ Extended Range Candles (ERC): Strong, wide-bodied candles indicate institutional buying/selling.
✅ Strong Imbalance: A clear shift in market structure after a strong rally or drop.
✅ Fresh Zone: The imbalance has not been tested yet or has only been tested once.

Falling towards pullback support?The Fiber (EUR/USD) is fallling towards the pivot which has been identified as a pullback support and could bounce to the 1st resistance which is a pullback resistance.
Pivot: 1.1192
1st Support: 1.1051
1st Resistance: 1.1512
Risk Warning:
Trading Forex and CFDs carries a high level of risk to your capital and you should only trade with money you can afford to lose. Trading Forex and CFDs may not be suitable for all investors, so please ensure that you fully understand the risks involved and seek independent advice if necessary.
Disclaimer:
The above opinions given constitute general market commentary, and do not constitute the opinion or advice of IC Markets or any form of personal or investment advice.
Any opinions, news, research, analyses, prices, other information, or links to third-party sites contained on this website are provided on an "as-is" basis, are intended only to be informative, is not an advice nor a recommendation, nor research, or a record of our trading prices, or an offer of, or solicitation for a transaction in any financial instrument and thus should not be treated as such. The information provided does not involve any specific investment objectives, financial situation and needs of any specific person who may receive it. Please be aware, that past performance is not a reliable indicator of future performance and/or results. Past Performance or Forward-looking scenarios based upon the reasonable beliefs of the third-party provider are not a guarantee of future performance. Actual results may differ materially from those anticipated in forward-looking or past performance statements. IC Markets makes no representation or warranty and assumes no liability as to the accuracy or completeness of the information provided, nor any loss arising from any investment based on a recommendation, forecast or any information supplied by any third-party.

EURUSD Potential UpsidesHey Traders, in today's trading session we are monitoring EURUSD for a buying opportunity around 1.13400 zone, EURUSD is trading in an uptrend and currently is in a correction phase in which it is approaching the trend at 1.13400 support and resistance area.
Trade safe, Joe.

EURCHF: Short Signal with Entry/SL/TP
EURCHF
- Classic bearish setup
- Our team expects bearish continuation
SUGGESTED TRADE:
Swing Trade
Short EURCHF
Entry Point - 0.9431
Stop Loss - 0.9478
Take Profit - 0.9332
Our Risk - 1%
Start protection of your profits from lower levels
Disclosure: I am part of Trade Nation's Influencer program and receive a monthly fee for using their TradingView charts in my analysis.
❤️ Please, support our work with like & comment! ❤️

EUR/USD Slides to 1.1350 Amid USD Strength & ECB Dovish Signals📌 Daily Market Summary: EUR/USD Slides to 1.1350 Amid USD Strength & ECB Dovish Signals
EUR/USD declined toward 1.1350 on Friday as the US Dollar gained strength, driven by easing tensions in the US–China trade standoff. Reports suggest Beijing may suspend additional tariffs on some US goods.
Despite the dip, the euro remains firm against most major currencies except North American ones.
ECB members Holzmann and Rehn highlighted ongoing structural weaknesses in the Eurozone and increased risks of inflation undershooting the 2% target.
Olli Rehn suggested that the current conditions justify a rate cut as early as June.
📊 Technical Outlook
EUR/USD dropped to 1.1350, but the broader trend remains bullish, with the 20-week EMA still pointing higher around 1.0885.
💼 Trading Plan
🟢 BUY ZONE
Entry: 1.12725
Stop Loss: 1.12000
Take Profit: 1.13165
🔴 SELL ZONE
Entry: 1.14775
Stop Loss: 1.15300
Take Profit: 1.14350
📉 Caution: With political news and central bank guidance shaping sentiment, traders should closely monitor reactions at key levels and stick to their risk management rules.

EURCHF: Important Breakout 🇪🇺🇨🇭
One more CHF pair that looks strongly bullish to me is EURCHF.
The market successfully broke and closed above a key daily horizontal resistance.
The next strong resistance is 0.948.
It will most likely be the next goal for the buyers.
❤️Please, support my work with like, thank you!❤️
I am part of Trade Nation's Influencer program and receive a monthly fee for using their TradingView charts in my analysis.
