EURCHF: Expecting Bullish Continuation! Here is Why
The charts are full of distraction, disturbance and are a graveyard of fear and greed which shall not cloud our judgement on the current state of affairs in the EURCHF pair price action which suggests a high likelihood of a coming move up.
Disclosure: I am part of Trade Nation's Influencer program and receive a monthly fee for using their TradingView charts in my analysis.
❤️ Please, support our work with like & comment! ❤️
EUR (Euro)

EUR/CHF BUYERS WILL DOMINATE THE MARKET|LONG
Hello, Friends!
EUR/CHF is trending up which is clear from the green colour of the previous weekly candle. However, the price has locally plunged into the oversold territory. Which can be told from its proximity to the BB lower band. Which presents a great trend following opportunity for a long trade from the support line below towards the supply level of 0.963.
Disclosure: I am part of Trade Nation's Influencer program and receive a monthly fee for using their TradingView charts in my analysis.
✅LIKE AND COMMENT MY IDEAS✅

EURUSD Potential DownsidesHey Traders, in today's trading session we are monitoring EURUSD for a selling opportunity around 1.08500 zone, EURUSD is trading in a downtrend and currently is in a correction phase in which it is approaching the trend at 1.08500 support and resistance area.
Trade safe, Joe.

EURUSD Channel Down bottomed. Short term buy.EURUSD is trading inside a (1h) Channel Down pattern, which just reached its bottom.
Last time that happened, the market rallied by 1.25%.
Trading Plan:
1. Buy on the current market price.
Targets:
1. 1.09200 (+1.25%).
Tips:
1. The RSI (1h) is trading on higher lows, which is a bullish divegernce in contrast to the price's lower lows. Standard bottom signal.
Please like, follow and comment!!

EUR_CHF SUPPORT AHEAD|LONG|
✅EUR_CHF will be retesting a support level of 0.9500 soon
From where I am expecting a bullish reaction
With the price going up but we need
To wait for a reversal pattern to form
Before entering the trade, so that we
Get a higher success probability of the trade
LONG🚀
✅Like and subscribe to never miss a new idea!✅
Disclosure: I am part of Trade Nation's Influencer program and receive a monthly fee for using their TradingView charts in my analysis.

HelenP. I Euro will decline to 1.0710, breaking support levelHi folks today I'm prepared for you Euro analytics. Euro recently tested the Support Zone, but buyers couldn't push the price higher. After a weak reaction, the price started to decline, showing that sellers are still strong. Now, it is trading near this support area, and I expect further downward movement. If sellers maintain pressure, EUR could break below the Support Zone and decline toward 1.0710 points, which coincides with the trend line. This level will be crucial—if the price bounces, we might see a local rebound, but if it breaks, a deeper drop could follow. Looking at past price action, we can see that the trend line has acted as strong support multiple times. However, each test weakens the level, increasing the chances of a breakdown. If the price reaches 1.0710 points, I will watch how it reacts. A clear breakdown could push EUR/USD lower, potentially toward 1.0425 (Support 2). For now, I anticipate a decline to 1.0710 points, where the price will decide its next move. My goal remains at 1.0710 points. If you like my analytics you may support me with your like/comment ❤️

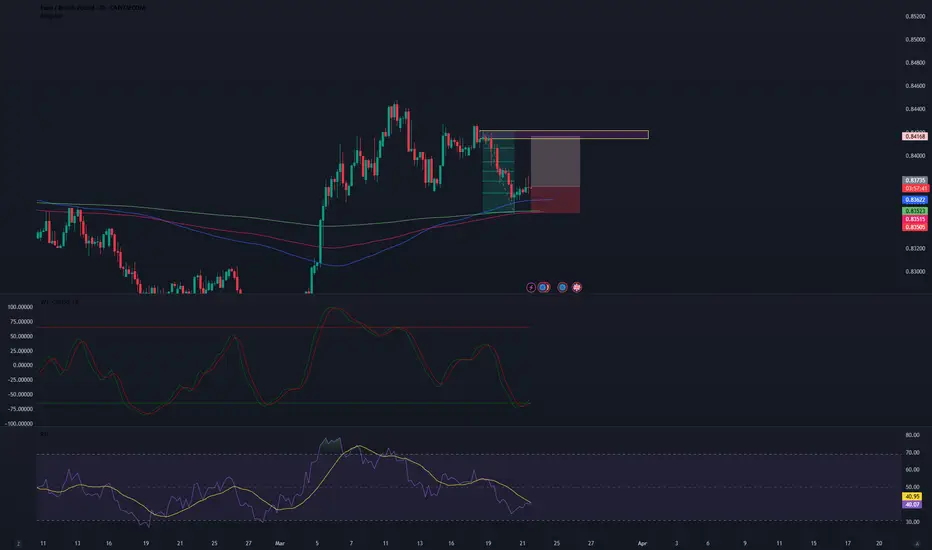
EUR/GBP LONG 4H
Hi, my name is Russo Andrea and I am a Forex Trader. Today I want to talk to you about a trading strategy that I am considering on EUR/GBP, a very interesting pair for those who, like me, operate in the currency markets.
The idea behind this trade is to go LONG on EUR/GBP. After analyzing the technical data and fundamentals, I believe that there is an interesting profit opportunity. Here are the details of my strategy:
Entry Point: 0.83781
Stop Loss (SL): 0.8550
Take Profit (TP): 0.84168
Trade Rationale: This trade is based on a combination of technical and fundamental analysis. Looking at the charts, we have a key support near the 0.83781 area, which represents an ideal level to open a long position. Technical indicators, such as RSI and moving averages, are showing signs of a possible bullish reversal.
On the other hand, my Stop Loss at 0.8550 was strategically placed to limit losses if the market moves against us, while still maintaining an acceptable risk for this trade. The Take Profit at 0.84168, on the other hand, represents a realistic level of profit based on previous resistances.
Risk Management: Risk management is essential in trading. It is important to always stick to your plan, without being influenced by emotions. With this trade, I am maintaining a balanced risk/reward ratio, increasing the probability of success in the long term.
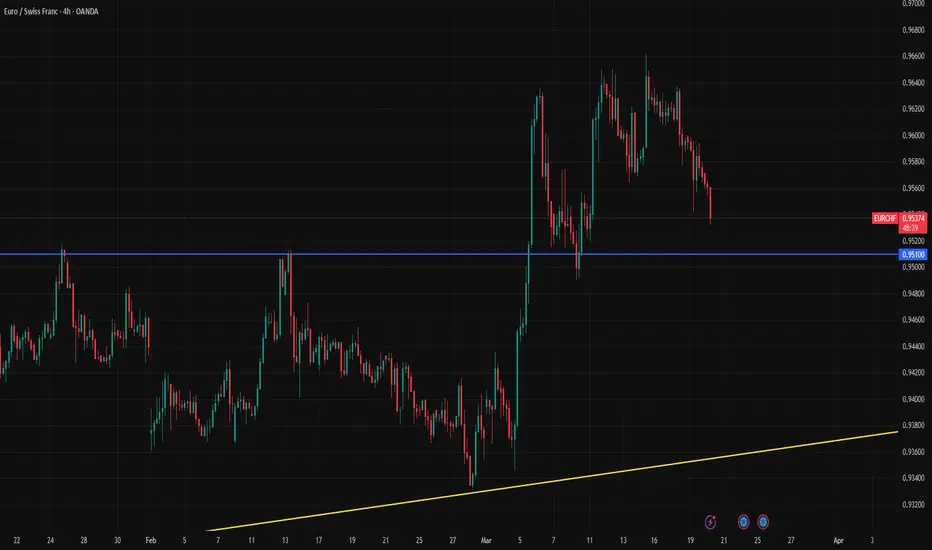
Long EURCHFGood morning traders,
EURCHF is above 200 MA, higher lows and higher highs after bottom at 0.92 . I´m expecting a bullish leg till 0.98 area
Scenario will be cancelled below 0.94 on a daily basis
6 Trading Rules :
1. Never add to a losing position .
2. Don´t be the first to buy low and sell high ., and don´t be the last one to exit
3. Think like a fundamentalist, trade like a technician .
4. Keep your analysis simple
5. Start small and increase exposure when trend is confirming your analysis
6. The hard trade is the right trade
Have a great weekend

EUR/NZD BEST PLACE TO BUY FROM|LONG
EUR/NZD SIGNAL
Trade Direction: long
Entry Level: 1.881
Target Level: 1.888
Stop Loss: 1.876
RISK PROFILE
Risk level: medium
Suggested risk: 1%
Timeframe: 1h
Disclosure: I am part of Trade Nation's Influencer program and receive a monthly fee for using their TradingView charts in my analysis.
✅LIKE AND COMMENT MY IDEAS✅

EUR/USD 4H Trading Plan: Buy Setup & Target Projection📊 EUR/USD 4H Analysis
🔵 Support Zone (1.07584 - 1.0800) 🔵
📌 Expected Reversal Area – Buyers might step in here.
⚠️ Stop-Loss Below ❌ (If price breaks lower, trade is invalid).
🟦 Resistance Zone (~1.0875 - 1.0900) 🟦
📌 First Hurdle – Price may face resistance here before moving higher.
🎯 Target Point: 1.10229 🎯
✅ Final Take-Profit Level – If price reaches here, trade is successful!
📉 Plan:
🔻 Expect a drop into support first…
🔄 Bullish reversal from support…
🚀 Uptrend toward 1.10229!
🔴 Stop-Loss Below 1.07584 (🚫 Safety Net).
🟢 Entry Around Support Zone (✅ Buy Opportunity).
🔵 Exit at Target Point (1.10229) (💰 Profit Zone).
📝 Final Thought:
If the price respects the support zone 🟢, a BUY trade is valid. If it breaks lower 🔴, it's best to step out! 🚀

EUR/NZD BUY SETUP – BULLISH OUTLOOK! EUR/NZD BUY SETUP – BULLISH OUTLOOK! 📈
🔹 Pair: EUR/NZD
🔹 Bias: Bullish ✅
🔹 Entry Zone:
🔹 Stop Loss (SL): 🔴
🔹 Take Profit (TP): 🏆
🔍 Market Analysis:
✅ Strong bullish structure with higher highs & higher lows
✅ Institutional order flow supporting buyers
✅ Liquidity grab before the move up
✅ Confluence with key support zone
📊 Chart shows a high-probability buy setup. If price holds above support, expect bullish continuation. 🚀
💬 What’s your outlook on EUR/NZD? Comment below! 👇🔥
#ForexTrading #EURNZD #SmartMoneyConcepts #TradingView #FXSignals #ForexAnalysis

Bullish bounce off 50% Fibonacci support?EUR/CAD is falling towards the pivot which acts as a pullback support and could bounce to the 1st resistance.
Pivot: 1.54200
1st Support: 1.53020
1st Resistance: 1.55988
Risk Warning:
Trading Forex and CFDs carries a high level of risk to your capital and you should only trade with money you can afford to lose. Trading Forex and CFDs may not be suitable for all investors, so please ensure that you fully understand the risks involved and seek independent advice if necessary.
Disclaimer:
The above opinions given constitute general market commentary, and do not constitute the opinion or advice of IC Markets or any form of personal or investment advice.
Any opinions, news, research, analyses, prices, other information, or links to third-party sites contained on this website are provided on an "as-is" basis, are intended only to be informative, is not an advice nor a recommendation, nor research, or a record of our trading prices, or an offer of, or solicitation for a transaction in any financial instrument and thus should not be treated as such. The information provided does not involve any specific investment objectives, financial situation and needs of any specific person who may receive it. Please be aware, that past performance is not a reliable indicator of future performance and/or results. Past Performance or Forward-looking scenarios based upon the reasonable beliefs of the third-party provider are not a guarantee of future performance. Actual results may differ materially from those anticipated in forward-looking or past performance statements. IC Markets makes no representation or warranty and assumes no liability as to the accuracy or completeness of the information provided, nor any loss arising from any investment based on a recommendation, forecast or any information supplied by any third-party.

Bearish drop?EUR/NZD has rejected of the pivot which is a pullback resistance and could drop to the 1st support.
Pivot: 1.88951
1st Support: 1.86727
1st Resistance: 1.89710
Risk Warning:
Trading Forex and CFDs carries a high level of risk to your capital and you should only trade with money you can afford to lose. Trading Forex and CFDs may not be suitable for all investors, so please ensure that you fully understand the risks involved and seek independent advice if necessary.
Disclaimer:
The above opinions given constitute general market commentary, and do not constitute the opinion or advice of IC Markets or any form of personal or investment advice.
Any opinions, news, research, analyses, prices, other information, or links to third-party sites contained on this website are provided on an "as-is" basis, are intended only to be informative, is not an advice nor a recommendation, nor research, or a record of our trading prices, or an offer of, or solicitation for a transaction in any financial instrument and thus should not be treated as such. The information provided does not involve any specific investment objectives, financial situation and needs of any specific person who may receive it. Please be aware, that past performance is not a reliable indicator of future performance and/or results. Past Performance or Forward-looking scenarios based upon the reasonable beliefs of the third-party provider are not a guarantee of future performance. Actual results may differ materially from those anticipated in forward-looking or past performance statements. IC Markets makes no representation or warranty and assumes no liability as to the accuracy or completeness of the information provided, nor any loss arising from any investment based on a recommendation, forecast or any information supplied by any third-party.

Looking for shorts on EUR/USD on pullback from previous EU seshLooking for a retrace, new liq. sweep that will make an nice order block then enter on BOS confirmation. These confluences will give a solid short position with a nice 2R with a good stop buffer and previous session highs. This draw down is result of bad EU news and the US not cutting the interest rates just yet leading to a strong dollar. These shorts will probably not take out the full move on EUR/USD but this pull back and short is highly likely to play out with the end of the week near. Comment below what you think.

EURGBP: Rectangle Top rejection. Sell opportunity.EURGBP is neutral on its 1D technical outlook (RSI = 52.272, MACD = 0.002, ADX = 25.202), going from an almost overbought RSI to neutral as it got rejected on the R1 Zone. That is the top of the 6 month Rectangle pattern, where the last rejection pulled the price all the way down to the S1 Zone. This time the presence of both the LH and HL trendlines makes us consider a slightly tighter trading range. The trade is short, TP = 0.82600.
See how our prior idea has worked out:
## If you like our free content follow our profile to get more daily ideas. ##
## Comments and likes are greatly appreciated. ##

Bearish reversal?EUR/USD is rising towards the resistance level which is a pullback resistance that aligns with the 50% Fibonacci retracement and could drop from this level to our take profit.
Entry: 1.0871
Why we like it:
There is a pullback resistance level that lines up with the 50% Fibonacci retracement.
Stop loss: 1.0911
Why we like it:"
There is an overlap resistance level.
Take profit: 1.0809
Why we like it:
There is a pullback support level.
Enjoying your TradingView experience? Review us!
Please be advised that the information presented on TradingView is provided to Vantage (‘Vantage Global Limited’, ‘we’) by a third-party provider (‘Everest Fortune Group’). Please be reminded that you are solely responsible for the trading decisions on your account. There is a very high degree of risk involved in trading. Any information and/or content is intended entirely for research, educational and informational purposes only and does not constitute investment or consultation advice or investment strategy. The information is not tailored to the investment needs of any specific person and therefore does not involve a consideration of any of the investment objectives, financial situation or needs of any viewer that may receive it. Kindly also note that past performance is not a reliable indicator of future results. Actual results may differ materially from those anticipated in forward-looking or past performance statements. We assume no liability as to the accuracy or completeness of any of the information and/or content provided herein and the Company cannot be held responsible for any omission, mistake nor for any loss or damage including without limitation to any loss of profit which may arise from reliance on any information supplied by Everest Fortune Group.

EURCHF BUY/LONGBy utilizing Fibonacci retracement levels, historical patterns, , we can formulate a hypothesis that the market might follow a similar trajectory if bullish sentiment prevails.

A possible short-term bullish set-up on EURCAD?Well, it seems that FX_IDC:EURCAD could be forming either a bullish pennant, or a falling wedge pattern in the near-term. Both patterns tend to result in a bullish breakout. However, we still require a confirmation. Without it, there is still a chance to see a move lower.
MARKETSCOM:EURCAD
Let us know what you think in the comments below.
Thank you.
74.2% of retail investor accounts lose money when trading CFDs with this provider. You should consider whether you understand how CFDs work and whether you can afford to take the high risk of losing your money. Past performance is not necessarily indicative of future results. The value of investments may fall as well as rise and the investor may not get back the amount initially invested. This content is not intended for nor applicable to residents of the UK. Cryptocurrency CFDs and spread bets are restricted in the UK for all retail clients.

EURCHF LongHi Everyone,
Hope you are all well and enjoyed my gold signal that hit all TP's
Here is our EURCHF Signal. wait for the 15 minute candle to close above the entry, and then for price to respect the entry, then we can enter. Here are the numbers.
EURCHF Buy
📊Entry: 0.95727
⚠️Sl: 0.95176
✔️TP1: 0.96349
✔️TP2: 0.97141
✔️TP3: 0.98148
Stick to the rules
Hope you all earn lots of profit.
Best wishes,
Sarah

EUR | USD THE DOLLAR SHAKES, THE EURO DANCES with PipGuardEUR | USD THE DOLLAR SHAKES, THE EURO DANCES with PipGuard
IF YOU LIKE MY ANALYSIS, CONGRATS, YOU’RE SMART.
NOW HIT THAT FOLLOW BUTTON, DROP A BOOST, AND LEAVE A COMMENT.
Come on, don’t be shy, those buttons won’t wear out. Support free and independent analysis, because if you want me to keep dropping these market gems, you gotta show some love. Otherwise, you’ll see me opening a shaved ice stand. 🍧
GOOD MORNING, DEAR NON-FRIENDS!
Yeah, because if you were my friends, we’d be throwing death stares at each other by the coffee machine every time someone dared to question my analysis. But instead, here I am—calm, composed, and totally not petty.
Today, we’re talking about EUR/USD. But first, a challenge: SHOW ME ANOTHER ANALYSIS FROM NOVEMBER THAT'S STILL ACCURATE TODAY.
Go check the related article. Do yourself a favor, so maybe you’ll stop busting my chops at the coffee machine. Oh, by the way, got a spare euro? No? Alright, no analysis for you.
Just kidding, just kidding. I know you’re smart, humble, and definitely not thin-skinned… or at least, I hope so, otherwise, get ready for another lawsuit.
Anyway, let’s be clear—my analysis is NOT financial advice.
No, you don’t need to mortgage your house and bet it all. Also, let’s be real, you don’t even have one! 😆
LET’S GET TO THE POINT.
Back in November, I called the U.S. recession.
Guess who didn’t call me? Bloomberg.
Guess who did? An investment fund.
And guess how it went? Badly. My spoken English is worse than a drunk tourist trying to order a beer in a London pub, so I panicked and hung up. 📞❌
Unless you want to talk money 💰 or women 💃, don’t call me. Write me. But again—only for money or women, not for emotional support. I’m not your therapist.
EUROPE, REARMAMENT, AND THE CIRCUS OF POWER.
Same old show:
The tall blond guy with the orange face? Check.
The bald dude in the tie? Still there.
The political circus? In full swing. 🎭
But let’s cut to the chase: if you’re in the Eurozone, BUY A HOUSE.
I did— 180K for 122 square meters of prime real estate. Solid deal.
And why?
Because the euro is set to rise. 📈
Because Russia is in an economic lockdown.
Because when sanctions lift, we’ll likely see a mini Russian market collapse.
And the dollar? The U.S. is reliving 2008, but this time, it’s even dumber.
What’s different? Instead of subprime mortgages, now it’s credit card debt spiraling out of control.
Yes, you heard me. Americans are sinking their economy with loans for iPhones, 85-inch TVs, and vacations to Hawaii.
And banks?
“No worries, the debt is under control.”
Oh yeah? So if you’re 100K in debt for a house, that’s a crisis, but if you blow 100K on home decor and luxury junk, that’s fine? Make it make sense.
But who cares—I’m Italian, I eat pasta for breakfast. 🍝 Their problem, not mine.
NOW, THE TECHNICAL ANALYSIS.
Trend is BULLISH, get that in your head. Look for long setups, not shorts. If you must short, do it only for retracements.
Reversal zone: 1.082 – 1.095.
If it closes above, we keep going up.
Watch out for liquidity between 1.099 and 1.10.
If price gets there, look for a key level on the 4H. If it reacts bearish, wait for confirmation before shorting. If it closes above, we send it to 1.21.
Other key support levels:
1.076 – 1.062, solid area for bullish reaction.
If that’s not enough, 1.060 – 1.052 is the ultimate buy zone.
If you mess up, toss your PC. 💻🔥
Kidding. Hold on tight, because price is going up from there.
IF MY ANALYSIS HELPED YOU, HIT FOLLOW, DROP A BOOST, LEAVE A COMMENT.
Or else… I’ll have to come find you.
Much love, PipGuard.

Watch Out for 0.9510 Support for EURCHFEURCHF is approaching the 0.9510 support level ahead of the SNB decision. Markets are currently pricing in a 25 basis point rate cut with a 68.1% probability. However, the recent relief in the Swiss franc may give the SNB reason to hold rates steady.
Our view is that the SNB will proceed with a 25 basis point cut today, and the 0.95–0.9510 support area is likely to hold. However, if this support zone breaks, it could trigger a medium-term selloff, potentially pushing EURCHF below 0.94.
Bearish drop?EUR/JPY is rising towards the pivot which is a pullback resistance and could drop to the 1st support.
Pivot: 162.24
1st Support: 160.36
1st Resistance: 164.02
Risk Warning:
Trading Forex and CFDs carries a high level of risk to your capital and you should only trade with money you can afford to lose. Trading Forex and CFDs may not be suitable for all investors, so please ensure that you fully understand the risks involved and seek independent advice if necessary.
Disclaimer:
The above opinions given constitute general market commentary, and do not constitute the opinion or advice of IC Markets or any form of personal or investment advice.
Any opinions, news, research, analyses, prices, other information, or links to third-party sites contained on this website are provided on an "as-is" basis, are intended only to be informative, is not an advice nor a recommendation, nor research, or a record of our trading prices, or an offer of, or solicitation for a transaction in any financial instrument and thus should not be treated as such. The information provided does not involve any specific investment objectives, financial situation and needs of any specific person who may receive it. Please be aware, that past performance is not a reliable indicator of future performance and/or results. Past Performance or Forward-looking scenarios based upon the reasonable beliefs of the third-party provider are not a guarantee of future performance. Actual results may differ materially from those anticipated in forward-looking or past performance statements. IC Markets makes no representation or warranty and assumes no liability as to the accuracy or completeness of the information provided, nor any loss arising from any investment based on a recommendation, forecast or any information supplied by any third-party.

Bearish reversal?EUR/GBP is rising towards the pivot and could reveres to the 1st support.
Pivot: 0.8401
1st Support: 0.8356
1st Resistance: 0.8444
Risk Warning:
Trading Forex and CFDs carries a high level of risk to your capital and you should only trade with money you can afford to lose. Trading Forex and CFDs may not be suitable for all investors, so please ensure that you fully understand the risks involved and seek independent advice if necessary.
Disclaimer:
The above opinions given constitute general market commentary, and do not constitute the opinion or advice of IC Markets or any form of personal or investment advice.
Any opinions, news, research, analyses, prices, other information, or links to third-party sites contained on this website are provided on an "as-is" basis, are intended only to be informative, is not an advice nor a recommendation, nor research, or a record of our trading prices, or an offer of, or solicitation for a transaction in any financial instrument and thus should not be treated as such. The information provided does not involve any specific investment objectives, financial situation and needs of any specific person who may receive it. Please be aware, that past performance is not a reliable indicator of future performance and/or results. Past Performance or Forward-looking scenarios based upon the reasonable beliefs of the third-party provider are not a guarantee of future performance. Actual results may differ materially from those anticipated in forward-looking or past performance statements. IC Markets makes no representation or warranty and assumes no liability as to the accuracy or completeness of the information provided, nor any loss arising from any investment based on a recommendation, forecast or any information supplied by any third-party.
