Could the Fiber reverse from here?The price is reacting off the pivot which is a pullback resistance and could drop from this level to the 1st 50% Fibonacci support.
Pivot: 1.1631
1st Support: 1.1552
1st Resistance: 1.1677
Risk Warning:
Trading Forex and CFDs carries a high level of risk to your capital and you should only trade with money you can afford to lose. Trading Forex and CFDs may not be suitable for all investors, so please ensure that you fully understand the risks involved and seek independent advice if necessary.
Disclaimer:
The above opinions given constitute general market commentary, and do not constitute the opinion or advice of IC Markets or any form of personal or investment advice.
Any opinions, news, research, analyses, prices, other information, or links to third-party sites contained on this website are provided on an "as-is" basis, are intended only to be informative, is not an advice nor a recommendation, nor research, or a record of our trading prices, or an offer of, or solicitation for a transaction in any financial instrument and thus should not be treated as such. The information provided does not involve any specific investment objectives, financial situation and needs of any specific person who may receive it. Please be aware, that past performance is not a reliable indicator of future performance and/or results. Past Performance or Forward-looking scenarios based upon the reasonable beliefs of the third-party provider are not a guarantee of future performance. Actual results may differ materially from those anticipated in forward-looking or past performance statements. IC Markets makes no representation or warranty and assumes no liability as to the accuracy or completeness of the information provided, nor any loss arising from any investment based on a recommendation, forecast or any information supplied by any third-party.
EUR (Euro)

EUR/USD 4-Hour Chart Analysis (ONDA)Euro/US Dollar (EUR/USD) exchange rate over a 4-hour interval, sourced from ONDA. The current rate is 1.16177, reflecting a 0.08% increase (+0.00093). The chart highlights a recent upward trend, with a resistance level around 1.16746 and a support zone between 1.15439 and 1.16000, as indicated by the shaded areas. The time frame covers late June to early July 2025.

EURUSD: Can it reach 1.1900?EURUSD is bullish on its 1D technical outlook (RSI = 65.234, MACD = 0.006, ADX = 20.419) and is going for a 3 week high. This is technically a long term bullish wave (since the January 13th 2025 low) on the 3 year Channel Up. We anticipate that this wave will go for the pattern's high by the end of the year, and being limited by the 7 year LH trendline, we expect to aim for at least 1.1900. The 1W RSI has started to post a sequence that resembles the last 3 major ones.
## If you like our free content follow our profile to get more daily ideas. ##
## Comments and likes are greatly appreciated. ##

EUR/CHF Channel Breakdown – Bearish MomentumThe EUR/CHF pair has broken down from a well-defined ascending parallel channel, indicating a shift in market structure and a possible continuation to the downside. The price had been consistently respecting the resistance zone near 0.9435–0.9440 (marked in red) and the support zone near 0.9375–0.9380 (marked in green), forming an upward-sloping consolidation channel.
After multiple rejections at the upper resistance, the price decisively broke below the support line with strong bearish momentum, confirming a bearish breakout from the channel.
🔻 Breakdown Implication
The height of the channel—measured from the support to the resistance—has been used to project the next potential downside target. The projected breakdown target is marked near 0.9309, which aligns with historical price reaction zones and provides a clean structure-based price objective.
This suggests the bearish move could extend further in the coming sessions unless the price quickly recovers and climbs back above the broken support, which would invalidate the breakdown structure.
🧠 Trading Outlook
Bias: Bearish after confirmed breakdown from channel
Entry (if not in already): Consider selling on retest of broken support (~0.9375)
Target: 0.9309 (based on channel height)
Stop Loss: Above 0.9390–0.9400 (above breakdown point)
This setup is ideal for momentum traders looking to capitalize on trend continuation after a failed bullish structure.
=================================================================
Disclosure: I am part of Trade Nation's Influencer program and receive a monthly fee for using their TradingView charts in my analysis.
=================================================================

EURO - Price can continue to decline inside wedge patternHi guys, this is my overview for EURUSD, feel free to check it and write your feedback in comments👊
Some days ago, price tried to grow, but failed and dropped below $1.1220 support level, after which started to grow in channel.
In rising channel, price broke $1.1220 level one more time and then rose to resistance line and then corrected.
Next, Euro rose to $1.1455 level and some time traded inside this level, until it broke it and continued to move up.
Price exited from rising channel and later started to decline inside wedge pattern, where it declined to $1.1455 level.
Recently, price bounced from this level and in a short time rose to resistance line of wedge pattern.
In my mind, Euro can continue to decline to $1.1400 support line of wedge, breaking support level.
If this post is useful to you, you can support me with like/boost and advice in comments❤️
Disclaimer: As part of ThinkMarkets’ Influencer Program, I am sponsored to share and publish their charts in my analysis.

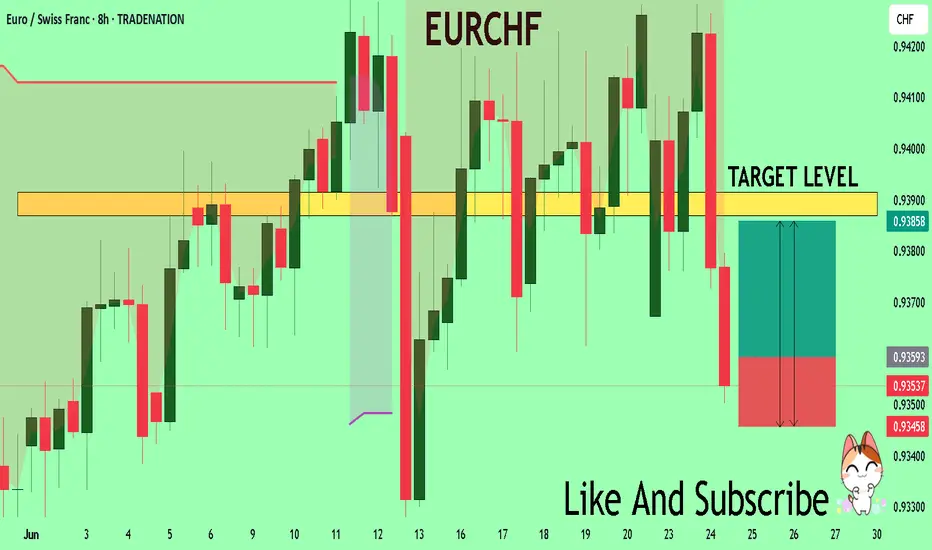
EURCHF Set To Grow! BUY!
My dear subscribers,
This is my opinion on the EURCHF next move:
The instrument tests an important psychological level 0.9359
Bias - Bullish
Technical Indicators: Supper Trend gives a precise Bullish signal, while Pivot Point HL predicts price changes and potential reversals in the market.
Target - 0.9386
My Stop Loss - 0.9345
About Used Indicators:
On the subsequent day, trading above the pivot point is thought to indicate ongoing bullish sentiment, while trading below the pivot point indicates bearish sentiment.
Disclosure: I am part of Trade Nation's Influencer program and receive a monthly fee for using their TradingView charts in my analysis.
———————————
WISH YOU ALL LUCK
EURNZD Eyes 1.99 — Technical & Fundamental Bulls AlignedToday, I want to analyze EURNZD ( OANDA:EURNZD ) for you, which is in good shape both technically and fundamentally .
Please stay with me.
EURNZD is moving close to the Support zone(1.88750 NZD-1.7970 NZD) and 100_SMA(Daily) and has managed to form a Double Bottom Pattern .
From the perspective of Elliott Wave theory , EURNZD seems to have completed the main wave 4 , and we should wait for the main wave 5 . The main wave 5 could complete at the Heavy Resistance zone(2.120 NZD-1.9927 NZD) .
-----------------------------------
EURNZD – Fundamental Analysis:
The EURNZD pair currently reflects a divergence between two very different economic outlooks.
Eurozone (EUR):
The European Central Bank (ECB) has recently begun cutting interest rates to support slowing economic activity, especially in the industrial and manufacturing sectors. Despite this dovish shift, inflation remains relatively under control, and the euro has held up well against riskier currencies thanks to global uncertainty and safe-haven flows.
New Zealand (NZD):
New Zealand's economy is under pressure. The latest GDP figures confirmed a weak growth outlook, and signs of a technical recession are mounting. While the Reserve Bank of New Zealand (RBNZ) has maintained a relatively hawkish tone, it faces a dilemma: inflation is sticky, but domestic demand and housing remain fragile. The RBNZ may be forced to soften its stance sooner than expected.
Outlook:
This fundamental backdrop supports a bullish bias for EURNZD. The euro’s relative stability versus the increasingly vulnerable New Zealand dollar makes this pair attractive for long positions — especially if upcoming NZ data disappoints or global risk sentiment weakens further.
-----------------------------------
Based on the above explanation, I expect EURNZD to rise to at least 1.9917 NZD .
Note: Stop Loss(SL): 1.8779 NZD
Please respect each other's ideas and express them politely if you agree or disagree.
Euro/New Zealand Dollar Analyze (EURNZD), Daily time frame.
Be sure to follow the updated ideas.
Do not forget to put a Stop loss for your positions (For every position you want to open).
Please follow your strategy and updates; this is just my Idea, and I will gladly see your ideas in this post.
Please do not forget the ✅' like '✅ button 🙏😊 & Share it with your friends; thanks, and Trade safe.

The Trap Has Been Set. Will Price Take the Bait?EURNZD just broke structure on the 4H chart and is now pulling back into a zone where things could get interesting. After the initial drop, price is retracing into an area filled with imbalance and liquidity.
This looks like a setup where the market may lure in buyers before making its next move lower. If sellers step in where expected, we could see a clean continuation to the downside.
As long as price remains beneath that reaction zone, the bearish narrative stays intact. One to keep an eye on in the coming sessions.
Just a word of caution : Always wait for a clear change of character on the 15-minute timeframe before considering any entry. If that confirmation doesn’t show up, price can easily break through the zone and continue climbing.

EURCHF Bearish retest at 0.9430 resistanceTrend Overview:
The EUR/CHF currency pair remains under bearish pressure, consistent with the broader downtrend. Current price action reflects a corrective pullback, which may be temporary before the next leg lower.
Key Levels to Watch:
Resistance (Key Pivot):
0.9430 – prior consolidation zone and short-term resistance
Above that: 0.9450 and 0.9470
Support:
Immediate downside target: 0.9380
Further support at 0.9360 and 0.9330
Scenarios:
Bearish Continuation:
If the current pullback stalls at 0.9430, it could mark a bearish rejection
This would likely resume the downtrend toward 0.9380, then 0.9360 and 0.9330
Bullish Reversal:
A daily close above 0.9430 would challenge the bearish structure
May signal bullish momentum and open upside toward 0.9450 and 0.9470
Conclusion:
EUR/CHF remains bearish while trading below 0.9430. A failure to break this level should reinforce the downtrend, with lower targets in focus. However, a confirmed breakout above 0.9430 would invalidate the current bearish bias and suggest a shift in sentiment toward modest upside. Traders should watch for rejection or breakout signals at this critical level.
This communication is for informational purposes only and should not be viewed as any form of recommendation as to a particular course of action or as investment advice. It is not intended as an offer or solicitation for the purchase or sale of any financial instrument or as an official confirmation of any transaction. Opinions, estimates and assumptions expressed herein are made as of the date of this communication and are subject to change without notice. This communication has been prepared based upon information, including market prices, data and other information, believed to be reliable; however, Trade Nation does not warrant its completeness or accuracy. All market prices and market data contained in or attached to this communication are indicative and subject to change without notice.

EURGBP - Bullish No More!Hello TradingView Family / Fellow Traders. This is Richard, also known as theSignalyst.
📈 EURGBP has been overall bullish trading within the rising channel marked in blue. And it is currently retesting the upper bound of the channel.
Moreover, the orange zone is a strong weekly resistance.
🏹 Thus, the highlighted red circle is a strong area to look for sell setups as it is the intersection of the upper blue trendline and resistance.
📚 As per my trading style:
As #EURGBP is around the red circle zone, I will be looking for bearish reversal setups (like a double top pattern, trendline break , and so on...)
📚 Always follow your trading plan regarding entry, risk management, and trade management.
Good luck!
All Strategies Are Good; If Managed Properly!
~Rich
Disclosure: I am part of Trade Nation's Influencer program and receive a monthly fee for using their TradingView charts in my analysis.

EURUSD - Shifting from Bearish to Bullish Soon!Hello TradingView Family / Fellow Traders. This is Richard, also known as theSignalyst.
📈EURUSD has been overall bullish trading within the rising wedge marked in blue.
Moreover, the orange zone is a strong support!
🏹 Thus, the highlighted blue circle is a strong area to look for buy setups as it is the intersection of support and lower blue trendline acting as a non-horizontal support.
📚 As per my trading style:
As #EURUSD approaches the blue circle zone, I will be looking for bullish reversal setups (like a double bottom pattern, trendline break , and so on...)
📚 Always follow your trading plan regarding entry, risk management, and trade management.
Good luck!
All Strategies Are Good; If Managed Properly!
~Rich
Disclosure: I am part of Trade Nation's Influencer program and receive a monthly fee for using their TradingView charts in my analysis.

EURUSD Potential UpsidesHey Traders, in the coming week we are monitoring EURUSD for a buying opportunity around 1.14500 zone, EURUSD is trading in an uptrend and currently is in a correction phase in which it is approaching the trend at 1.14500 support and resistance area.
Trade safe, Joe.

Bullish rise?The Fiber (EUR/USD) has broken out of the pivot and could rise to the 1st resistance.
Pivot: 1.1569
1st Support: 1.1530
1st Resistance: 1.1631
Risk Warning:
Trading Forex and CFDs carries a high level of risk to your capital and you should only trade with money you can afford to lose. Trading Forex and CFDs may not be suitable for all investors, so please ensure that you fully understand the risks involved and seek independent advice if necessary.
Disclaimer:
The above opinions given constitute general market commentary, and do not constitute the opinion or advice of IC Markets or any form of personal or investment advice.
Any opinions, news, research, analyses, prices, other information, or links to third-party sites contained on this website are provided on an "as-is" basis, are intended only to be informative, is not an advice nor a recommendation, nor research, or a record of our trading prices, or an offer of, or solicitation for a transaction in any financial instrument and thus should not be treated as such. The information provided does not involve any specific investment objectives, financial situation and needs of any specific person who may receive it. Please be aware, that past performance is not a reliable indicator of future performance and/or results. Past Performance or Forward-looking scenarios based upon the reasonable beliefs of the third-party provider are not a guarantee of future performance. Actual results may differ materially from those anticipated in forward-looking or past performance statements. IC Markets makes no representation or warranty and assumes no liability as to the accuracy or completeness of the information provided, nor any loss arising from any investment based on a recommendation, forecast or any information supplied by any third-party.

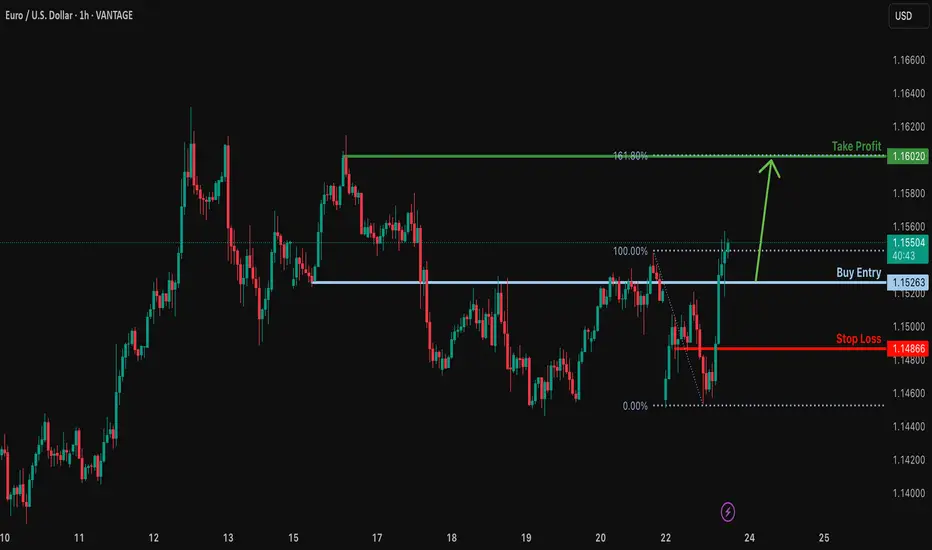
Bullish rise?EUR/USD is falling towards the support level which is an overlap support and could bounce from this level too ur take profit.
Entry: 1.1526
Why we like it:
There is an overlap support level.
Stop loss: 1.1486
Why we like it:
There is a pullback support level.
Take profit: 1.1602
Why we like it:
There is a pullback resistance level that aligns with the 161.8% Fibonacci extension.
Enjoying your TradingView experience? Review us!
Please be advised that the information presented on TradingView is provided to Vantage (‘Vantage Global Limited’, ‘we’) by a third-party provider (‘Everest Fortune Group’). Please be reminded that you are solely responsible for the trading decisions on your account. There is a very high degree of risk involved in trading. Any information and/or content is intended entirely for research, educational and informational purposes only and does not constitute investment or consultation advice or investment strategy. The information is not tailored to the investment needs of any specific person and therefore does not involve a consideration of any of the investment objectives, financial situation or needs of any viewer that may receive it. Kindly also note that past performance is not a reliable indicator of future results. Actual results may differ materially from those anticipated in forward-looking or past performance statements. We assume no liability as to the accuracy or completeness of any of the information and/or content provided herein and the Company cannot be held responsible for any omission, mistake nor for any loss or damage including without limitation to any loss of profit which may arise from reliance on any information supplied by Everest Fortune Group.
EURUSD Channel Up formed bottom. Heavily bullish.The EURUSD pair has been trading within a Channel Up since the May 12 Low. Today it hit its 4H MA100 (green trend-line) for the first time since May 12 and having just broken also above its 4H MA50 (blue trend-line), it confirmed that the pattern has already priced its bottom.
This is initiating the new Bullish Leg and based on the previous two, it should grow by at least +3.21%. We have a modest short-term Target at 1.1800.
-------------------------------------------------------------------------------
** Please LIKE 👍, FOLLOW ✅, SHARE 🙌 and COMMENT ✍ if you enjoy this idea! Also share your ideas and charts in the comments section below! This is best way to keep it relevant, support us, keep the content here free and allow the idea to reach as many people as possible. **
-------------------------------------------------------------------------------
Disclosure: I am part of Trade Nation's Influencer program and receive a monthly fee for using their TradingView charts in my analysis.
💸💸💸💸💸💸
👇 👇 👇 👇 👇 👇

EUR/USD 2-Hour Chart Analysis2-hour candlestick chart for the Euro/U.S. Dollar (EUR/USD) currency pair, sourced from OANDA, as of June 23, 2025. The current exchange rate is 1.14705, reflecting a 0.45% decrease (-0.00517). The chart highlights recent price movements, with a marked resistance zone around 1.15218 and a support zone near 1.14483. An upward trend is indicated with an arrow, suggesting potential price action toward the resistance level.

EURNZD Will Go Higher From Support! Buy!
Take a look at our analysis for EURNZD.
Time Frame: 1h
Current Trend: Bullish
Sentiment: Oversold (based on 7-period RSI)
Forecast: Bullish
The market is on a crucial zone of demand 1.922.
The oversold market condition in a combination with key structure gives us a relatively strong bullish signal with goal 1.930 level.
P.S
We determine oversold/overbought condition with RSI indicator.
When it drops below 30 - the market is considered to be oversold.
When it bounces above 70 - the market is considered to be overbought.
Disclosure: I am part of Trade Nation's Influencer program and receive a monthly fee for using their TradingView charts in my analysis.
Like and subscribe and comment my ideas if you enjoy them!

EURUSD Long As the war escalated over the weekend market gapped during Asia session invalidating our initial forecast. (Linked Idea). Looking for the long on EURUSD.

EURJPY - Over-Bought Big Time!Hello TradingView Family / Fellow Traders. This is Richard, also known as theSignalyst.
📈EURJPY has been overall bullish trading within the rising channel marked in blue. However, it is currently retesting the upper bound of the channel.
Moreover, the green zone is a major weekly supply.
🏹 Thus, the highlighted red circle is a strong area to look for sell setups as it is the intersection of the upper blue trendline and weekly supply.
📚 As per my trading style:
As #EURJPY approaches the red circle zone, I will be looking for bearish reversal setups (like a double top pattern, trendline break , and so on...)
📚 Always follow your trading plan regarding entry, risk management, and trade management.
Good luck!
All Strategies Are Good; If Managed Properly!
~Rich
Disclosure: I am part of Trade Nation's Influencer program and receive a monthly fee for using their TradingView charts in my analysis.

EUR/CHF SHORT FROM RESISTANCE
Hello, Friends!
We are going short on the EUR/CHF with the target of 0.938 level, because the pair is overbought and will soon hit the resistance line above. We deduced the overbought condition from the price being near to the upper BB band. However, we should use low risk here because the 1W TF is green and gives us a counter-signal.
Disclosure: I am part of Trade Nation's Influencer program and receive a monthly fee for using their TradingView charts in my analysis.
✅LIKE AND COMMENT MY IDEAS✅

EUR/NZD Breakout Done , Long Setup Valid To Get 250 Pips !Here is my EUR/NZD 4H Chart and my opinion is we have now a very good breakout after a lot of time in sideway so we can buy this pair if the price go back to retest the broken res and new support , so we should wait the price to go back to retest it and if we have a good bullish price action then we will enter a buy trade and targeting a new high .

EURCHF Analysis – “Euro Inches Higher, But Safe-Haven CHF LurksEURCHF is breaking out from a symmetrical triangle, indicating potential bullish momentum.
Key resistances to watch:
0.9445 – local swing high
0.9498 – potential measured target from the triangle breakout
Entry on retest of the triangle may offer a favorable risk-reward opportunity.
However, upside could be capped if CHF regains strength.
Structure Bias: Bullish breakout, confirmation needed with a clean retest and sustained move above 0.9440
📊 Current Bias: Cautiously Bullish
🧩 Key Fundamentals Driving EURCHF
EUR Side (Neutral to Slightly Bearish):
ECB remains cautious: June’s Economic Bulletin showed soft patches in core inflation and weak consumer activity.
German & French PMIs are mixed; services weaker than expected.
Political uncertainty (France snap elections) weighs on EUR sentiment in the medium term.
CHF Side (Fundamentally Stronger):
SNB is cautious but hawkish: Monetary policy assessment showed a steady hand, maintaining rates with no clear signal of easing.
Safe-haven flows persist due to:
Middle East risk (Israel–Iran escalation)
Russia–Ukraine tensions
Weak equity sentiment
CHF remains supported on global risk aversion, even with SNB standing pat.
⚠️ Risks That May Reverse or Accelerate Trend
Breakout fails to hold → Bearish fakeout leads to drop toward 0.9290 again
Renewed CHF strength from geopolitical shocks
Eurozone political turbulence (especially France & ECB doves)
🗓️ Important News to Watch
🇨🇭 Swiss CPI, SNB statements
🇪🇺 Eurozone PMI Flash (June 21), CPI (June 28), and political updates
Global market risk sentiment (VIX, bonds, oil, Iran/Israel news)
🏁 Which Asset Might Lead the Broader Move?
EURCHF is lagging behind EURUSD and USDCHF, but provides clean geopolitical risk signals. If markets stabilize, this pair has upside potential. However, if fear returns, CHF may quickly regain control, trapping long trades.

Bearish reversal?EUR/USD is rising towards the resistance level which is a pullback resistance that lines up with the 61.8% Fibonacci retracement and could reverse from this level to our take profit.
Entry: 1.1555
Why we like it:
There is a pullback resistance that lines up with the 61.8% Fibonacci retracement.
Stop loss: 1.1608
Why we like it:
There is a pullback resistance.
Take profit: 1.1483
Why we like it:
There is a pullback support level that aligns with the 61.8% Fibonacci retracement.
Enjoying your TradingView experience? Review us!
Please be advised that the information presented on TradingView is provided to Vantage (‘Vantage Global Limited’, ‘we’) by a third-party provider (‘Everest Fortune Group’). Please be reminded that you are solely responsible for the trading decisions on your account. There is a very high degree of risk involved in trading. Any information and/or content is intended entirely for research, educational and informational purposes only and does not constitute investment or consultation advice or investment strategy. The information is not tailored to the investment needs of any specific person and therefore does not involve a consideration of any of the investment objectives, financial situation or needs of any viewer that may receive it. Kindly also note that past performance is not a reliable indicator of future results. Actual results may differ materially from those anticipated in forward-looking or past performance statements. We assume no liability as to the accuracy or completeness of any of the information and/or content provided herein and the Company cannot be held responsible for any omission, mistake nor for any loss or damage including without limitation to any loss of profit which may arise from reliance on any information supplied by Everest Fortune Group.
