#EURCHF 4HEURCHF (4H Timeframe) Analysis
Market Structure:
The price is forming a rising wedge pattern, which is a bearish reversal setup. This pattern indicates weakening bullish momentum as the price narrows toward the upper boundary. A breakout below the wedge support suggests the potential for a bearish move.
Forecast:
A sell opportunity is anticipated if the price breaks below the rising wedge support, signaling the start of a downtrend.
Key Levels to Watch:
- Entry Zone: After the price breaks below the wedge support and confirms the breakout with a retest.
- Risk Management:
- Stop Loss: Placed above the recent swing high or the upper boundary of the wedge.
- Take Profit: Target key support levels below or Fibonacci retracement levels for potential downside movement.
Market Sentiment:
The rising wedge pattern suggests bearish sentiment as buying momentum weakens. Waiting for a confirmed breakout and retest ensures a more strategic entry aligned with market direction.
EUR (Euro)

EURUSD 21 Jan 2025 - Intraday Analysis - German ZEWThis is my Intraday analysis on EURUSD for 21 Jan 2025 based on Smart Money Concept (SMC) which includes the following:
Market Sentiment 4H Chart Analysis15m Chart Analysis
Market Sentiment
Dovish ECB Policy Expectations: Traders are anticipating a 25 basis point rate cut at each of the next four ECB policy meetings.
Economic Concerns: Subdued inflationary pressures and concerns over the Eurozone's economic outlook.
US Dollar Strength: Dollar appreciates following news that President Trump intends to review tariff policies.
4H Chart Analysis
1️⃣
🔹Swing Bearish
🔹INT Bearish
🔹Swing Pullback Phase (Pro Swing + Counter INT)
🔹At Swing Premium (reached extreme)
2️⃣
🔹After the Bearish BOS, price pulled back to the Swing EQ (50%) tapping into a Daily and a 4H Supply that caused a Bearish CHoCH and forming a Supply that failed yesterday with price creating a bullish INT Structure.
3️⃣
🔹As price reached the Bearish Swing Extreme, if we are going to continue bearish, this is the area that I prefer to be short from. Also note that after the Bullish iBOS, there will be a pullback required.
🔹Expectations is set to Bearish with more development on LTF to confirm.
15m Chart Analysis
1️⃣
🔹Swing Bearish
🔹INT Bullish
🔹Swing Pullback Phase (Pro Swing + Counter INT)
🔹At Swing Premium (reached extreme)
2️⃣
🔹Price finally broken the range from Jan 16 and reached the bearish Swing Extreme forming Bullish INT Structure.
🔹There is probability that Swing High may be broken based on the Daily/Weekly requirements for pullback and the current market sentiment (Risk Off) as of US Tariffs announcement from Trump yesterday.
3️⃣
🔹My technical expectations is set to Bearish and looking for Shorts but I need to see a bearish iBOS before any executions.

Bearish reversal off pullback resistance?EUR/NOK is rising towards the pivot and could reverse to the 1st support which has been identified as a pullback support that lines up with the 38.2% Fibonacci retracement.
Pivot: 11.80157
1st Support: 11.73739
1st Resistance: 11.87719
Risk Warning:
Trading Forex and CFDs carries a high level of risk to your capital and you should only trade with money you can afford to lose. Trading Forex and CFDs may not be suitable for all investors, so please ensure that you fully understand the risks involved and seek independent advice if necessary.
Disclaimer:
The above opinions given constitute general market commentary, and do not constitute the opinion or advice of IC Markets or any form of personal or investment advice.
Any opinions, news, research, analyses, prices, other information, or links to third-party sites contained on this website are provided on an "as-is" basis, are intended only to be informative, is not an advice nor a recommendation, nor research, or a record of our trading prices, or an offer of, or solicitation for a transaction in any financial instrument and thus should not be treated as such. The information provided does not involve any specific investment objectives, financial situation and needs of any specific person who may receive it. Please be aware, that past performance is not a reliable indicator of future performance and/or results. Past Performance or Forward-looking scenarios based upon the reasonable beliefs of the third-party provider are not a guarantee of future performance. Actual results may differ materially from those anticipated in forward-looking or past performance statements. IC Markets makes no representation or warranty and assumes no liability as to the accuracy or completeness of the information provided, nor any loss arising from any investment based on a recommendation, forecast or any information supplied by any third-party.

Bearish reversal?The Fiber (EUR/USD) is rising towards the pivot and could reverse to the 1st support.
Pivot: 1.0454
1st Support: 1.0348
1st Resistance: 1.0536
Risk Warning:
Trading Forex and CFDs carries a high level of risk to your capital and you should only trade with money you can afford to lose. Trading Forex and CFDs may not be suitable for all investors, so please ensure that you fully understand the risks involved and seek independent advice if necessary.
Disclaimer:
The above opinions given constitute general market commentary, and do not constitute the opinion or advice of IC Markets or any form of personal or investment advice.
Any opinions, news, research, analyses, prices, other information, or links to third-party sites contained on this website are provided on an "as-is" basis, are intended only to be informative, is not an advice nor a recommendation, nor research, or a record of our trading prices, or an offer of, or solicitation for a transaction in any financial instrument and thus should not be treated as such. The information provided does not involve any specific investment objectives, financial situation and needs of any specific person who may receive it. Please be aware, that past performance is not a reliable indicator of future performance and/or results. Past Performance or Forward-looking scenarios based upon the reasonable beliefs of the third-party provider are not a guarantee of future performance. Actual results may differ materially from those anticipated in forward-looking or past performance statements. IC Markets makes no representation or warranty and assumes no liability as to the accuracy or completeness of the information provided, nor any loss arising from any investment based on a recommendation, forecast or any information supplied by any third-party.

Bearish drop?EUR/USD has reacted off the resistance level that is a pullback resistance that is slightly below the 100% Fibonacci projection and could drop from this level to our take profit.
Entry: 1.0426
Why we like it:
There is a pullback resistance level that is slightly below the 100% Fibonacci projection.
Stop loss: 1.0467
Why we like it:
There is a pullback resistance level that is slightly above the 61.8% Fibonacci retracement.
Take profit: 1.0343
Why we like it:
There is a pullback support level that aligns with the 50% Fibonacci retracement.
Enjoying your TradingView experience? Review us!
Please be advised that the information presented on TradingView is provided to Vantage (‘Vantage Global Limited’, ‘we’) by a third-party provider (‘Everest Fortune Group’). Please be reminded that you are solely responsible for the trading decisions on your account. There is a very high degree of risk involved in trading. Any information and/or content is intended entirely for research, educational and informational purposes only and does not constitute investment or consultation advice or investment strategy. The information is not tailored to the investment needs of any specific person and therefore does not involve a consideration of any of the investment objectives, financial situation or needs of any viewer that may receive it. Kindly also note that past performance is not a reliable indicator of future results. Actual results may differ materially from those anticipated in forward-looking or past performance statements. We assume no liability as to the accuracy or completeness of any of the information and/or content provided herein and the Company cannot be held responsible for any omission, mistake nor for any loss or damage including without limitation to any loss of profit which may arise from reliance on any information supplied by Everest Fortune Group.

EURUSD Potential UpsidesHey Traders, in today's trading session we are monitoring EURUSD for a buying opportunity around 1.03200 zone, EURUSD is trading in an uptrend and currently is in a correction phase in which it is approaching the trend at 1.03200 support and resistance area.
Trade safe, Joe.

#EURNZD 2HEURNZD (2H Timeframe) Analysis
Market Structure:
The price is currently testing the upper boundary of a channel, which acts as a key resistance level. This indicates a potential bearish scenario if the price fails to break above and instead respects the resistance.
Forecast:
A sell opportunity may arise if the price retests the channel resistance and confirms rejection, signaling the potential for a move toward the channel's lower boundary.
Key Levels to Watch:
- Entry Zone: After the price retests the channel resistance and shows signs of rejection.
- Risk Management:
- Stop Loss: Placed above the channel resistance or the recent swing high to minimize risk.
- Take Profit: Target the midline or the lower boundary of the channel for potential downside movement.
Market Sentiment:
The current price action at the channel resistance indicates a bearish bias, with sellers likely to dominate if the resistance holds. Waiting for confirmation of a retest ensures a strategic entry aligned with market momentum.

EURUSD Top of the Channel Down. How to trade this.The EURUSD pair gave us a solid short-term buy last time (January 13, see chart below) that easily hit the 1.02850 Target:
The price remains near the top of the 5-week Channel Down and technically this is a sell signal. Our Target is 1.01250, which is the -2.30% minimum decline that has taken place within this pattern as a Bearish Leg.
If the price rises more however and breaks above the 4H MA200 (orange trend-line), it will be the first time to do so since October 01 2024, and a technical buy signal. In that case, take the loss on the sell and go long instead, targeting 1.06250, which is both marginally below the starting level (Resistance 1) of the Channel Down, as well as significantly below the 2.0 Fibonacci extension.
-------------------------------------------------------------------------------
** Please LIKE 👍, FOLLOW ✅, SHARE 🙌 and COMMENT ✍ if you enjoy this idea! Also share your ideas and charts in the comments section below! This is best way to keep it relevant, support us, keep the content here free and allow the idea to reach as many people as possible. **
-------------------------------------------------------------------------------
💸💸💸💸💸💸
👇 👇 👇 👇 👇 👇

EURGBP to continue in the bullish channel?EURGBP - 24h expiry
Intraday dips continue to attract buyers and there is no clear indication that this sequence for trading is coming to an end.
20 4hour EMA is at 0.8429.
We look to buy dips.
Dip buying offers good risk/reward.
A break of the recent high at 0.8463 should result in a further move higher.
We look to Buy at 0.8431 (stop at 0.8409)
Our profit targets will be 0.8489 and 0.8499
Resistance: 0.8454 / 0.8464 / 0.8485
Support: 0.8436 / 0.8420 / 0.8404
Risk Disclaimer
The trade ideas beyond this page are for informational purposes only and do not constitute investment advice or a solicitation to trade. This information is provided by Signal Centre, a third-party unaffiliated with OANDA, and is intended for general circulation only. OANDA does not guarantee the accuracy of this information and assumes no responsibilities for the information provided by the third party. The information does not take into account the specific investment objectives, financial situation, or particular needs of any particular person. You should take into account your specific investment objectives, financial situation, and particular needs before making a commitment to trade, including seeking advice from an independent financial adviser regarding the suitability of the investment, under a separate engagement, as you deem fit.
You accept that you assume all risks in independently viewing the contents and selecting a chosen strategy.
Where the research is distributed in Singapore to a person who is not an Accredited Investor, Expert Investor or an Institutional Investor, Oanda Asia Pacific Pte Ltd (“OAP“) accepts legal responsibility for the contents of the report to such persons only to the extent required by law. Singapore customers should contact OAP at 6579 8289 for matters arising from, or in connection with, the information/research distributed.

EURUSD 20-24 Jan 2025 W4 - Weekly AnalysisThis is my Weekly analysis on EURUSD for 20-24 Jan 2025 W4 based on Smart Money Concept (SMC) which includes the following:
Market Sentiment Weekly Chart AnalysisDaily Chart Analysis4H Chart AnalysisEconomic Events for the Week
Market Sentiment
Interest Rate Differentials: The widening gap between US and Eurozone interest rates favors the USD. Higher US yields attract capital flows, supporting the USD against the euro.
Inflation Trends: While inflation in the Eurozone remains subdued, the US continues to grapple with sticky inflation, keeping the Fed cautious about easing policy. This divergence further supports the USD.
Energy Prices: Elevated energy prices, driven by geopolitical tensions or supply disruptions, could weigh on the Eurozone’s trade balance and economic growth, adding pressure to the euro.
Weekly Chart Analysis
1️⃣
🔹Swing Bearish
🔹Internal Bearish
🔹In Swing Discount
🔹Swing Continuation Phase (Pro Swing + Pro Internal)
2️⃣
🔹INT structure continuing bearish with iBOS following the Bearish Swing. (End of 2023 till end of 2024 was a pullback phase after the first bearish iBOS)
3️⃣
🔹After the bearish iBOS we expect a pullback, price tapped into liquidity below Nov 2022 which is above the weekly demand formed with the initiation of the bearish iBOS pullback phase.
🔹Expectations is for price to start a pullback phase from the Weekly demand zone / or from the liquidity sweep from the Nov 2022 low (Require Daily/4H confirmation).
Daily Chart Analysis
1️⃣
🔹Swing Bearish
🔹INT Bearish
🔹Swing Continuation Phase (Pro Swing + Pro Internal)
2️⃣
🔹Following the Bearish Swing BOS, INT Structure continuing bearish approaching the weekly demand zone.
3️⃣
🔹After the receint iBOS, price pulled back to EQ (50%) of the INT Structure but currently failed to create a new iBOS with a Bullish CHoCH forming a new Demand.
🔹Expectations is not clear as we could start a deep pullback to intiate the Weekly Pullback Phase required or the current failure to creare a new Bearish iBOS is just a pause in market for more bearish move to at least the Weekly Demand. More development required from LTFs.
4H Chart Analysis
1️⃣
🔹Swing Bearish
🔹Swing Continuation Phase (Pro Swing + Pro Fractal)
2️⃣
🔹After the Bearish BOS, price pulled back to the Swing EQ (50%) tapping into a Daily and a 4H Supply that caused a Bearish CHoCH and forming a Supply that price is contained within it.
3️⃣
🔹Price is currently ranging between Supply and Demand which clearly makes price indecisively have a clear direction. More developments required on LTFs to have a clear expectation.
Economic Events for the Week

Bearish drop?The Fiber (EUR/USD) is rising towards the pivot and could drop to the 1st support.
Pivot: 1.0332
1st Support: 1.0175
1st Resistance: 1.0464
Risk Warning:
Trading Forex and CFDs carries a high level of risk to your capital and you should only trade with money you can afford to lose. Trading Forex and CFDs may not be suitable for all investors, so please ensure that you fully understand the risks involved and seek independent advice if necessary.
Disclaimer:
The above opinions given constitute general market commentary, and do not constitute the opinion or advice of IC Markets or any form of personal or investment advice.
Any opinions, news, research, analyses, prices, other information, or links to third-party sites contained on this website are provided on an "as-is" basis, are intended only to be informative, is not an advice nor a recommendation, nor research, or a record of our trading prices, or an offer of, or solicitation for a transaction in any financial instrument and thus should not be treated as such. The information provided does not involve any specific investment objectives, financial situation and needs of any specific person who may receive it. Please be aware, that past performance is not a reliable indicator of future performance and/or results. Past Performance or Forward-looking scenarios based upon the reasonable beliefs of the third-party provider are not a guarantee of future performance. Actual results may differ materially from those anticipated in forward-looking or past performance statements. IC Markets makes no representation or warranty and assumes no liability as to the accuracy or completeness of the information provided, nor any loss arising from any investment based on a recommendation, forecast or any information supplied by any third-party.

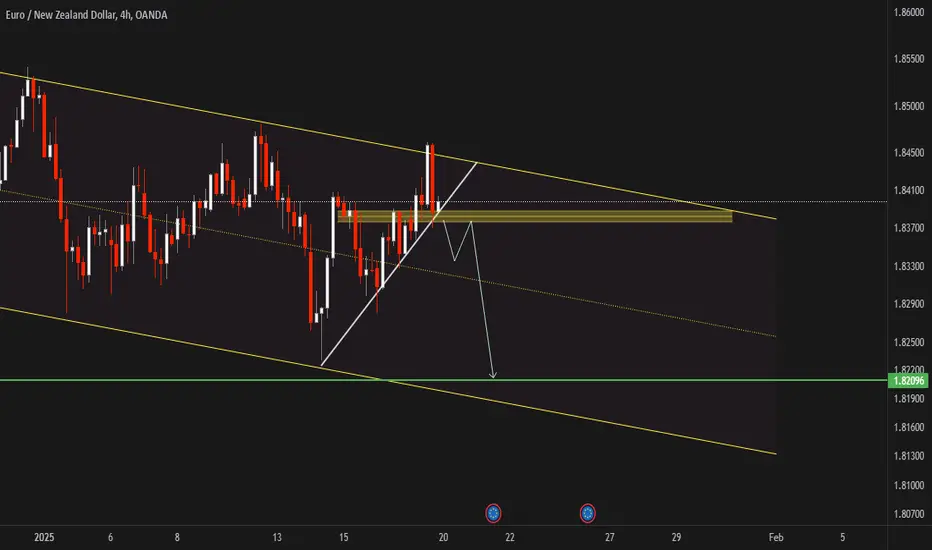
EURNZD (4H) DT ANALYSIS🔹 Symbol: EUR/NZD
🔹 Current Price: 1.83706
Key Observations:
Recent price action suggests a bearish trend as EUR/NZD approaches a critical resistance zone, indicating potential downside momentum.
Indicators such as RSI and MACD on higher timeframes show signals of weakening bullish strength, aligning with a possible trend reversal.
📉 Sell Order at 1.8271
This level is strategically placed below the current support zone, suggesting further bearish continuation if breached.
🚫 Stoploss: 1.8355
Positioned conservatively above the resistance level to manage risk effectively.
💰 Take Profit: 1.8187
Targeting a prior support level, aligning with anticipated bearish momentum for optimal profit.
Recommendations:
Monitor price action closely at the 1.8350 level. Any breakout above this level could invalidate the bearish outlook.
Ensure strict adherence to the stop loss to mitigate potential losses.
If price action accelerates towards 1.8271, prepare for potential volatility as key levels are tested.

EURUSD 19/01/25
Here's the revised version without bullet points:
This week marks a special occasion as we celebrate the birthday of our head mentor!
Heading into the week, we maintain the same bias as last week: focus on the lows being taken out, while the highs serve as key entry areas. The game plan is straightforward. Look for a solid pullback to sell into the lows, or wait for the lows to be run and then target a pullback to current highs or newly formed highs yet to emerge.
Our bias remains bearish, so patience is key. Wait for a run on the highs before taking action. There’s no need to overcomplicate things—if you’ve been following Orion, everything is already in place.
Trade safely, trust Orion, and always stick to your risk management plan.

EUR_CHF SWING LONG|
✅EUR_CHF is trading along
The rising support line and
We are already seeing a bullish
Rebound so we are bullish biased
And we will be expecting a
Further bullish move up
LONG🚀
✅Like and subscribe to never miss a new idea!✅

EURGBP Potential UpsidesHey Traders, in tomorrow's trading session we are monitoring EURGBP for a buying opportunity around 0.84200 zone, EURGBP is trading in an uptrend and currently is in a correction phase in which it is approaching the trend at 0.84200 support and resistance area.
Trade safe, Joe.

EURCHF Potential UpsidesHey Traders, in the coming week we are monitoring EURCHF for a buying opportunity around 0.93700 zone, EURCHF is trading in an uptrend and currently is in a correction phase in which it is approaching the trend at 0.93700 support and resistance area.
Trade safe, Joe.

EUR NZD H4 SELL It is a good position. When the price can break the yellow range with strength, it is expected to reach the sell target.
EURNZD Will Fall!
HI,Traders !
EUR-NZD made a retest
Of the horizontal resistance
Level of 1.844603 and we are
Already seeing a local
Bearish reaction so
We will be expecting a
Further move down!
Comment and subscribe to help us grow!

EURCHF Massive Short! SELL!
My dear subscribers,
My technical analysis for EURCHF is below:
The price is coiling around a solid key level - 0.9406
Bias - Bearish
Technical Indicators: Pivot Points Low anticipates a potential price reversal.
Super trend shows a clear sell, giving a perfect indicators' convergence.
Goal - 0.9385
My Stop Loss - 0.9417
About Used Indicators:
By the very nature of the supertrend indicator, it offers firm support and resistance levels for traders to enter and exit trades. Additionally, it also provides signals for setting stop losses
———————————
WISH YOU ALL LUCK

Euro can fall to buyer zone and then start to move upHello traders, I want share with you my opinion about Euro. By observing the chart, we can see that the price entered to pennant and started to decline. In this pattern, the price fell to the 1.0355 level and broke it, after which continued to decline to the buyer zone. In the buyer zone, the price reached the support line of the pennant and started to grow near this line, and later reached the resistance line. Soon Euro exited from the pennant pattern and rebounded up, higher than the 1.0355 resistance level, after which it made a small correction and then started to decline inside the downward channel. Inside this channel, the Euro broke the 1.0355 level one more time and fell to the support line, after which tried to reach the resistance line, but when it almost touched it, the EUR dropped to the buyer zone, breaking the 1.0250 support level. Next, the price fell to the support line, after which made a strong upward impulse, thereby exiting from the channel and breaking the 1.0250 level again. Euro some time traded near this level and then rose to the resistance level, after which started to decline. In my opinion, the Euro can fall to the buyer zone and then start to move up to the 1.0355 resistance level, where is locates my TP. Please share this idea with your friends and click Boost 🚀

EURNZD Will Go Lower! Short!
Please, check our technical outlook for EURNZD.
Time Frame: 9h
Current Trend: Bearish
Sentiment: Overbought (based on 7-period RSI)
Forecast: Bearish
The market is on a crucial zone of supply 1.839.
The above-mentioned technicals clearly indicate the dominance of sellers on the market. I recommend shorting the instrument, aiming at 1.826 level.
P.S
We determine oversold/overbought condition with RSI indicator.
When it drops below 30 - the market is considered to be oversold.
When it bounces above 70 - the market is considered to be overbought.
Like and subscribe and comment my ideas if you enjoy them!

EURBGP: Sell signal on the Channel Down top.EURGBP is almost overbought on its 1D technical outlook (RSI = 68.286, MACD = 0.003, ADX = 49.271) as it crossed over the 1D MA200 and almost touched the top of the short term Channel Down. This is a solid first entry for a short, the second being under the 1W MA200 near the dashed trendline of the long term Channel Down. Target the 0.786 Fibonacci retracement level (TP = 0.82800).
See how our prior idea has worked out:
## If you like our free content follow our profile to get more daily ideas. ##
## Comments and likes are greatly appreciated. ##

EURNZD - Potential Short from Resistance ZoneOANDA:EURNZD is currently approaching a significant supply zone near the 1.84500–1.85000 level. Historically, this area has acted as strong resistance, leading to bearish reversals. The recent bullish move into this zone suggests a potential for sellers to regain control and push prices lower.
A bearish confirmation, such as rejection patterns, bearish engulfing candles, or long upper wicks, would support the likelihood of a reversal. If the scenario materializes, the price may head toward the 1.83150 level, where buyers might step in again.
This setup aligns with a potential short-term retracement within the broader market structure. Traders should wait for confirmation of selling pressure before considering short positions.
